Guarda i video tutorial del Market su YouTube
Come acquistare un Robot di Trading o un indicatore
Esegui il tuo EA
hosting virtuale
hosting virtuale
Prova un indicatore/robot di trading prima di acquistarlo
Vuoi guadagnare nel Market?
Come presentare un prodotto per venderlo con successo
Nuovi indicatori tecnici per MetaTrader 5 - 24

Macd Sar! is a gcd indicator combined with the parabolic sar indicator! It has the strategy of breaks, where the gray line crosses above the pink lines, and exchange of parabolic sar points, it is marking purchase for sale is vice versa, works for all seasons! It is good for scalping, and to do lengths suitable for forex markets and synthetic indices! Good profit! World Investor.

Super Treend! It is an indicator whose strategy is based on line breaks giving a signal for sale or purchase, How well it looks when you are marking a sale, it puts a red dot on you, when you make a purchase, it marks a green dot, Accompanying with blue lines that sets the trend for sale, and the aqua line that sets the shopping trend for you, works for all seasons works for forex markets and synthetic indices! Good profit! World Investor.

Range Move It is an indicator that clearly shows you the supports, resistances and trend lines. to each candle that is running, said changing, the lines are changing accommodating the trend to have a better entrance! the indicator is for forex markets for synthetic index markets ! and for crypto too! It is used in all temporalities! Good profit! World Investor.

Channel Oscillator It is an oscillator indicator, which goes from strategy marking the high points, and the low points where it is accompanied by a band that marks those points, where it marks you with a signal of a block in the upper band when it is for sale, and it marks you with a block in the bearish band when it is bought. works for forex markets and synthetic indices It also works for crypto markets ideal for scalping, good profit World Investor.

Macd diverge! It is a macd indicator where it goes with the divergence indicator and arrows that mark the sale and purchase of the pair! It is very easy to use and at first glance you can see that you don't have to do a lot of analysis since the divergence marks the sail too! It can be used in all seasons! It is used for scalping! works for forex markets for crypto and synthetic index markets too! Good profit! World Investor.

filling It is an oscillator indicator, where it clearly marks sale and purchase, It has two colors, red and blue. red marks you buy, and blue marks you for sale, ideal for scalping and lengths! works for forex markets works for synthetic index markets ideal for volatility and jumps! It also works for crash and boom! walk in all temporalities! Good profit! World Investor.

macd rsi It is a macd indicator added to the rsi to capture perfect entries in the average crossovers! As seen in the indicator, it has 2 lines, one of gold color and the other violet line, where the cross of the violet with the gold downwards is a sell signal when it crosses the violet up from the gold it is a buy signal! very good to make shorts works for forex markets and synthetic indices It is used in any temporality! Good profit! World Investor.

Extreme indicator! is an oscillator that works with candle volume levels, where it consists of red and green colors, where you measure the sale and purchase! where it also comes with a line crossing format where it reconfirms the purchase or sale on this occasion, works for forex markets and for the synthetic index markets ! It works for all seasons! Good profit! World Investor.

Color range ! It is an indicator that indicates the volume of the candle giving you input or output depending on the color you touch on the candle! It works perfect for making H1 or H4 lengths! It also works for scalping but ideal for long! works at any time works for forex markets for synthetic index markets !!! also for crypto. Good profit!!!!!! World Investor.

extend ! is an oscillator indicator, Where you measure bullish and bearish trends ideal for scalping and lengths! The strategy consists of the crossing of lines, where it has 2 types of lines, one blue and one green! where the blue line crosses over the green line gives entry signal, where the green line crosses below the blue line gives a sell signal! It works for all seasons! Good profit! World Investor.

Swing Line! It is an indicator that easily captures a trend channel, be it bullish or bearish! being able to easily hunt the rebounds, long and short, as well as rebound support and resistance of the channel! The indicator is suitable for any temporality! very good for scalping and long! works for forex markets and synthetic indices also crypto! good profit World Investor .

Trendline! trend line indicator, support and resistance, ideal for hunting long and short! where it uses 2 lines, the red and the blue, the red one marks rebounds for sales, the blue one marks you rebounds for purchase And not only that, but it also marks you, the uptrend and downtrend. works for any season works for forex markets and synthetic indices! also crypto. Good profit! World Investor.

Stellar volume. is an oscillator, indicating the high ranges and the low ranges. marking the ceiling and floor of each trend on the oscillator, where the violet line crosses the gray line gives a purchase entry, where the violet line crosses the red line downwards gives a sell signal, very easy to use and very simple, works for forex markets and synthetic indices! and for any temporality to operate. Good profit! World Investor.

Ma Distance Parabolic! is a moving average indicator with parabolic sar ! ideal for hunting trends where there are two ideal points showing input there are 2 points where there are blue points that mark the rise and the other green point where it marks the drop The indicator gives you the entry signal when it gives the second point the position is taken. suitable for forex and synthetic indices, also crypto! Good profit! World Investor.

Zigzag Oscillator. it is an indicator programmed to hunt each point of the zigzag of the candle! as in the foreground of zigzag this oscillator takes you to simple measurements, to catch every bounce from floor to ceiling! Ideal for scalping and intraday. works for any season! for all forex pairs! for all pairs of synthetic indices ideal for volatility 75 and other jumps! Good profit! World Investor.

Oscillator Moving ! is an oscillator where it has 3 input points where is the orange line, the red line and the blue line where the orange line touches the ceiling of the blue line, it gives a buy entry signal. where the red line crosses the blue line gives a sell signal! very clear to see and very simple to use! It can be used at any time! can be used in Forex markets. In the synthetic and crypto index markets! good profit World Investor.

The Rubdfx swing indicator is a useful tool for traders looking to identify trend changes in a particular instrument they are trading. It is designed to draw a line on the main chart, and the signals are indicated by color changes with signal alerts. The color green is used to indicate a bullish trend, while the color pink is used to indicate a bearish trend. These colors can be customized to fit the trader's preferences or theme. The Rubdfx swing indicator has the ability to spot both long-te

The DR IDR Range Indicator PRO plots ADR, ODR and RDR ranges for a given amount of days in the past. A key feature that appears is that it calculates the success rate of the ranges for the shown days. This indicator is perfect for backtest since it shows ranges for all of the calculated days, not just the most recent sessions. In the PRO version you can now: use fully customizable advanced statistics to base your trades on get an edge via calculating statistics on up to 3 different day period

Recommended broker to use the indicator: https://tinyurl.com/5ftaha7c Indicator developed by Diogo Sawitzki Cansi to show possible trade points. Do not repaint. The results displayed in the past are exactly what happened. We also use it to hold trades longer and not get out on false reversal signals which are actually just a profit taking of trades and no one is trying to reverse the direction of the trend. Indicator Parameters: PERIOD: Period for analyzing the buying or selling force to fin
FREE
Think of an indicator that instantly shows you all supports, resistances and turncoats and can send a notification to your phone or an alarm on your computer. In addition to all these, it groups how many times it has entered each field and, accordingly, the strength of the field. Supply Demand And Turncoat is at your service. Setup for any TimeFrame and Chart you want and enjoy easy trading. Features: Ability to select the fields to be shown (weak, untested, turncoat, verified, proven) Merge fie
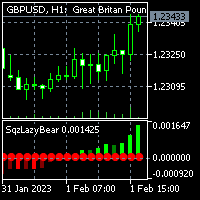
For MT4 version please click here . - This is the exact conversion from TradingView source: "Squeeze Momentum Indicator" By "LazyBear". - This is a non-repaint and light processing load indicator. - Buffers and inputs are available for use in EAs and optimization purposes. - You can message in private chat for further changes you need.
Thanks for downloading...

** All Symbols x All Timeframes scan just by pressing scanner button ** *** Contact me to send you instruction and add you in "M W Scanner group" for sharing or seeing experiences with other users. Introduction: Double Top(M) and Double Bottom(W) is a very repetitive common type of price reversal patterns. Double Top resembles M pattern and indicates bearish reversal whereas Double Bottom resembles W pattern and indicates a bullish reversal that they have high win rate. The M W Scanne

UPDATED The Non-Repaint zones is a time base indicator that scans for possible reversal of the market for perfect entry. It read the history and draws the possible zone for our comfort. The indicator possesses four different zones that read the history of the market over 10,000 previous bars and predict the possible entry point. It rescans every market trend change to give us the possible zone, it is used for trading all types of markets and does not repaint. The indicator has the following inp
FREE

Questo indicatore può essere considerato come un sistema di trading.
Offre una visione diversa per vedere la coppia di valute: questo indicatore senza tempo, può essere utilizzato per il trading manuale o per il trading automatizzato con EA. Quando il prezzo raggiunge una soglia viene creato un nuovo blocco secondo la modalità impostata.
L'indicatore oltre alle barre Renko mostra anche 3 medie mobili.
Caratteristiche
modalità Renko renko mediano Renko mediano personalizzato 3 medie mo
FREE

Day Points
Indicadtor that shows the points considered important for X days. (Open,Close, High, Low) Used a lot by those who do day trade. These points can be used for decision making by a trader. You will choose the amount of days ago for it to show.
Settings High/Low/Close/Open Show - True/False. Days - Number of days that will show on the chart. Color - Line Color. Style - Line Style.

FRB Trader - Our mission is to provide the best support for our clients through content and tools, so they can achieve their expected result. - If you have any questions or suggestions, please contact us. Your feedback is very important to us.
FRB Buy Agression
The indicator displays the Buy Aggression Balance of the selected TIMEFRAME through a histogram in a new window. This indicator can only be used if the broker provides data on volumes. In the forex market, most brokers do not provide

FRB Sell Agression - Indicator shows the Sell Agression Balance of the TIMEFRAMES chosen by the user through a histogram in a new window. - This indicator can only be used if the broker provides data on Volumes. Forex market brokers do not report this data. - B3 (Bovespa - Brazil) informs the data and with that it is possible to use it in Brazilian brokerages.
Settings Color - Define the color that will be shown in the histogram. Use Historical Data - Defines whether the indicator will calc

FRB Aggression Balance - Indicator shows the Agression Balance of the TIMEFRAMES chosen by the user through a histogram in a new window. - This indicator can only be used if the broker provides data on Volumes. Forex market brokers do not report this data. - B3 (Bovespa - Brazil) informs the data and with that it is possible to use it in Brazilian brokerages.
Settings Color - Define the color that will be shown in the histogram. Use Historical Data - Defines whether the indicator will calcu

The Supertrend etradro indicator is volatility based and is more of a trend following indicator in function. The ATR indicator, which is integrated into the calculation of the super trend, also calculates course gaps (gaps) and does not overlook them. This allows more accurate values to be calculated. When measuring volatility, the mean value of the current price serves as the basis. Since the Supertrend indicator features sliding stop and reversal lines, it is quite similar in function to the P
FREE

AC Pivot Panel
AC Pivot Panel is a pivot point indicator including favorite selection panel accessible in the chart. For pivot traders, It is well convenient to easily and quickly can adjust their pivots setting in the chart. To reaching this goal, a panel has been considered to user can easily switch to each pivot levels by different method and time period. In the current version: All pivots including supports and resistance can be selected to display or disappear in the chart just by
FREE

This powerful tool is designed to help traders identify key reversal patterns in their charts, including the hammer and star bar formations. With this indicator, you can quickly and easily spot these patterns as they form, allowing you to make well-informed trades and potentially increase your profits. The Hammer Start indicator is customizable, allowing you to set your own parameters for identifying patterns and alerts. Whether you're a seasoned trader or just starting out, the Hammer and Star
Premium Signal It is an oscillator that clearly marks when the trend ends and the new one is about to start. It has 1 green line that marks where the price is going and 2 bars 1 blue and the other coral the one in blue shows the strength of the rising candle and the coral color shows the strength of the downward candle. used in forex markets and in the synthetic index markets ideal for any temporality!

MA Project is an indicator with a set of moving averages programmed in rainbow where in 1 cross it marks a long tendency to grab, It is ideal to make lengths in h1 or h4! works for forex markets works for synthetic index markets It also works great on volatility jumps! adapts to any temporality! but it is programmed to make longs and catch trends! Good profit!!!!!

Volatility Premium ! It is an oscillator that is used to hunt the strength of the candlestick and catch the sniper trend the oscillator shows you levels of height where it captures the force of the candle accompanying the trend is clearly seen! works for forex markets works for synthetic index markets fits all pairs and to all temporalities! Good profit! World Inversor.

Rsi Project is an Rsi programmed to scalp on m1 , m5 and m15 , ideal for hunting revotes and with the naked eye the rsi marks the pecks on the ceilings and floors to grab those sails! It also serves to make long periods of time! It works for forex markets works for synthetic index markets fits all pairs ideal for volatility and jumps! Good profit! World Inversor !!!!

Trend Volatile It is an indicator programmed to hunt index breakers, comes with 2 colors of tears, the first is the Blue that hunts the break towards the UP the second is the LightBlue color that hunts the breakout to the LOW. It is very easy to use and very complete. suits forex markets to the synthetic index markets! It is used in any temporality! You can scalp and long! Good profit!
Drop Volatile , It is an indicator where you mark perfect entries with the tomato color line, where there is a bass line of the kind that marks the SL Stop loss, and a line above that marks you TP Take Profit, It's line is Blue color, where it marks input, tp and sl very easy to use! used in forex markets and synthetic indices all pairs are fit! It is used in all temporalities too! Easy to scalp or long Good profit!

BB Premium, It is a new technique of bollinger bands, but this is the 2.0 where it marks sales rebounds, purchase rebounds, and breakouts, where in the middle it touches the golden line, and shows a sell signal, marks the red spot as there is a downtrend, where it bounces off the floor that goes out of the band, marks a buy signal and marks the gray spot very easy to use and easy to hunt scalps or long trends suitable for all seasons and Forex markets and synthetic indices! Good profit!

PriceChannel! It is an indicator programmed to capture floor entries and ceiling sales! gives multiple inputs according to the temporality that you use it works for support and resistance too! It works in any temporality, works for forex currency markets ! for the pairs of synthetic indices ! Ideal for volatility and jumps! It also works for crash and boom! Good Profit, World Investor.

Range Target! indicator that marks the depletion of strength of the candle where it touches the floor and catches a trend, whether it is up or down The indicator has two support lines where it marks the floor and the ceiling. where on the same line marks the entry for rise or fall, the lines have Gold and Blue colors the gold line shows the purchase the blue line shows the sale works for any season works for forex markets works for synthetic index markets! Good Profit, World Investor.

MMA Target is an indicator that indicates moving average sessions where there are clear crosses that mark perfect entries goes in a set of colors from aggressive to passive where the cross of green above red gives entry to buy where the cross from red to green goes, it gives entry for sale, ideal for making long entries! It works for scalping too! works for forex markets works for synthetic index markets! Good Profit, World Investor.

Arrows Scalp Oscillator indicating buying and selling, It is added with arrows that indicate sell and buy, moving average crosses where they indicate the break to enter better being the sale or the purchase! perfect for scalping! in the Forex markets and synthetic indices! It also works for crypto! Suitable for any period of time, it can also be used for lengths! Good profit! World Investor.

Renko Gold! clearly indicates the floors and ceilings where it goes from 4 lines, the line below that marks the floor in green confirming with the thinnest line clarifies the purchase entry, the same is for sale, the top line marks the ceiling and the thinnest red line marks the sale, This indicator works for all temporalities! For Forex and Synthetic Indices markets! It also works for crypto markets! Good profit! World Investor.

Professional Channel! indicator that clearly marks the bullish and bearish channels also marking support and resistance! the line has 3 colors where the green color marks buy! the blue line is rebound and the red line is the one that marks the ceiling, that is, the sale! works for all seasons for forex markets and synthetic indices also for crypto markets! good profit World investor.

Positions panel
This is a panel for counting current icon holdings. Convenient traders at any time to view the position and profit and loss situation. Perfect for traders who like to hold multiple orders at the same time. Main functions: Position statistics Total profit Average price calculation TP price calculation ST price calculation Positions valume
FREE

Indicador Monte Carlo Simulation Indicador faz uma regressão linear nos preços de fechamento do ativo escolhido e gera uma simulação de Monte Carlo de N preços aleatórios para definir 3 níveis de sobrecompra e 3 níveis de sobrevenda. O primeiro processo é a Regressão Linear dos preços de fechamento do ativo, no qual é regido pela equação: Y = aX + b + R Onde Y é o valor do ativo escolhido, X é o tempo, a é a inclinação da reta, b é a intersecção da reta e R é o resíduo. O resí
FREE
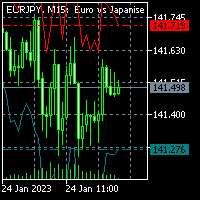
For MT4 version please click here . This is the exact conversion from TradingView: "Average True Range Stop Loss Finder" By "veryfid". - This indicator implements a deviation channel. - The channel determines trend direction as well as stop loss placement. - This is a non-repaint and light processing load indicator. - You can message in private chat for further changes you need.

Introduction Poppsir is a trend-range indicator for metatrader 5 (for now), which distinguishes sideways phases from trend phases.
With this tool it is possible to design a trend following-, meanreversion-, as well as a breakout strategy.
This indicator does not repaint!
The signal of the Poppsir indicator is quite easy to determine. As soon as the RSI and Popsir change their respective color to gray, a breakout takes place or in other words, the sideways phase has ended.
Interpret
FREE

MT4 Version Kill Zones
Kill Zones allows you to insert up to 3 time zones in the chart. The visual representation of the Kill Zones in the chart together with an alert and notification system helps you to ignore fake trading setups occurring outside the Kill Zones or specific trading sessions. Using Kill Zones in your trading will help you filter higher probability trading setups. You should select time ranges where the market usually reacts with high volatility. Based on EST time zone, f

To get access to MT4 version please click here . - This is the exact conversion from TradingView: "Stochastic Momentum Index" By "UCSgears". - This is a popular version of stochastic oscillator on tradingview. - This is a light-load processing and non-repaint indicator. - Buffers are available for the lines on chart. - You can message in private chat for further changes you need. Thanks for downloading
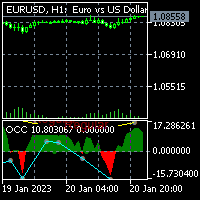
For MT4 version please click here . This is the exact conversion from TradingView: "Open Close Cross Alert R6.2 by JustUncleL" By "JayRogers". - This indicator implements Alerts as well as the visualizations but does not support multi-time frame. - Hidden/Regular divergences supported. - This is a non-repaint and light processing load indicator. - You can message in private chat for further changes you need.
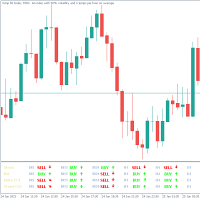
The Trend Assistant indicator is a technical analysis tool that helps traders identify the current trend of a financial instrument by analyzing different timeframes on a chart.
The indicator shows the trend based on M1 (1 minute) , M5 (5 minutes) , M15 (15 minutes) , M30 (30 minutes) , H1 (1 hour) , H4 (4 hours) , D1 (1 day) , W1 (1 week) , and MN1 (1 month) timeframes. The trend is represented by a colored arrows on the sub window chart, with a bullish trend shown in green and a bearish tre

The EMA Engulfing Cross indicator is an indicator for the MetaTrader 5 platform that signals potential buy and sell opportunities based on an engulfing candle pattern after a recent exponential moving average cross. You can adjust how recently the trend change must have occurred using the PASTemaCROSS input. The RSI oversold/overbought function is used to confirm the signals generated by the moving averages. It takes into account the previous bar before the engulfing bar, and it is best used wi

L'Indicatore del Tempo delle Sessioni di Trading:
L'Indicatore del Tempo delle Sessioni di Trading è uno strumento potente di analisi tecnica progettato per migliorare la comprensione delle diverse sessioni di trading nel mercato forex. Questo indicatore integrato in modo trasparente fornisce informazioni cruciali sugli orari di apertura e chiusura delle principali sessioni, tra cui Tokyo, Londra e New York. Con l'aggiustamento automatico del fuso orario, si rivolge ai trader di tutto il mond
FREE

** All Symbols x All Timeframes scan just by pressing scanner button ** *** Contact me to send you instruction and add you in "Market Structure group" for sharing or seeing experiences with other users. Introduction: Market structure is important for both new and professional traders since it can influence the liquidity and price action of a market. It’s also one of the most commonly used techniques to understand trends, identify potential reversal points, and get a feel for current mar

Versione MT4 Golden Hunter è stato sviluppato per i trader che operano manualmente sui mercati. Si tratta di uno strumento molto potente composto da 3 diversi indicatori: Potente strategia di ingresso: formata da un indicatore che misura la volatilità della coppia di valute e identifica la tendenza del mercato. LSMA: attenua i dati di prezzo ed è utile per individuare la tendenza a breve termine. Heikin Ashi: una volta collegato l'indicatore al grafico, le candele giapponesi cambieranno in ca
FREE

Candle Counter This product counts the candles and shows the result according to the configuration defined by the user. Professional traders use it to emphasize a specific candlestick.
Settings Position - Choose whether the numbers will be displayed above or below the candle Distance - The distance that the number will have from the candle, referring to the minimum or maximum Font Size - Font Size Color - Font Color

Candle High Low
Indicator showing High and Low of X candles across a line.
Settings Candle number for calculation (>= 1 ) - Define the number of candles for the indicator to find the maximum and minimum of that period of candles. Continuation of the line's display to the right - If you want the High and Low line to extend to the right edge of the graph Line High Color - Set line color Line High Style - Set line style Line Low Color - Set line color Line Low Style - Set line style

Like most things that work in trading, it's really simple. However, it's one of the most powerful tools I have that makes entries of many systems much more precise.
In its essence, it measures the recent volatility against the medium-term average. How does it work? Markets tend to be prone to strong trending movements when relative volatility is low and tend to be mean-reverting when relative volatility is high.
It can be used with both mean-reversion systems (like the Golden Pickaxe) an
FREE

This is a derivative of John Carter's "TTM Squeeze" volatility indicator, as discussed in his book "Mastering the Trade" (chapter 11).
Black crosses on the midline show that the market just entered a squeeze ( Bollinger Bands are with in Keltner Channel). This signifies low volatility , market preparing itself for an explosive move (up or down). Gray crosses signify "Squeeze release".
Mr.Carter suggests waiting till the first gray after a black cross, and taking a position in

Profit Aqua , It is an indicator that belongs to the jungle project that has 3 indicators On this occasion, play with the profit aqua indicator, that has the strategy of a professionally programmed moving average to facilitate all types of entry It has the color change strategy, as seen in the photo when it changes red it is clearly marking a short entry when the green color clearly marks you in long, You can do scalping and at long periods of time! It is used for forex and synthetic indices Sui

Stochastic Jungle . It has a new pack called jungle, on this occasion I bring the indicator, stochastic jungle that has the strategy of high ranges and low ranges to better hunt trends and entries according to their temporality He is professionally programmed to make entries with high effectiveness percentages, where it touches the green ceiling and changes color to orange marks entry into low where it is upside down and touches the floor with the orange color changing to green is an upward entr

This is the MT5 version of the absolute OCD tool that delivers Position Size Calculator and many more other options of the matured PSI Position Smart Indicator NEW check the FULL Version Including the private ICT tools limited so far until the release of the full 2016 Mentorship Core Content to the public. Indicator type: Money Management Calculator; Forex Position Size Calculator; Fixed or ATR value for Stop Loss and Take Profit levels; Average Position Size Indicator (True Average Price); Acc

dmi jungle It is the last indicator of the jungle pack On this occasion, it has the DMI jungle indicator, which goes from the strategy of the oscillator with the line crossing, and the color changes, when it gives a line crossing and a color change from gold to lightgreen it is a trend change vice versa it is always the same with the crossing of the line! It works for Forex markets and synthetic indices! Suitable for all seasons! Good profit!

Strength Safari , First indicator of the safari pack On this occasion we have an oscillator that gives perfect crosses indicating where the clear input is At two points is the green line and the gold line where the entrance marks you where it touches the floor or ceiling At the crossing of the lines, the green one above the gold marks the ascent zone, The gold crossing the truth marks the drop zone, ideal for grabbing long trends! used at any time in the Forex and Synthetic Indices markets! Good

Renko Professional, Safari pack indicator 2 . On this occasion it has the professional renko indicator, which has the strategy of support, resistance, bullish green line and bearish red line. It marks the entry points and accumulation points very well! It works for all seasons! For the forex markets and synthetic indices ! Works for all pairs! Good profit!

Filter Professional , Safari pack indicator 3, It has an indicator that is a type of moving average with color that will mark the entrance perfect at different times, when it marks the green line, an upward trend is coming and it is entry for purchase, when it marks the gold line it is a downtrend gives bearish entry zone. It is used for the Forex markets and synthetic indices all pairs! All temporalities! Good profit!

Professional Candles It is the indicator 4 of the Safari pack It has an oscillator that marks each point of the forces of the candles Not only that, but it also measures it by color to be able to fit in perfectly. It is used for scalping and intra day, works for forex markets and synthetic indices works for all pairs ideal for volatility and jumps! works for all seasons! Good profit!

MA Safari, Indicator number 5 of the Safari Pack. It has a series of moving averages where the crossing arrives and gives a very clear entry, perfect for large temporalities, to catch long trends. It works for all seasons. Ideal for forex currency markets and synthetic indices! Ideal for volatility and jumps, go in all pairs! Good profit!! World Inversor !!!!

Bolinger Professional Bands, Last indicator of the Safari Pack. in this last indicator we find a unique programming of bolinger bands where you can better catch the rebounds on the bands above and below, works for forex currency markets! synthetic index markets and also crypto! It works in all temporalities and all pairs! Good profit! World Inversor!!!!!
Il MetaTrader Market è un sito semplice e pratico dove gli sviluppatori possono vendere le loro applicazioni di trading.
Ti aiuteremo a pubblicare il tuo prodotto e ti spiegheremo come prepararne la descrizione per il Market. Tutte le applicazioni sul Market sono protette da crittografia e possono essere eseguite solo sul computer dell'acquirente. La copia illegale è impossibile.
Ti stai perdendo delle opportunità di trading:
- App di trading gratuite
- Oltre 8.000 segnali per il copy trading
- Notizie economiche per esplorare i mercati finanziari
Registrazione
Accedi
Se non hai un account, registrati
Consenti l'uso dei cookie per accedere al sito MQL5.com.
Abilita le impostazioni necessarie nel browser, altrimenti non sarà possibile accedere.