Guarda i video tutorial del Market su YouTube
Come acquistare un Robot di Trading o un indicatore
Esegui il tuo EA
hosting virtuale
hosting virtuale
Prova un indicatore/robot di trading prima di acquistarlo
Vuoi guadagnare nel Market?
Come presentare un prodotto per venderlo con successo
Expert Advisors e indicatori a pagamento per MetaTrader 4 - 245

This is an easy to use signal indicator which shows and alerts probability measures for buys and sells in near future. It is based on statistical data gathered on existing history and takes into account all observed price changes versus corresponding bar intervals in the past. The statistical calculations use the same matrix as another related indicator - PointsVsBars. Once the indicator is placed on a chart, it shows 2 labels with current estimation of signal probability and alerts when signal

The indicator provides a statistic histogram of estimated price movements for intraday bars. It builds a histogram of average price movements for every intraday bar in history, separately for each day of week. Bars with movements above standard deviation or with higher percentage of buys than sells, or vice versa, can be used as direct trading signals. The indicator looks up current symbol history and sums up returns on every single intraday bar on a specific day of week. For example, if current

This is an intraday indicator that uses conventional formulae for daily and weekly levels of pivot, resistance and support, but updates them dynamically bar by bar. It answers the question how pivot levels would behave if every bar were considered as the last bar of a day. At every point in time, it takes N latest bars into consideration, where N is either the number of bars in a day (round the clock, i.e. in 24h) or the number of bars in a week - for daily and weekly levels correspondingly. So,
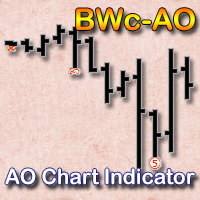
Indicator displays signals of the Awesome Oscillator on the chart according to the strategy of Bill Williams:
Signal "Saucer" - is the only signal to buy (sell), which is formed when the Awesome Oscillator histogram is above (below) the zero line. A "Saucer" is formed when the histogram changes its direction from descending to ascending (buy signal) or from ascending to descending (sell signal). In this case all the columns AO histogram should be above the zero line (for a buy signal) or bel

Most of traders use resistance and support levels for trading, and many people draw these levels as lines that go through extremums on a chart. When someone does this manually, he normally does this his own way, and every trader finds different lines as important. How can one be sure that his vision is correct? This indicator helps to solve this problem. It builds a complete set of virtual lines of resistance and support around current price and calculates density function for spatial distributi

The Alex Week Expert Advisor trades GBP/USD, EUR/USD, USD/JPY using pending orders only. Pending orders are placed at the breakthrough of important levels, which are accumulated throughout a trading week. Upon completion of the trading week, pending orders are deleted. The main rule of the EA is to preserve and increase the account balance without large risks. Unlike Alex Profis , this EA stores old signals for one week. It is very useful for a sharp change of trend. The EA works on H1. The Expe

Controladora means in Spanish controller, this is a simple yet powerful Expert Advisor that allows you to control your trading easily and precisely. Do you want to stop your trade when the price cross a trend line? Don't worry, Controladora can do it. Do you want to take profit when the price reaches the top of a channel? Controladora can do it as well. Calculating the exact proportion of your account by opening a trade, which size represents in case of loss a percentage of your balance, is time

The indicator displays signals according to the strategy of Bill Williams on a chart:
1. Signal "First Wise Man" is formed when there is a divergent bar with angulation. A bullish divergent bar has a lower minimum and the closing price in its upper half. A bearish divergent bar has a higher maximum and the closing price at the bottom half. Angulation is formed when all three lines of Alligator are intertwined, and the price has gone up significantly(or downwards). A valid bullish/bearish div

Indicator Cloud is drawing "clouds" on the chart. If the current price is behind the cloud then no actions should be done. If the current price departs from the cloud then one should consider to go Long or Short according to the price movement. Input parameters: Period1 and Method1 could be used as indicator settings for each TimeFrame and Currency pairs.

The indicator displays most prominent price levels and their changes in history. It dynamically detects regions where price movements form attractors and shows up to 8 of them. The attractors can serve as resistance or support levels and outer bounds for rates. Parameters: WindowSize - number of bars in the sliding window which is used for detection of attractors; default is 100; MaxBar - number of bars to process (for performance optimization); default is 1000; when the indicator is called from
Self Explanatory Indicator: buy when the Aqua line crossing the Yellow line upward and Sell when the Aqua line crossing the Yellow line downwards. Input parameters: Period1 = 13. Method1 = 2. MODE_SMA=0, MODE_EMA=1, MODE_SMMA=2, MODE_LWMA=3. Period2 = 5. Method2 = 0. MODE_SMA=0, MODE_EMA=1, MODE_SMMA=2, MODE_LWMA=3.

This indicator is designed for H1 timeframe and shows: Sum of points when the price goes up (Green Histogram). Sum of points when the price goes down (Red Histogram). In other words, by the number and ratio of bullish points to bearish ones, you can do a technical analysis of the state of the market.
If the green histogram prevails over the red one, you can conclude that at the moment the buyers are stronger than the sellers, and vice versa, if the red histogram prevails over the green, the s

This indicator is intended to guard your open position at any time frame and currency pair.
Long position In case the current price goes above the Take Profit price or below the Stop Loss price of the opened position and the Dealing Desk does not close this position, the indicator creates an Excel file with the name: Buy-TP_Symbol_Date.csv or Buy-SL_Symbol_Date.csv which will be placed in the folder: C:\Program Files\ ........\MQL4\Files Excel file for Buy-TP: You will have a first line of d

If you like trading crosses (such as AUDJPY, CADJPY, EURCHF, and similar), you should take into account what happens with major currencies (especially, USD and EUR) against the work pair: for example, while trading AUDJPY, important levels from AUDUSD and USDJPY may have an implicit effect. This indicator allows you to view hidden levels, calculated from the major rates. It finds nearest extremums in major quotes for specified history depth, which most likely form resistence or support levels, a

Description Impulse Smart is an indicator impulse trading system based on Moving Average and MACD Classic Smart with sound notification . The idea of the impulse system based on Moving Average and MACD Histogram was first offered by Dr. Alexander Elder in his book "Come Into My Trading Room" . The system allows users to choose the calculation method ( Moving Average and MACD Classic Smart ) based on a single, double or triple moving average with identification of primary signal of pr

This indicator predicts rate changes based on the chart display principle. It uses the idea that the price fluctuations consist of "action" and "reaction" phases, and the "reaction" is comparable and similar to the "action", so mirroring can be used to predict it. The indicator has three parameters: predict - the number of bars for prediction (24 by default); depth - the number of past bars that will be used as mirror points; for all depth mirroring points an MA is calculated and drawn on the ch

The Display Trend Moving Averages System indicator ( see its description ) shows information about direction of trends H1, H4, D1, W1, MN on all timeframes in one window, so that you can track changes in the average price before the oldest bar closes. A trend unit is a Moving Average with period "1" of the close of the oldest bar (H1, H4, D1, W1, MN). The indicator recalculates values of older bars for internal bars and draws a trend slope in the chart window as colored names of time intervals:

The Expert Advisor notifies that a price has crossed a line on the chart. It handles two types of lines - horizontal line and a trendline. The number of lines is unlimited. Parameters: prefix of signal line - prefix of object (line) names processed by the indicator. If the parameter is empty, it handles all object types: horizontal lines and trendlines. price Mode - price type (bid or ask). timeout - crossing alert timeout. number of repeats - the limit of crossing alert repeats. number of comme

Did you have to start again the very same analysis because the original one, from where you want to modify, just have so much information that no longer fits? Have you ever wanted to change some in one of your charts and make this new line, Fibo or channel automatically appear in some or the rest of your set of charts? Object Copier is the solution to replicate any object into one or several charts at your desire. No matter if you changed an object, or made it from the scratch. With Object Copie

Stay ahead of the market: predict buying and selling pressure with ease
This indicator analyzes past price action to anticipate buying and selling pressure in the market: it does so by looking back into the past and analyzing price peaks and valleys around the current price. It is a state-of-the-art confirmation indicator. [ Installation Guide | Update Guide | Troubleshooting | FAQ | All Products ] Predict buying and selling pressure in the market Avoid getting caught in buying selling frenzies
Support occurs when falling prices stop, change direction, and begin to rise. Support is often viewed as a “floor” which is supporting, or holding up, prices. Resistance is a price level where rising prices stop, change direction, and begin to fall. Resistance is often viewed as a “ceiling” keeping prices from rising higher. This indicator will draw the Support and Resistance lines calculated on the nBars distance. If input parameter Fibo = true then the Fibonacci lines will appear between those

This indicator calculates how much has an instrument won or lost in percentage terms on each bar displayed in the chart. [ Installation Guide | Update Guide | Troubleshooting | FAQ | All Products ]
Identify market patterns Find decisive price movements Be suspicious about overbought/oversold situations It is an extremely easy to use indicator... The blue histogram represents winning bars The red histogram represents losing bars The gray line represents the average win/loss per bar
Labels are

The Two Moving Averages indicator concurrently displays two Moving Averages with default settings in the main chart window: Green and Red lines that represent a short-term trend. You can change the moving average settings and colors. However, these parameters have been configured so that to allow trading on all timeframes. Take a look at how the Moving Averages lines can be used in a profitable multi-currency Trading Strategy on all time frames, that is also suitable for trading in your mobile t

The Three Moving Averages indicator concurrently displays three Moving Averages with default settings in the main chart window: Green and Red lines represent a short-term trend, Red and Blue lines - long-term trend. You can change the moving average settings and colors. However, these parameters have been configured so that to allow trading on all timeframes. Take a look at how the Moving Averages lines can be used in a profitable multi-currency Trading Strategy on all time frames, that is also

Fibonacci levels are commonly used in finance markets trading to identify and trade off support and resistance levels.
After a significant price movement up or down, the new support and resistance levels are often at or near these trend lines
Fibonacci lines are building on the base of High / Low prices of the previous day.
Reference point - the closing price of the previous day.
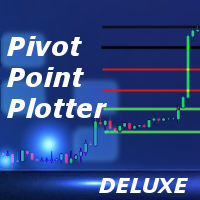
Overview This is the DELUXE version in the Pivot Point Plotter Series. It is a robust indicator that dynamically calculates and plots any of the 4 major pivot points on your chart irrespective of intra day timeframe on which the indicator is placed. This indicator is capable of plotting STANDARD, CAMARILLA, FIBONNACI or WOODIE daily pivot points. Whichever you use in your trading, this indicator is your one-stop shop. Kindly note that it is a DAILY Pivot Point Plotter for DAY TRADERS who trade o
Fractal Support/Resistance Clusters is an indicator that draws support and resistance lines based on fractals whose sources have not yet been broken and are therefore still relevant. A fractal is relevant as an indicator of support or resistance when the price of its previous opposing fractal has not been broken. Clusters of support and resistance zones are derived using the density-based spatial clustering of applications with noise (DBSCAN) algorithm and can be drawn on the screen. These clust

This is an indicator that allows displaying three currency pairs in one window. Input Parameters: Symbol1 - first currency pair. symbol1mirrior - mirror display of the first currency pair. s1color - color of the first currency pair. Symbol2 - second currency pair. symbol2mirrior - mirror display of the second currency pair. Symbol3 - third currency pair. symbol3mirrior - mirror display of the third currency pair. Symbo4 - fourth currency pair. symbol4mirrior - mirror display of the fourth cur
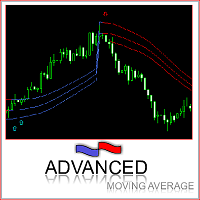
This indicator was built based on Moving Average, but it always reset counter at the first bar of day/week/month. Simple arrow signal to show buy/sell signal. 3 lines of moving average can be used as price channel, this is market trend also. time_zone option allows choosing time for trading and session movement analysis.

This script allows you to close all orders and delete all pending orders. Set to true order type you want to close and cancel. Parameters:
AllCurrency = set true to close position and cancel order in all pair, set false for current pair. CloseBUY = set true to close buy position. CloseSELL = set true to close sell position. DeleteBUYSTOP = set true to cancel buy stop order. DeleteSELLSTOP = set true to cancel sell stop order. DeleteBUYLIMIT = set true to cancel buy limit order. DeleteSEL

This indicator is developed to show the average movement of any 2 correlated currency pairs of the same TF. The crossing of 2 lines (in case with "EURUSD" (blue line) and "USDCHF" (yellow line)) is signaling about ascending or descending trend. Input parameters: symbol1 = EURUSD MAPeriod1 = 13 MAMethod1 = 0. Possible values: MODE_SMA = 0, MODE_EMA = 1, MODE_SMMA = 2, MODE_LWMA = 3. MAPrice1 = 1. Possible values: PRICE_CLOSE = 0, PRICE_OPEN = 1, PRICE_HIGH = 2, PRICE_LOW = 3, PRICE_MEDIAN = 4, PR

Description Impulse Grand Global is an indicator impulse trading system based on Moving Average and MACD Classic Global . The idea of the impulse system based on Moving Average and MACD Histogram was first offered by Dr. Alexander Elder in his book "Come Into My Trading Room". The system allows users to choose the calculation method ( Moving Average and MACD Classic Global ) based on a single, double or triple moving average with identification of primary signal of probable reverse of

Description Impulse System Global is an indicator impulse trading system based on Moving Average and MACD Histo Global . The idea of the impulse system which is based on Moving Average and MACD Histogram was first offered by Dr. Alexander Elder in his book "Come Into My Trading Room". The system allows users to choose the calculation method ( Moving Average and MACD Histo Global ) based on a single, double or triple moving average with identification of primary signal of probable reve

CorExTi is a tool that will save you literally hours in your daily routine to draw lines and other graphic elements in your charts. With a temporary panel discreetly displayed on your screen at the touch of a graphic element as trendline: Changes the object between 4 favorite line styles (with color, line thickness and style) Cuts trendlines, when are extended, just at the point where you touch them Extends trendlines (active property of Ray) which are not extended Or deactivates visualizat

Description Impulse Pro Global is an indicator's impulse trading system based on Moving Average and MACD Line Global . The idea of the impulse system based on Moving Average and MACD Histogram was first offered by Dr. Alexander Elder in his book "Come Into My Trading Room". The system allows users to choose the calculation method ( Moving Average and MACD Line Global ) based on a single, double or triple moving average with identification of primary signal of probable reverse of the previ

The best way to monitor multiple pairs within little workspace. RotaGrafico sequentially displays up to 6 different pairs. It has buttons to set a pair more time for observation. Normal exposure time adjustable. Broad exposure time adjustable. Combine in a profile, Rotagrafico and use the rest of your workspace to the pair that you want to analyze in detail.

The indicator creates 2 dot lines representing an upper and lower bands and the main indicator aqua line as the price power. If the main line is swimming inside the bands, then you should wait and watch before entering the market. When the main line jumps out or in the bands, then you should make a long or a short position.

Identify precise entry and exit points with AB=CD patterns
This indicator finds AB=CD retracement patterns. The AB=CD Retracement pattern is a 4-point price structure where the initial price segment is partially retraced and followed by an equidistant move from the completion of the pullback, and is the basic foundation for all harmonic patterns. [ Installation Guide | Update Guide | Troubleshooting | FAQ | All Products ]
Customizable pattern sizes
Customizable AC and BD ratios Customizabl
MACD – multiple timeframes Indicator name: MACDMTF Indicator used: MACD Traditional multiple timeframe indicator always has an issue of REPAINTING, when a trader wants to establish his/her strategy using Multi-Time-Frame (MTF). Generally, you should know how MTF indicator re-paints. But I will explain with the following example: Suppose that you are using traditional MTF MACD (H4) in (H1) chart. At 15:20, the MACD (H4) dropped below water line (0 level). Now, what happens on H1 chart? MACD of C

One of the oldest maxims in trading is ‘let the trend be your friend’. You must have come across it! This is easier said than done! First, you have to identify one, then you have to stay in – not easy. Staying in a trend to maximise your profits is extremely difficult. In addition, how do you know when a trend has started? It’s very easy to look back and identify the trend. Not so easy at the live edge of the market. The Quantum Trends indicator is the ‘sister’ indicator to the Quantum Trend Mon

If you've been trading for any time, you will almost certainly have come across the concept of support and resistance. This powerful and simple concept lies at the heart of technical analysis. It forms the cornerstone of price action trading. Strange to consider therefore, that such a key component of the traders chart has largely been ignored. Most Forex traders still draw their lines manually, leading to a crude interpretation of these key levels. Even those companies who have developed a trad

For aspiring price action traders, reading a candle chart at speed can be learnt, but is a skill which takes years to perfect. For lesser mortals, help is required, and this is where the Quantum Dynamic Price Pivots indicator steps in to help. As a leading indicator based purely on price action, the indicator delivers simple clear signals in abundance, highlighting potential reversals with clinical efficiency. Just like volume and price, pivots are another ‘predictive’ indicator, and a leading i

Have you ever wondered why so many Forex traders get trapped in weak positions on the wrong side of the market? One of the easiest ways the market makers do this, is by using volatility. A currency pair moves suddenly, often on a news release or economic data. Traders jump in, expecting some quick and easy profits, but the move suddenly moves in the opposite direction. This happens in all timeframes, and in all currency pairs. The candle or bar closes, with a wide spread, but then reverses sharp

Many Forex traders have either been told, or have learnt from painful experience, that the Yen currency pairs can be both dangerous and volatile to trade. The GBP/JPY is perhaps the most infamous and volatile of all. No wonder then, that many Forex traders simply stay away from the Yen currency pairs. But then they probably don’t have a very clear idea of where the Yen itself is heading. If they did, then trading the Yen pairs would be much more straightforward. And this is where the Quantum JPY

The US dollar sits at the heart of all the financial markets. It is the currency of first reserve. It is the ultimate safe haven currency, and it is the currency in which all commodities are priced. It is the currency which every Forex trader should consider – first! Having a view of the US dollar is paramount in gauging market sentiment, attitude to risk, and money flows into related markets and instruments. If you know which way the USD is headed – the rest is easy. The Quantum DXY indicator g

Your success as a forex trader depends on being able to identify when a currency or currency pair is oversold or overbought. If it is strong or weak. It is this concept which lies at the heart of forex trading. Without the Quantum Currency Strength indicator, it is almost impossible. There are simply too many currencies and too many pairs to do this quickly and easily yourself. You need help! The Quantum Currency Strength indicator has been designed with one simple objective in mind. To give you
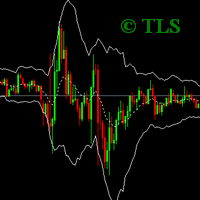
Versione estesa dell'indicatore "Keltner Channel". Questo è uno strumento analitico che consente di determinare il rapporto tra la posizione del prezzo rispetto alla sua volatilità. È possibile utilizzare 26 tipi di media mobile e 11 opzioni di prezzo per calcolare la linea centrale dell'indicatore. Avvisi configurabili ti avviseranno quando il prezzo tocca il bordo superiore o inferiore del canale. Tipi di media disponibili: media mobile semplice, media mobile esponenziale, media mobile esponen
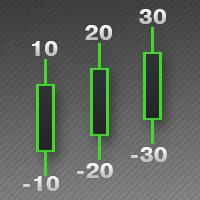
This indicator is used to indicate the difference between the highest and lowest prices of the K line, as well as the difference between the closing price and the opening price, so that traders can visually see the length of the K line.
The number above is the difference between High and Low, and the number below is the difference between Close and Open.
This indicator provides filtering function, and users can only select K lines that meet the criteria, such as positive line or negative
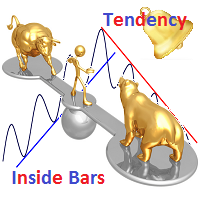
Description The indicator determines the appearance of internal bars on the chart, and paints them in accordance with the bullish and/or bearish mood. The indicator is different from Inside Bar in the same way as Tendency Reversal Bars is different from Reversal Bars . In other words, the indicator defines the appearance of internal bars during a bullish or bearish trend rather than defining their single appearance. The indicator can notify of the appearance of a formed internal bar by playi

Indicator for determining flat and trend.
If the price is below any of the two histograms and two lines (red and blue), this is a sell zone.
When purchasing this version of the indicator, MT5 version for one real and one demo account - as a gift (to receive, write me a private message)!
If the price is above any of the two histograms and two lines (red and blue), this is a buy zone. MT5 version: https://www.mql5.com/en/market/product/70409 If the price is between two lines or in the zone
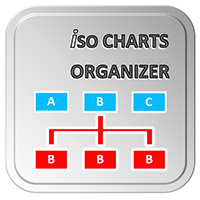
Analyzing of multiple charts has always been one of the biggest challenges for professional traders. However, this can be overcome by increasing the number of monitors. But we'll give you a simple, cost-effective solution here.
A simple Solution ISO Charts Organizer (Chart Clipper) allows you to categorize a large number of open charts without having to increase the number of monitors and easily access them all quickly or enjoy auto switching feature.
All features that you need Charts can be
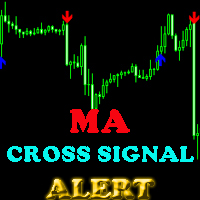
This indicator will help you show signals when the fast MA and slow MA (moving average) cross. The signals are displayed as up and down arrows (see picture). It can also give you a Pop Up Alert or Notification on your Phone or sending you an Email to inform the signal (this mode can be turned on/off in parameters). There are 2 MA crossovers to use: fast MA1 crosses slow MA1
fast MA2 crosses slow MA2 And there is one more MA line, MA3, to filter alert. When fast MA1 crosses slow MA1, the signa

Lot size calculator ( see the description ) calculates the lot size based on percent of free margin, as well as profit, loss and P/L ratio for a planned position by moving horizontal levels in the chart window. More advanced analog of Lot Calculation is Profit Factor indicator.

The Level Moving Averages Message indicator ( see the description and video ) does not draw the Moving Average line in the chart window but marks the Moving Average level on all time frames in accordance with the specified parameters. The level move frequency corresponds to the TimeFrame parameter value specified. The advantage of this indicator lies in the fact that it offers the possibility of monitoring the interaction between the price and the MA of a higher time frame on a lower one (e.g.,
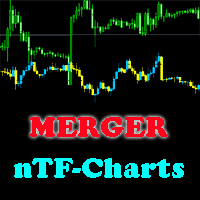
This indicator will help you merge two (or more than two) charts to view multi-symbols in just 1 chart (see the screenshots). You can choose any symbols to add with any timeframe you want. You can choose bull/bear color for bars. You can mirror the chart that will be added. If you want to add many charts, just run the indicator many times with each symbol and each timeframe.

FFx PinBar Setup Alerter gives trade suggestions with Entry, Target 1, Target 2 and StopLoss. Below are the different options available: Entry suggestion - pips to be added over the break for the entry Minimum candle size - to avoid too small candles
3 different options to calculate the SL - by pips, by ATR multiplier or at the pattern High/Low 3 different options to calculate the 2 TPs - by pips, by ATR multiplier or at Risk/Reward Offset the dashboard - any place on the chart Remove the sugge

FFx InsideBar Setup Alerter gives trade suggestions with Entry, Target 1, Target 2 and StopLoss. Below are the different options available: Entry suggestion - pips to be added over the break for the entry Minimum candle size - to avoid too close buy/sell entry suggestions 3 different options to calculate the SL - by pips, by ATR multiplier or at the pattern High/Low 3 different options to calculate the 2 TPs - by pips, by ATR multiplier or at Risk/Reward Offset the dashboard - any place on the c

This Expert Advisor checks the Price before Start_Hour (input parameter) and opens Buy or Sell position if the conditions are right. You have PipsLevelOpen and PipsLevelClose input parameters to optimize the EA for each and every currency pair and timeframe. You can switch TrailingStop off by setting this input parameters to 0 (zero). If UseMM (input parameter) = true, then Money Management system will be switched on with PercentMM (input parameter) as a percent from Account Free Margin .

FFx OutsideBar Setup Alerter gives trade suggestions with Entry, Target 1, Target 2 and StopLoss. Below are the different options available: Entry suggestion - pips to be added over the break for the entry. 3 different options to calculate the SL - by pips, by ATR multiplier or at the pattern High/Low. 3 different options to calculate the 2 TPs - by pips, by ATR multiplier or at Risk/Reward. Offset the dashboard - any place on the chart. Remove the suggestion once the price reached the SL line.

FFx Engulfing Setup Alerter gives trade suggestions with Entry, Target 1, Target 2 and StopLoss. Below are the different options available: Entry suggestion - pips to be added over the break for the entry 3 different options to calculate the SL - by pips, by ATR multiplier or at the pattern High/Low 3 different options to calculate the 2 TPs - by pips, by ATR multiplier or at Risk/Reward Offset the dashboard - any place on the chart Remove the suggestion once the price reached the SL line Lines

Description Impulse Pro is an impulse system based on two indicators - Moving Average and MACD-Histogram . The impulse system was first designed by A. Elder and is featured in his book "Come Into My Trading Room: A Complete Guide to Trading". The system is based on the Moving Average and MACD-Histogram. This product is distinct in that it allows the user to choose the system calculation method (Moving Average and MACD-Histogram) based on a single, double or triple moving average. There is pos

Esperto multiuso. Risolve il problema della scelta di un obiettivo: la direzione del movimento dei prezzi. Il blocco e la copertura sono il principio principale di questo Expert Advisor. Secondo la legge delle fluttuazioni armoniche, il prezzo sotto forma di rollback (correzione) ritorna nella sua posizione originale. Bilanciandosi simultaneamente con gli ordini multidirezionali, l'EA fissa i profitti sulle inversioni di mercato. L'Expert Advisor è efficace in condizioni di maggiore volatilità

The original Ilan EA for MetaTrader 4 This is the original Ilan EA for the MetaTrader 4 trading terminal. The strategy needs no advertising as it is well known even to novice traders.
Settings of the Expert Advisor The Expert Advisor can easily be set, while allowing you to adjust any important parameters of the strategy. Available Features: Unique MagicNumber for identification of trades; Trade direction option ( Trade direction ): buy only, sell only, or both directions simultaneously; Ste

The Level Moving Averages indicator ( see the description and video ) does not draw the Moving Average line in the chart window but marks the Moving Average level on all time frames in accordance with the specified parameters. The level move frequency corresponds to the TimeFrame parameter value specified. The advantage of this indicator lies in the fact that it offers the possibility of monitoring the interaction between the price and the MA of a higher time frame on a lower one (e.g., the MA l

The Level S Moving Averages indicator ( see the description and video ) does not draw the Moving Average line in the chart window but marks multiple levels (such as close, highs and lows of any bar on the time frames from M1 to D1, W1, MN - strong levels) of the Moving Average on all time frames in accordance with the specified parameters. The level move frequency corresponds to the TimeFrame parameter value specified. The advantage of this indicator lies in the fact that it offers the possibili

Description Impulse Pro is an indicator's impulse trading system based on Moving Average and MACD Line . The idea of the impulse system based on Moving Average and MACD Histogram was first offered by Dr. Alexander Elder in his book "Come Into My Trading Room". The system allows users to choose the calculation method (Moving Average and MACD Line) based on a single, double or triple moving average. You can color bullish and bearish moods.
Inputs Calc_Method - Moving Average and MACD Line calcul

Fibonacci Ratio is useful to measure the target of a wave's move within an Elliott Wave structure. Different waves in an Elliott Wave structure relates to one another with Fibonacci Ratio. For example, in impulse wave: • Wave 2 is typically 50%, 61.8%, 76.4%, or 85.4% of wave 1. Fibonacci Waves could be used by traders to determine areas where they will wish to take profits in the next leg of an Up or Down trend.

The Display ADX System indicator for the MetaTrader 4 trading platform ( see description (in Russian) ) is compactly sized for a chart window, while displaying ADX indicator results for all time frames in a single window. Parameters for each time frame are set separately. Font size, corner and color can be set according to your preferences. By default, colors of time frame names are as follows: no trend - white, bullish trend - green, bearish trend - red. If the ADX is rising on the last three b

The Display Stochastic System indicator for the MetaTrader 4 trading platform ( see description (in Russian) ) is compactly sized for a chart window, while displaying Stochastic indicator results for all time frames in a single window. Parameters for each time frame are set separately. Font size, corner and color can be set according to your preferences. By default, a buy signal is green and a sell signal is red. The overbought market is dark red (prepare to sell -> wait for the red color). The

The Four Moving Averages Message indicator ( please see the description and video ), a version of Four Moving Averages , concurrently displays four Moving Averages with default settings in the main chart window: Green and Red ones represent a short-term trend, Red and Blue ones - mid-term trend, while Blue and Yellow ones - long-term trend. You can change the moving average settings and colors. However, these parameters have been configured so that to allow trading on all time frames. The built-
Sai perché MetaTrader Market è il posto migliore per vendere strategie di trading e indicatori tecnici? Non c'è bisogno di pubblicità o di protezione del software, nessun problema di pagamento. Tutto ciò è fornito da MetaTrader Market.
Ti stai perdendo delle opportunità di trading:
- App di trading gratuite
- Oltre 8.000 segnali per il copy trading
- Notizie economiche per esplorare i mercati finanziari
Registrazione
Accedi
Se non hai un account, registrati
Consenti l'uso dei cookie per accedere al sito MQL5.com.
Abilita le impostazioni necessarie nel browser, altrimenti non sarà possibile accedere.