Guarda i video tutorial del Market su YouTube
Come acquistare un Robot di Trading o un indicatore
Esegui il tuo EA
hosting virtuale
hosting virtuale
Prova un indicatore/robot di trading prima di acquistarlo
Vuoi guadagnare nel Market?
Come presentare un prodotto per venderlo con successo
Expert Advisors e indicatori a pagamento per MetaTrader 4 - 24

This indicator is designed for monitoring RSI levels on the current and higher timeframes. The control panel is user friendly and consists of buttons, with which you can control the display of lines as per the names of the buttons. The button color matches the line color.
Parameters "___| Settings of the main indicator " RSI Period - averaging period for index calculation (default is 14); RSI Price type - price used for calculations (default is the Close price); "___| Color palette " Text color

User Grid MT4 is a multifunctional grid Expert Advisor designed to fully or partially automate various ideas related to grid trading. The Expert Advisor can trade on any timeframe, on any currency pair, on several currency pairs, on any number of signs. It does not interfere with manual trading, trading of other Expert Advisors, or the operation of any indicators. It allows you to adjust your settings on the fly, works only with your own positions and orders. It has a clear information syste
This is an individual tool for analyzing the market situation. It is very simple to use. After attaching the indicator to the chart, you will see three vertical lines named "VLine 1", "VLine 2" and "VLine 3", following in this order from left to right. For the utility to operate correctly, this sequence should always be observed. Please note: at the first start, the lines are not bound to specific price levels on the chart. This should be done by user in accordance with the following rule: if li

SF TREND SIGNAL - уникальный индикатор использующий несколько входных данных для определения тенденции, и сигнала для входа в сделку, в ее направлении. Подходит для любой валютной пары, любого таймфрейма, и не меняет свои показания. Индикатор очень прост в настройке, что является хорошим преимуществом для исследований.
Параметры индикатора Основные настройки ( Main Settings ): SlowPeriod - период для расчета тенденции. FastPeriod - период для расчета сигнала. SlowSmooth - сглаживание значени

Contact us for any custom order, CodeYourTrade.com . Martingale EA is a multicurrency Expert Advisor using martingale or grid technique to trade the market. Trading strategy: Manual Entry + Automated Trade Management Manual Entry : User can input the starting trade type in the EA based on their analysis. The EA has no intelligence of its own to decide the entry trade type. Intelligence can be added in the EA upon request. Automated Trade Management : It manages the trade using martingale or gr
Profits are on the way! This indicator is SO SIMPLE… when the red Drop Coming arrow appears, a price drop may be on the way! When more than one "Drop Coming" signal appears on a bull run, that means the drop is getting closer. HOW TO USE 1. When the red "Drop Coming" arrow appears, a price drop may be on the way! To get the best setting it's a matter of tweaking the indicator until it gives you the best results. Our recommendation, and what our traders do is open their chart and move the input n

You’ll love how you can receive alerts to your email and SMS when the candles turn green or red signifying the best buy and sell times in correlation to confirmed uptrends and downtrends. TO USE 1. Buy when green candles appear - this represents an uptrend. 2. Sell when red candles appear - this represents a downtrend. EXTRA FEATURE This indicator NEVER repaints so when a candle closes, that color is final. Also, the blue trend lines in the photos are not included, this is to demonstrate the pri

This script automatically calculates and updates ICT's daily IPDA look back time intervals and their respective discount / equilibrium / premium, so you don't have to :) IPDA stands for Interbank Price Delivery Algorithm. Said algorithm appears to be referencing the past 20, 40, and 60 days intervals as points of reference to define ranges and related PD arrays. Intraday traders can find most value in the 20 Day Look Back box, by observing imbalances and points of interest. Longer term traders c

Description Shows whether market is trending or not, to what extent, which direction, and if the trend is increasing. The indicator is very useful for trend following strategies. The indicator can also alert when the market transitions from being flat to trending, which can serve as a great entry point. The alert is controllable directly from the chart, with an on-chart tick box to enable the alert. Also includes bonus indicators of current spread and ask/bid prices in large text, color coded as

The indicator displays trend strength, including showing the transition from buy to sell and visa versa. It is ideal for trend following strategies and also highlights possible reversals/flattening trend with a yellow X on the indicator window. By default, the indicator does not repaint/flicker, however, there is an option to calculate on the live candle but even then the indicator will not repaint unduly. The indicator can also be used for exit.
Usage Enter long/buy trade when the indicator tr
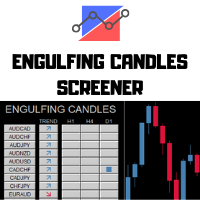
---> Check all the other products <---
The Engulfing Candles Screener is a deeply customizable dashboard.
You can chose a trend filter, using 2 EMAs, with custom periods applied on a custom TimeFrames Then you can choose 3 timeframes to search, any TimeFrame is suitable and the screener will find the engulfing candles in the selected timeframe. 3 Timeframes to scan All the major forex pairs and crosses - up to 28 symbols Deeply Customizable
How to setup the screener:
Let the crosses visib
DMI MultiTimeFrame Candle Timer: Track Candle Countdown Across Multiple Timeframes with Clarity The DMI MultiTimeFrame Candle Timer is an advanced indicator designed to provide traders with real-time countdown timers for the remaining time before candle closes on multiple timeframes. This tool allows you to monitor multiple timeframes simultaneously, providing a clear and customizable visual of the candle countdown, helping you make precise and timely trading decisions. Key Parameters: Display O
- We all want to have the lowest spread and never high, with this utility we can have more information and a clearer idea of when the spread is acceptable or not. The Panel InfoSpread is a utility expert advisor and shows information on different spread options in one or more symbols, can be actual spread, average, minimum, maximum and tick counter. Read and show the symbols that are in the Market Watch window. Also you can put a maximum limit of average spread in every symbol for know when
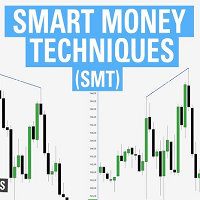
ICT SMT divergence represent a situation in the market where two correlated assets, being seen within the same timeframe, exhibit opposing structure. This can be seen in two positively correlated assets, as one asset forming a higher low, while the other forming a lower low instead of higher low. Version 1.03: Add Higher Timeframe support An ICT SMT divergence serves as the primary signal of reversal for correlated assets. If two positively correlated assets are moving higher and at a point one

No idea why demo is not working. you can check the GIF to see how it works.
Features With this scanner you can detect Candles which are below/above yesterday high/low lines. A pair's rectangle turns RED in dashboard if it is above the yesterday high, and rectangle turns GREEN in dashboard if it is below the yesterday low. It gives alerts in every 15m candle close. Contains a Dashboard which will help you to see all market pair's. It is possible to disable this sorting through to make it easier
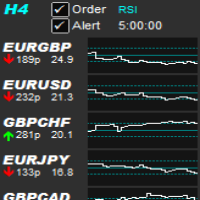
Allows symbols/currency pairs to be ordered based on a configured indicator, with the best performing symbols shown at the top. This helps you to select the symbol with better prospects from a given list of symbols. Can optionally alert when a symbol moves into the top two (configurable). Also shown is the number of pips that the symbol has moved in its current direction, allowing you to tell if you've 'missed the boat'. Further, a graph is shown, per symbol, of the indicator value over time all

Good News ! Advanced Currency Meter is more awesome now ! If you have been a fan of the free version of Advanced Currency Meter then I will implore you not to be discourage because you will soon find that the new paid version is worth every dime. Unlike the free version the new paid version of Advanced Currency Meter now has a newly added panel called the “% Daily Range” . Why A Paid Version Now? We believe you like good things and many who has used Advanced Currency Meter over the years will te

Roller Coaster
Perfect for trading Stocks, Futures, Commodities and Currencies The Roller Coaster is a Stochastic MACD Cross with Special EMA Points of Control for both Long and Short Trades.
Our algorithm works everything out behind the scenes, keeping your chart clean. Read more about the inner workings here ==> https://www.mql5.com/en/blogs/post/734074
With the lease of our indicator, you will have access to:
Entry Price Stop Loss Price Trade Management using Stochastic/MACD Cross Traili

Bullish Scalper EA - Your Go-To Expert Advisor for Bullish Day Trading scalping in MetaTrader 4!
Automate your trading on any forex trading crypto trading indices scalping or even swing trading or stocks trading in every strategy from fast scalping trading to swing trading
the ea will not limit the digit number of trailing loss and spread so basiclly you could use it so secure profit of long hold
Special price of 45$ will be back to 299$ soon!! Please leave a 5 star***** rating if you like

Visualizza sul grafico fino a 7 sessioni di mercato e 3 intervalli settimanali, completamente personalizzabili Ogni sessione e intervallo possono essere mostrati o nascosti ed essere adattati per adattarsi a periodi intraday o intraweek speciali in base alle esigenze di ciascun trader Definisci gli orari di inizio/fine delle sessioni utilizzando uno di questi: Ora GMT/UTC (adattabile a qualsiasi fuso orario) Tempo del server/broker (tempo del grafico) Ora locale (l'ora del tuo computer)
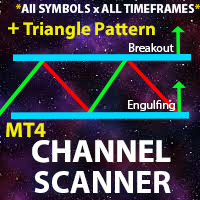
** All Symbols x All Timeframes scan just by pressing scanner button ** *** Contact me to send you instruction and add you in "Channel Scanner group" for sharing or seeing experiences with other users. Introduction: The Channel pattern is described as the area located between two trend lines. This area is used for a measure of a trading range. In this case, the upper trend line connects price highs while the lower trend line connects price lows. Also when it comes to breakout points, it helps t

This is diamond! Contact me to send you instruction and add you in group.
Diamond Pattern is based on Read The Market(RTM) concepts. The purpose of this model is to face the big players of the market (financial institutions and banks), As you know in financial markets, big traders try to fool small traders, but RTM prevent traders from getting trapped. This style is formed in terms of price candles and presented according to market supply and demand areas and no price oscillator is used in it.

The Magic Arrow Scalper sorts out low-probability signals in a trading strategy. The indicator uses a sophisticated filtration algorithm based on the market sentiment and trend. The indicator displays arrows on a chart (see attached screenshots) indicating a likely price reversal. Magic Arrow Scalper is not repainted. Once the candle is closed, a signal is confirmed and will never disappear from a chart. You can setup alerts when new arrows are displayed on a chart. The indicator is not des

CCI Currency Strength Meter uses CCI (Commodity Channel Index) to monitor how strong a currency is, or in other words, if it's being bought or sold by the majority compared to the other currencies. If you load this indicator on a chart, it will first display the strength-lines of the currencies (base and counter currency of the chart) with changeable solid lines. Also, you can add up to five additional currencies to the "comparison pool," that already has the base and the profit (counter) curren

AUTO3M Pro MT4 – Trend & Hedging Expert Advisor
Fully compliant with MQL5 Market regulations
Strategy Overview
AUTO3M Pro MT4 is an automated Expert Advisor combining trend-following, hedging, and news filtering strategies.
It utilizes the following indicators:
Trend Analysis: Moving Average, OBV, Standard Deviation (STD), ATR Entry Signals: Stochastic Oscillator (for Buy Stop/Sell Stop orders) Risk Management: Fibonacci-based TP/SL, Bollinger Bands for dynamic stops News Filter: Avoids high

Pips Hunter M1 – Скальперский Советник Валютная пара: EUR/USD, EURJPY, GBPUSD Таймфрейм: M1 Время работы: 24/7 Требования к брокеру: Минимальный спред – для максимальной эффективности Быстрое исполнение ордеров – без задержек и реквот Низкая комиссия – для снижения издержек Наличие VPS – стабильная работа без перебоев Разработан для активного скальпинга и максимального профита!

How it Works When the EA is active, it analyzes the chart based on the Execution Mode parameter. No existing positions on the chart: If the trend is bullish, the EA enters a buy trade. If bearish, it enters a sell trade. Existing positions with the last one in loss: The EA checks if the distance between the current market price and the order meets the minimum distance set by the user. It enters a trade based on the candle, calculates the lot size using the martingale method. EA Parameters Execut

I will support only my client. สำหรับลูกค้า Win Sniper Follow is a fully automated Expert Advisor with no use of martingale. Night scalping strategy. The RSI indicator and an ATR-based filter are used for entries. Real operation monitoring as well as my other products can be found here : https://www.mql5.com/en/users/winwifi/ General Recommendations The minimum deposit is 100 USD, the recommended timeframe is M15, H1, H4. Use a broker with good execution and with a spread of 2-5 points. A ver

EA Quantum La – Trading advisor based on the RSI and Bollinger Bands indicators, using pending orders and virtual orders, supported by a neural network. ️ Join our Telegram channel and get a powerful package of gifts that will make your trading even more successful: ️Our Telegram channel ️ t.me/EAQuantumLab
3 unique indicators - accurate market analysis in your hands.
Trading panel - convenient management of all trades.
Expert Advisor - your reliable assistant in

** All Symbols x All Timeframes scan just by pressing scanner button ** *** Contact me to send you instruction and add you in "All Divergences scanner group" for sharing or seeing experiences with other users. Introduction Divergence is a main technique used to determine trend reversing when it’s time to sell or buy because prices are likely to drop or pick in the charts. All Divergence indicator can help you locate the top and bottom of the market. This indicator finds Regular divergences for
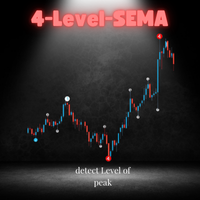
Well known to most, this indicator identifies the chart peaks and assigns the level of the peak. By classifying the peaks into levels, not only is a possible consolidation indicated but also the possible strength up to the highest level that indicates that a trend reversal is likely.
While most SEMA indicators work with 3 levels, this indicator has 4 levels.
This indicator is part of the OH-Strategy. You can view other indicators of this strategy if you click on my name as a seller.
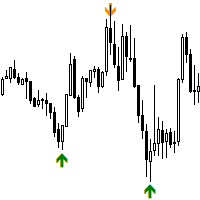
Swing Points Indicator for MetaTrader 4
The **Swing Points Indicator** is a custom-built technical tool designed for MetaTrader 5 (MT5), primarily used for identifying crucial reversal points in price action. By plotting swing highs and swing lows, it highlights potential trend reversals, making it a valuable tool for traders relying on price action analysis. This indicator helps traders anticipate changes in market direction by visually marking significant turning points on the chart.
Main F
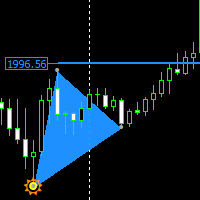
Non-repaint price action pattern based indicator works on all timeframe the indicator is based on a 123 Triangle pattern that happens everyday on the market the indicator will point out the pattern for you and you can turn on Fib level to see your take profit. Blue triangle is a buy signal Red triangle is a sell signal horizonal blue and red lines is an indication to place your trail stop loss one price has reached that area only entry when the triangle has fully formed

Nas100 killer V2 (See video of how we test the indicator live) 1000% non-repaint indicator appears on current candlestick. Timeframes: M5, M15, M30, H1, H4. Works on pairs such as (NAS100, US30, SPX500, and Gold) The indicator is strictly for scalping do not hold trades for too long. Orange arrows look for selling opportunities. Light Blue arrows look for buying opportunities.

The latest Binary Options arrow indicator in the Garuda Signals product line. Binary options signal based on multiple time frame cross over analysis. Gets confirmation from the most consistent signals known to man; Ichimoku, SMA, Bollinger Bands; and also uses the 1 Hour time frame as trend confirmation , so you don't have to open up multiple chart and waste time. - Can be used for all time frames up to 1 hour, but is most POWERFUL for 1 and 5 min options. - Place your Call/PUT based on the Arro

One of the most powerful and important ICT concepts is the Power of 3. It explains the IPDA (Interbank Price Delivery Algorithm) phases. PO3 simply means there are 3 things that the market maker's algorithm do with price:
Accumulation, Manipulation and Distribution
ICT tells us how its important to identify the weekly candle expansion and then try to enter above or below the daily open, in the direction of the weekly expansion.
This handy indicator here helps you keep track of the weekly and
This indicator shows data from 9 currency pairs by your choice from all 9 timeframes. If a digital value of the RSI is less or equal to DnLevel = 30 (or whatever number you decided to put), then a Green square will appear. This is (potentially) an Oversold condition and maybe a good time to go Long . If a digital value of the RSI is greater or equal to UpLevel = 70 (or whatever number you decided to put), then a Red square will appear. This is (potentially) an Overbought condition and maybe a go
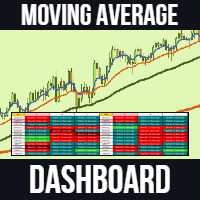
Moving Average Dashboard Pro is an improved and advanced indicator of the free version "Moving Average Crossover Bars ago Dashboard" The moving average dashboard pro gives you a dashboard view of bullish and bearish moving average crossovers. For example, if there was a bullish moving average crossover 5 sessions ago, then you would see 5 bars ago . This indicates that there was a bullish crossover 5 sessions ago. This indicator is useful if you want to catch the trend early on when using moving

Elliott Wave Trend was designed for the scientific wave counting. This tool focuses to get rid of the vagueness of the classic Elliott Wave Counting using the guideline from the template and pattern approach. In doing so, firstly Elliott Wave Trend offers the template for your wave counting. Secondly, it offers Wave Structural Score to assist to identify accurate wave formation. It offers both impulse wave Structural Score and corrective wave Structure Score. Structural Score is the rating to sh

TrendWave Oscillator is an advanced MT4 oscillator that not only identifies the trend direction but also provides visual and audio alerts to enhance trading strategies.
Key Features: - Color-coded trend indication: - Blue : Indicates an uptrend, signaling potential price growth. - Orange : Indicates a downtrend, suggesting possible price decline. - Gray : Represents a flat market or lack of clear entry signals.
- Graphical signals on the chart : - Aqua : Highlights an uptrend, emphasi

Snake Eyes Super Scalper the trading revolution
Snake Eyes Super Scalper is a scalper EA, trading strong market movements. The Expert Advisor does not use hedging, martingale, grid, arbitrage, etc. strategies. The basis of the EA strategy lies on the contrarian breakouts of key levels based to MA, FIBO and Volatility It is important to note that the High Frequency Forex Robot does not trade every day, and it may go a week or more without opening any trades. However, when it does trade, it do
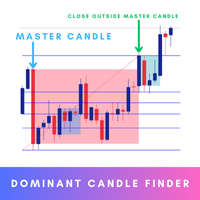
Dominant Candle Finder is a significant candlestick on a price chart that stands out due to its size, volume, or price movement compared to surrounding candles. It often indicates strong buying or selling pressure and can be used to identify potential reversal points, breakouts, or continuations in the market. Dominant candles can serve as key indicators for traders to make informed decisions, providing insights into market sentiment and potential future price movements. MT5 Version - https:

Alpha Trend is a trend indicator for the MetaTrader 4 platform; it has been developed by a group of professional traders. The Alpha Trend indicator finds the most probable tendency reversal points, which allows making trades at the very beginning of a trend. This indicator features notifications, which are generated whenever a new signal appears (alert, email, push-notification). This allows you to open a position in a timely manner. Alpha Trend does not redraw, which makes it possible to evalua

The program is use to copy trading from MT4 to MT4 and MT5 on local PC or copy over the Internet. Now you can easy copy trades to any where or share to friends. Only run one Flash Server on VPS, also need allow the apps if you turn on Windows Firewall. Can not add more than 20 account copier to server, include both MT4 and MT5 Get free Copier EA for MT4 and MT5 (only receive signal), download here Instants copy, speed smaller 0.1 seconds, easy to setup How to setup and guide Let read a
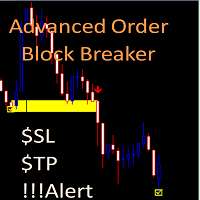
Advanced Order Block Breaker The price has been reduced from 65$ discount to 35$!!!
Dashboard: Free scanner to monitor All pairs and timeframes here: https://www.mql5.com/en/market/product/59151 MT5 version Indicator: https://www.mql5.com/en/market/product/62769 Market structure changes as price reverses And filter with all import features built inside one tool. Breaker's smart algorithm detects the reverses, filters out market noise and gives entry signals with exit levels. Test the
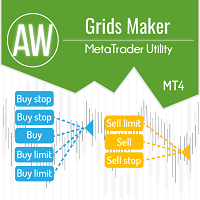
AW Grids Maker is used to build grids from pending orders. The utility is universal, has flexible settings and an intuitive panel interface. The program builds networks from STOP and LIMIT orders with the necessary step, uses the position volume multiplier.
MT5 version -> HERE / Problem solving -> HERE
Benefits: Uses pending orders of all types. Simple and flexible setup. Well-designed and multi-functional utility panel. Thoughtful information module Features of work:
Suitable for pyram

** All Symbols x All Time frames scan just by pressing scanner button ** *** Contact me to send you instruction and add you in "Order Block group" for sharing or seeing experiences with other users. Introduction: The central banks and financial institutions mainly drive the market, Order block is considered a market behavior that indicates accumulation of orders from banks and institutions, then the market tends to make a sharp move(Imbalance) on either side once the order block is completed. O

Hamster Original
(Very Fast, Easy Setup, More Power!) You can check live Hamster Original trading on Telegram_Channel The Hamster Original is a Trading Robot with no use of Classic martingale. Schedule scalping Options. it uses some Indicators as a filter to maximize Correct entries.
Recommendations : Lot = 0.01. ( if autolot enabled Allow (initial Lot) per (xx)USD = 50 ). Balance = 100 USD. Pair = EURUSD. TimeFrame = 5Min. Broker = Trusted Brokers
Inputs descriptions : Initial Lot
Feel free to contact me for any extra features :) [SEE MT5 VERSION https://www.mql5.com/en/market/product/128846 ] Local Reverse Copier The Local Reverse Copier is an Expert Advisor designed to synchronize positions between a Master account and a Slave account with a twist: it reverses the trades. When a buy position is opened on the Master account, the EA opens a sell position on the Slave account, and vice versa. This allows for a unique form of trade copying where positions are mirrored in o

Exclusive Arrival: Presenting for the First Time . This is your secret weapon for predicting which way the wind will blow with the next market shift. It assists you in developing your trading strategy by predicting the direction of the next candle. Compatible with forex, stocks, and cryptocurrencies on all timeframes, but higher timeframes are recommended. MT5 Version - https://www.mql5.com/en/market/product/108937/ How does it work ? It's pretty neat. The algorithm separates green and red can

What Is Market Imbalance? Market Imbalance, also known as "IPA" or Improper Price Action, is when price moves so quick in one direction with no orders on the other side of the market to mitigate the price movement. We all know Big Banks, or "Smart Money", can move the market by placing huge orders which in turn can move price significantly. They can do this because Big Banks are the top 10 Forex traders in the world . But unfortunately, the Big Banks cannot leave these orders in drawdown and mus

The balance of supply and demand is a simple and effective market analysis method. The supply and demand diagram can show you in advance, even before the trend reversal, where the supply ends and the demand is already emerging, where the demand ends and the supply is emerging, while substantially increasing the probability of making a deal in the right direction and with a high profit factor.
Indicator Signals The indicator uses the price/volume values to generate signals: ED – excess demand. E

Breakout based strategy, generates market entry signals when the price crosses a border of a certain price range. To create the strategy, we have used the history data with 99,9% quality for the last 15 years. The best signals had been selected and the false signals have been filtered out. The Expert Advisor performs technical analysis and considers only the breakouts that show the best result.
It uses a system of filtering false signals. The EA uses adaptive trailing stop. The EA uses a very

This indicator displays the wave structure of the market in the form several wave levels nested in each other. For each of these levels an automatic preliminary (draft) marking of waves in Elliott's style (123..., ABC... etc.) is created. This markup is completely automatic and absolutely univocal. The indicator is especially useful for beginner wave analysts, because among all the possible versions for wave marking, it allows you to immediately take the most adequate version as a ba
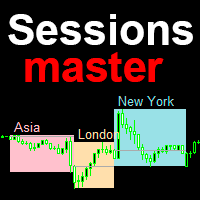
Session master - индикатор торговых сессий с расширенными возможностями. По умолчанию отображает Азиатскую, Лондонскую и Нью Йоркскую сессии, с возможностью самостоятельно настроить каждую сессию индикатора под свою торговлю. Описание Отображает прямоугольной областью заданный период в часах дня Максимум и минимум сессии соответствуют максимам и минимумам прямоугольных областей сессий Индивидуальная настройка для каждой сессии, имя, цвет, период в часах Автоматически переводит время сессий зада

The indicator determines a special pattern of Joe Dinapoli. It gives very high probability buy and sell signals. Indicator does not repaint. Indicator Usage Buy Signal ''B'' Entry : Market buy order at signal bar close Stop : Low of signal bar Take Profit : First swing high Sell Signal ''S'' Entry : Market sell order at signal bar close Stop : High of signal bar Take Profit : First swing low Indicator Parameters Fast EMA : External Parameter (should be kept as default) Slow EMA: External Parame

i-Orders is a simple indicator to monitor your own trade/analyze others' trades. I use it for a long time and do not imagine a chart without these arrows, lines and trade result numbers. The features allow you to: change the size and location of the control buttons ( Control buttons size , Control buttons corner ), disable display of opened and closed positions ( Show OPENED , Show CLOSED , Show PENDING ), change colors of arrows and lines for profitable and loss-making buy and sell positions se

The Volume indicator is an excellent tool for measuring tick volume or real volume activity. It quickly and easily helps traders evaluate the volume's current size. The indicator for classification of the volume size uses the moving average and its multiples. Accordingly, the area where the volume is located (relative to the moving average) is labeled as ultra-low, low, average, high, very high, or ultra-high. This indicator can calculate the moving average by four methods: SMA - Simple Mov

This multi time frame and multi symbol indicator identifies high-probability breakout patterns. It does this by identifying strong, symmetrical pennants and triangles. This pattern DOES NOT appear very often on higher time frames. But when it does, it is a very high-probability setup. The indicator also includes an Inside bars scanner. It can for example be used to detect a special type of Inside bars formation which is formed by a Master candle (MC) followed by 4 inside candles (please see the
Yesterday High/Low Breakout Only 5 download of the EA left at $44! Next price --> $55 Symbol GBPUSD Timeframe M15 Test From 2017 Settings Default Setting
Additional - -------------- ---------------------------------------------------- Brokers Any Minimum Deposit $500 Recommend Deposit $1000 for cent Feature NOT sensitive to spread, slippage Suggest Use low spread broker

Dragon Fire Ultimate Version is a tren following system for swing trading or scalping .trend based on candlesticks and look for corrections or continuations on the trend. you can use period candle or 7 or whatever you want . this time it is the ultimate version modified by our team which has many features that can be adjusted according to your needs in trading with robots. You can also do this backtest Only 5download of the EA left at $79! Next price --> $99 Symbol XAUUSD, EURUSD, GBPUSD A
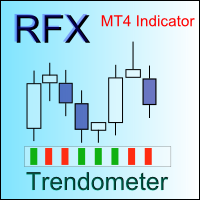
Identifying the trend of the market is an essential task of traders. Trendometer implements an advanced algorithm to visualize the trend of the market. The major focus of this indicator is to evaluate the market in the lower time frames (i.e., M1, M5 and M15) for the scalping purposes. If you are a scalper looking for a reliable indicator to improve your trade quality, Trendometer is for you. The indicator runs on a separate window showing a histogram of red and green bars. A two consecutive gre
Relative Strength Index (RSI) is one of the most popular and accurate oscillators widely used by traders to capture overbought and oversold areas of price action. Although the RSI indicator works fine for a period of market, it fails to generate profitable signals when market condition changes, and hence produces wrong signals which results in big losses. Have you ever thought about an adaptive RSI indicator that adapts its period of calculation based on the market conditions? The presented indi
Stochastic Oscillator is one of the most popular and accurate oscillators widely used by traders to capture overbought and oversold areas of price action. Although the Stochastic indicator works fine for an interval of the market, it fails to generate profitable signals when the market conditions change, and hence it produces wrong signals resulting in big losses. Have you ever thought about an adaptive Stochastic indicator that adapts its period of calculation based on the market conditions? Th
This indicator allows you to trade binary options and specially programmed to get the momentum to follow the trend that is happening in the live market. This indicator is based on trend strength, price correction and advanced technical analysis,this is 100% NO REPAINT. This indicators specifically for manual trading, I suggest using a platform that uses an expiration time Timeframe : M1 or M5 Expired Time : 1 Candle Pair : Any ( even better in the CAD market ) Time Session : Europe and NewY

Gold Pro MT4 is a trend indicator designed specifically for gold and can also be used on any symbol. The indicator does not redraw and does not lag.
Free Dashboard : monitor All pairs and timeframes here: https://www.mql5.com/en/market/product/60431 SETTINGS Factor 1: use to calculate different methods of drawing indicator line Factor 2: use to calculate different methods of drawing indicator line AlertByPopup - true/false popup alerts. AlertBySound - true/false

The Expert Advisor is designed for aggressive trading. The Expert Advisor has new methods for determining the direction of the trend. The EA trades with a minimum profit on a no-loss system, controlling every trade.
️ Join our Telegram channel and get a powerful package of gifts that will make your trading even more successful: ️Our Telegram channel ️ t.me/EAQuantumLab
3 unique indicators - accurate market analysis in your hands.
Trading panel - convenient management of

This Scanner Dashboard uses the Extreme TMA System Arrows Indicator to show good BUY/SELL signals. This Product contains dashboard only. It does not contain the Abiroid_Arrow_Extreme_TMA.ex4 indicator. Arrows indicator is not necessary for dashboard to work. To see arrows, you can buy the arrows indicator separately if you like: https://www.mql5.com/en/market/product/44822
Dash shows Slopes for current and Higher Timeframes. - 1st diamond is current TF. Next diamonds are higher TFs
(Please Not

This is a Multi-currency multi-timeframe Support/Resistance Scanner Dashboard for Metatrader 4 (MT4) platform.
Get all extras and download free demo here: https://www.mql5.com/en/blogs/post/760210
Read detailed description in post above. And get the SR Indicator for individual charts.
Features: Scan Support/Resistance zones (also called Supply/Demand zones) Show alert when price is inside these zones and highlights the pair/timeframe Show or hide SR zones price nearest to current price (Price
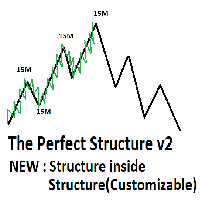
/* V2 of the Perfect structure.*/ Whats Inherited from v1?
# This is the finest structure marking you will ever find in any market. # indicator is coded considering the actual structure any trader would use. # indicator is coded based on actual candle breaks and not coded based on any pivot or predefined values or specific number of candles high and low. # please check out the screenshot.
# if you want me to fine tune it according to your needs then i am open for it. Whats new in V2? 1. AI bas
Il MetaTrader Market è l'unico negozio online dove è possibile scaricare la versione demo gratuita di un robot di trading che consente di effettuare test e ottimizzazioni utilizzando dati statistici.
Leggi la descrizione dell'applicazione e le recensioni di altri clienti, scaricala direttamente sul tuo terminale e prova un robot di trading prima di acquistarlo. Solo sul MetaTrader Market è possibile testare un'applicazione in modo assolutamente gratuito.
Ti stai perdendo delle opportunità di trading:
- App di trading gratuite
- Oltre 8.000 segnali per il copy trading
- Notizie economiche per esplorare i mercati finanziari
Registrazione
Accedi
Se non hai un account, registrati
Consenti l'uso dei cookie per accedere al sito MQL5.com.
Abilita le impostazioni necessarie nel browser, altrimenti non sarà possibile accedere.