Guarda i video tutorial del Market su YouTube
Come acquistare un Robot di Trading o un indicatore
Esegui il tuo EA
hosting virtuale
hosting virtuale
Prova un indicatore/robot di trading prima di acquistarlo
Vuoi guadagnare nel Market?
Come presentare un prodotto per venderlo con successo
Expert Advisors e indicatori a pagamento per MetaTrader 4 - 11
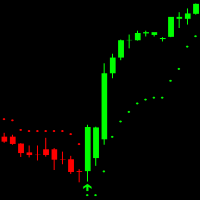
Easy Trend Indicator can be used for all forex pairs, indices and cryptocurrencies. It´s a non rapainting Trend trading indicator and works on all timeframes. GREEN candles show an uptrend and RED candles show a Downtrend. Arrows show when to enter the Market. Indicator has 7 Inputs: Max History Bars = On how many Bars in the Chart the indicator is drawn ATR Period = How many Bars are used for Average True Range calculation ATR Multiplier = Is used for Indicator sensitivity (Higher multiplier =

This indicator is designed to detect the best of all candlestick reversal patterns: Three Line Strike . According to the bestselling author and candlestick guru Thomas Bullkowski, this pattern has a winning percentage between 65% and 84% . This indicator scans for you up to 30 instruments (forex, indices or commodities) on up to 8 timeframes. You can get alerts via MetaTrader 4 and email if a Three Line Strike pattern occurs. Please note: Higher timeframes bring the most reliable signals. This i

Forex Gump is a fully finished semi-automatic trading system. In the form of arrows, signals are displayed on the screen for opening and closing deals. All you need is to follow the instructions of the indicator. When the indicator shows a blue arrow, you need to open a buy order. When the indicator shows a red arrow, you need to open a sell order. Close orders when the indicator draws a yellow cross. In order to get the most effective result, we recommend using the timeframes H1, H4, D1. There

Signal Bands is a sensitive and convenient indicator, which performs deep statistical processing of information. It allows to see on one chart (1) the price trend, (2) the clear price channel and (3) latent signs of trend change. The indicator can be used on charts of any periods, but it is especially useful for scalping due to its high sensitivity to the current market state.
The functions of the indicator : First, the Signal Bands indicator draws channels into which all price fluctuations ex

WaveTrend Momentum Oscillator is an upgrade to the popular and easy-to-use WaveTrend Oscillator. The WaveTrend Momentum Oscillator adds a momentum component to the original WaveTrend calculation, in order to provide faster and more accurate entry points during trendy market conditions. Do you prefer the original WaveTrend Oscillator? The WaveTrend Momentum Oscillator allows you to switch between momentum and original WT versions. Both provide valuable information depending on the market conditio
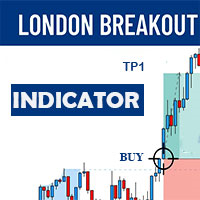
The London Breakout indicator is a technical analysis tool used in the forex market to help traders identify potential breakouts during the opening of the London trading session. This indicator is designed to help traders take advantage of the volatility and momentum that occurs during this time period, which can lead to significant price movements.
The London Breakout indicator works by identifying the range of price movement during the Asian trading session that precedes the London open, an

In statistics, Regression Channel is a approach for modelling the relationship between a scalar response (or dependent variable) and one or more explanatory variables (or independent variables).We Applied relative strength index(rsi) values to develop regression models of various degrees in order to understand relationship between Rsi and price movement. Our goal is range prediction and error reduction of Price divergence , thus we use Rsi Regression
It may be true that “Time waits for no one [human],” but at least now you can control the marching time of all your robots. EA Schedule Launcher (ESL) can launch and close any number of your EAs and/or indicators at custom beginning and ending times. You save your EA and/or indicator to a template and input when to open and close them. The power to control your EAs trading time window can improve both strategy performance and terminal/computer performance.
Note: EA cannot be run with the visu

This unique multi-currency strategy simultaneously determines the end of the trend, entry points and the expected take profit levels for each trade. The indicator can determine entry points on any trading period from M1 to D1. For the convenience of users, the indicator renders the entry point (in the form of an arrow), recommended take profit levels (Fast Take Profit, Middle Take Profit, Main Take Profit, Global Take Profit) and the Stop Loss level. The detailed guide on how to use the indicato

A ready-made trading system based on automatic construction and maintenance of Fibonacci levels for selling and buying for use on any instrument (symbol) and on any period of the chart. Features Detection of trend direction (14 indicators) Construction of horizontal levels, support and resistance lines, channels Selection of a variant for calculating Fibonacci levels (six different methods) Alert system (on screen, E-Mail, Push notifications) Buttons Color scheme switching button. Arrow buttons.
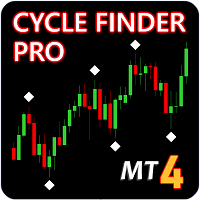
Update - Version 4.0 now includes trend change signal. Indicator will tell you the current trend on all charts. Cycle Finder Pro is a chart reading indicator and is designed for trend and pattern traders . Chart reading is time consuming and complex and requires knowledge of price action , cyclicity, and time frame correlation . Cycle Finder Pro reads all this in one simple indicator so you can spot trend and chart patterns much easier and much faster. To know if a trend exists on a chart you

The EasyTrend is a seemingly simple but quite powerful trend indicator. Everyone has probably come across indicators or Expert Advisors that contain numerous input parameters that are difficult to understand. Here you will not see dozens of input parameters, the purpose of which is only clear to the developer. Instead, an artificial neural network handles the configuration of the parameters.
Input Parameters The indicator is as simple as possible, so there are only 2 input parameters: Alert -

Advanced Currency Strength Indicator
The Advanced Divergence Currency Strength Indicator. Not only it breaks down all 28 forex currency pairs and calculates the strength of individual currencies across all timeframes , but, You'll be analyzing the WHOLE forex market in 1 window (In just 1 minute) . This indicator is very powerful because it reveals the true movements of the market. It is highly recommended to analyze charts knowing the performance of individual currencies or

VR Sync Charts is a tool for synchronizing layout between windows. INDICATOR DOES NOT WORK IN STRATEGY TESTER!!! How to get a trial version with a test period, instructions, training, read the blog https://www.mql5.com/ru/blogs/post/726504 . VR Sync Charts allow you to synchronize trend levels, horizontal levels and Fibonacci layout with all charts. With this you can synchronize all standard graphic objects in the MetaTrader terminal. All your trends, Gann lines and other objects are exactly cop

Get all benefits of a grid strategy and none of its disadvantage | Built by a grid trader >> for grid traders.
This is MT4 version, click here for Blue Sonic Donchian MT5 (settings and logics are same in both versions) Real monitoring signal --> Sonic Gold | Sonic Fx Intro BlueSonic Donchian EA ('Sonic') is a next-gen multi-currency multi-timeframe EA base on Donchian indicator. Other than normal one-off entry, users would have option to activate grid series to max

This indicator presents an alternative approach to identify Market Structure. The logic used is derived from learning material created by DaveTeaches (on X)
When quantifying Market Structure, it is common to use fractal highs and lows to identify "significant" swing pivots. When price closes through these pivots, we may identify a Market Structure Shift (MSS) for reversals or a Break of Structure (BOS) for continuations. The main difference with this "protected" logic is in how we determine
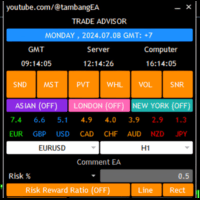
Trade Advisor: decisioni a colpo d'occhio
L'assistente Expert Advisor (EA) definitivo per i trader professionisti
VERSIONE Versione MT4 | Versione MT5 | Blog
Trade Advisor è un Expert Advisor (EA) sofisticato ma facile da usare, progettato per migliorare la tua strategia di trading. Integrando potenti indicatori di trading e funzionalità avanzate di gestione del denaro, Trade Advisor garantisce precisione ed efficienza in ogni operazione.
Caratteristiche principali:
1. Zone

Questo indicatore si basa sull'esperienza pratica.
Inserite la data/ora del vostro top/bottom.
Calcola il livello più visitato dal top/bottom fino al momento attuale.
Si aggiorna automaticamente a ogni nuova candela. È possibile utilizzare contemporaneamente più indicatori per diversi trend e timeframe.
La lunghezza è sempre tracciata dall'inizio del periodo fino al presente.
Utile strumento PRO.

Waddah Explosion Scanner Features : - Waddah Trend, Explosion Increase/Decrease
- Trend Percentage with Threshold
- DeadZone
- Trend Direction Aligned Checks
- Highlight and Alerts
- Multi-Timeframe & Multi-Currency
Check out the blog post for more info: https://www.mql5.com/en/blogs/post/758020
Customizable Threshold: With customizable threshold, you can identify best trading opportunities in volume-based trading. Use Trend Height (x times Explosion) : Trend height in relat

BeST_Darvas Boxes EA is an MT4 Expert Advisor that is based on the most classic trading method developed in the 50's by Nicolas Darvas commonly known as The Darvas Boxes Trading System. The Original Darvas Boxes System can be found in details in his book "How I Made $2,000,000 In The Stock Market" (Copyright 1960, by Nicolas Darvas).
Although the original system was designed to trade only Stocks and to open only Long trades its trading principles can also be applied to many other Markets
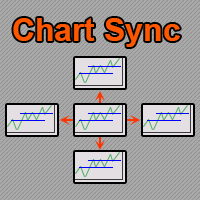
Indicatore di sincronizzazione del grafico: progettato per sincronizzare gli oggetti grafici nelle finestre del terminale. Per funzionare, installa l'indicatore sul grafico da cui desideri copiare gli oggetti. Gli oggetti grafici creati su questo grafico verranno automaticamente copiati su tutti i grafici con lo stesso simbolo. L'indicatore copierà anche eventuali modifiche negli oggetti grafici. Parametri di input: exception - prefisso del nome di un oggetto grafico che non necessita di essere
Ultimate Fibonacci EA & Trade Manager With Advanced Pattern Recognition Discover the power of precision trading with the Ultimate Fibonacci EA, an innovative Expert Advisor (EA) for the Forex market. This advanced tool is designed to work in harmony with your Fibonacci retracement strategy, providing dynamic responses to market movements and pattern recognition. Core Features: Fibonacci Retracement Tool Compatibility: Seamlessly integrates with your chart's Fibonacci tool, adapting to drawings,

Ultimate Breakout Scanner (Multi Pair And Multi Time Frame) : ---LIMITED TIME OFFER: NEXT 25 CLIENTS ONLY ---46% OFF REGULAR PRICE AND 2 FREE BONUSES ---SEE BELOW FOR FULL DETAILS Breakout trading is one of the most popular trading approaches used in the institutional trading world.
As it takes advantage of the never ending phenomena of price expansion and contraction (through volatility) .
And this is how institutional traders are able to take advantage of explosive moves in the market .

Ultimate Moving Average Scanner (Multi Pair And Multi Time Frame) : ---LIMITED TIME OFFER: NEXT 25 CLIENTS ONLY ---46% OFF REGULAR PRICE AND 2 FREE BONUSES ---SEE BELOW FOR FULL DETAILS Institutional traders use moving averages more than any other indicator. As moving averages offer a quick
and clear indication of the different phases of a trend. Such as expansion, pullback, consolidation and reversal.
And viewing the market through the same lens as the institutions is a critical part

Ultimate Double Top Scanner (Multi Pair And Multi Time Frame) : ---LIMITED TIME OFFER: NEXT 25 CLIENTS ONLY ---46% OFF REGULAR PRICE AND 2 FREE BONUSES ---SEE BELOW FOR FULL DETAILS Any major price level that holds multiple times, is obviously a level that is being defended by
the large institutions. And a strong double top pattern is a clear indication of institutional interest.
Double top patterns are widely used by institutional traders around the world. As they allow you to manage

Features This is an indicator that recognizes a special type of Inside Bar formation which is formed by a Master candle followed by 4 smaller candles (please see the strategy explanation below). Plots buy/sell stop lines on the chart as well as well as take profit and stop loss levels. The TP/SL levels are based on the Average True Range (ATR) indicator. Object colors are changeable. Sends you a real-time alert when a Master candle formation is identified - sound / pop-up / email / push notifica
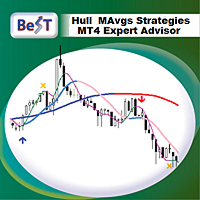
BeST_Hull MAvgs Strategies_EA is an MT4 Expert Advisor based on the Market indicator named BeST_Hull MAs Directional Strategy and can make trades according to it or using only 1 HMA while it also applies all common Trade and Risk Management features.
Generally the Hull Moving Average (HMA - developed by Alan Hull) is a directional trend indicator. It captures the current state of the market and uses recent price action to determine if conditions are bullish or bearish relative to historical d
Lo Smart Volume Tracker è un indicatore progettato per fornire informazioni dettagliate sul sentiment del mercato presentando visivamente i dati sui volumi di domanda e offerta in una finestra dedicata. Questo strumento intuitivo aiuta i trader a identificare rapidamente dove si concentra l'attività di acquisto e vendita, consentendo loro di prendere decisioni di trading più informate.
Con Smart Volume Tracker, puoi facilmente valutare se il mercato tende verso un trend rialzista o ribassista

I recommend you to read the product's blog (manual) from start to end so that it is clear from the beginning what the indicator offers. This multi oscillator, multi time frame and multi symbol indicator identifies when a divergence occurs between price and an oscillator/indicator. It identifies both regular/classical (trend reversal) and hidden (trend continuation) divergences. It has moving average, RSI/Bollinger, ADX, pin bar and engulfing filter options which makes it possible to filter

Suggested timeframes to trading :M1-M5 - M15-M30 -H1 wait london and newyork markert open after wait best then select the best strong index and weakest index by sniper. histogram is indicated by one arrow at a time. The signal in the end direction of weak and strong all red and green mean trending index,natural market is displayed only in white SL Sniper Indicator can be used for short term long and scalping. It is better to confirm entry signals with high low price action. currency is gaining
User Manual For more information pm me SL Currency28 Pair Dashboard is even used by the Banks to make profits. They take a strong currency and pitch against a weak currency This strategy i am made my other indicator SL Currency Strength Meter 28 Pair more improvement We can easily study the financial strength of multi-faceted trading SL Currency28 Pair Dashboard strength meter which creates multiple charts in a single window based on the price action of each currency in relation to

Forex Market is very dynamic. Whatever strategy you used to trade the market will always face its ups and downs. What I learn from my experience, we have to embrace drawdown as part of our trading life and try our best to manage it, growing the account while waiting the drawdown decreasing over time. So the key is : - Ideal capital to cover the drawdown until a certain max percentage of the balance. - Built in algorithm to grow profit while in drawdown and in profit position such as how to benef

News Robot 4.0 Durante il rilascio di notizie economiche, il prezzo può superare decine di punti solo nel primo minuto dopo il rilascio. Il trading manuale durante l'alta volatilità è molto rischioso, poiché è difficile rispondere rapidamente alle quotazioni in rapida evoluzione e agli indicatori dei comunicati stampa attuali.
Per fare trading sulle notizie, è necessario preparare uno scenario in anticipo, prescrivere il massimo rischio.
Usa un robot professionale specializzato per fare tra

Ants Lite ATR allows you to enter and manage your trades based on the market volatility, giving you safer entries and better exits. Based on the work by Daryl Guppy.
Features Ability to define the bar the Long and Short calculation starts from. Can be used to generate both entry or exit signals. Customizable ATR period and multiplier. GMMA is a tried and tested indicator with a long pedigree. Volatility based entry and exit signal rather than time based.
How To Use Simply drag the indicator
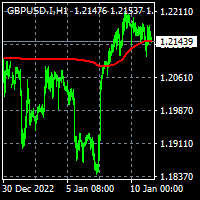
To get access to MT5 version please click here . - This is the exact conversion from TradingView: "Trend Regularity Adaptive Moving Average","TRAMA" By " LuxAlgo ". - This is a light-load processing and non-repaint indicator. - Buffer is available for the main line on chart. - You can message in private chat for further changes you need. Thanks for downloading

Super Trend Filter Indicator Super trend Arrow Consider as a Master Candle , If super trend in Buy signal , then signal candle calculate as master candle and master candle close above the open candle then calculate filter Buy Arrow. If super trend in Sell signal , then signal candle calculate master candle and master candle close below the open candle calculate filter Sell Arrow. 3 Target with Trailing Stop Loss

To get access to MT5 version please click here . This is the exact conversion from TradingView: "[SHK] Schaff Trend Cycle (STC)" by "shayankm". This is a light-load processing indicator. This is a non-repaint indicator. Buffers are available for processing in EAs. All input fields are available. You can message in private chat for further changes you need. Thanks for downloading
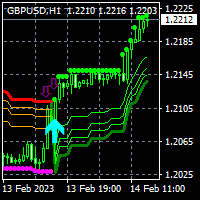
To get access to MT5 version please click here . This is the exact conversion from TradingView: "SwingArm ATR Trend Indicator" by " vsnfnd ". Also known as : "Blackflag FTS" by "Jose Azcarate" This is a light-load processing and non-repaint indicator. All input options are available except multi time frame Buffers are available for processing in EAs. Extra option to show buy and sell signal alerts. You can message in private chat for further changes you need.

OB Breakout is alert indicator that identifies when a trend or price move is approaching exhaustion(Supply and Demand) and ready to reverse. It alerts you to changes in market movement which typically occur when a reversal or major pullbacks are about to or have happened. The indicator identifies breakouts and price momentum initially, every time a new high or low is formed near a possible Supply or Demand level point. The indicator draws in a rectangle on Supply or Demand Zones. Once price we
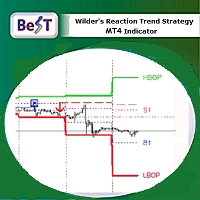
Best _Wilder’s Trend Reaction Strateg y is a Metatrader indicator that is based on the J.W.Wilder’s corresponding work as we can find it at his own legendary book:
“ NEW CONCEPTS IN TECHNICAL TRADING SYSTEMS ”(1978) and on pages 71-86/SECTION VII.
This strategy is both an anti-trend system (named as REACTION_MODE ) and a trend system (named as TREND_MODE ). The REACTION_MODE reverses at each Buy point and most Sell points while the TREND_MODE usually exits the market at a Trailing Stop.
T

The logic behind Trend Exploit EA is very simple but effective , the EA uses breakouts of the Bollinger Bands for entry and exit signals, enter in the market in the direction of a strong trend, after a reasonable correction is detected. The exit logic is also based on the Bollinger Bands indicator and it will close the trade even on a loss when the price breaks Bollinger Bands line.
Trend Exploit was strictly developed, tested and optimized using the "Reversed Sampling" development methodolog

Alan Hull's moving average, more sensitive to the current price activity than the normal MA. Reacts to the trend changes faster, displays the price movement more clearly. When the indicator color changes, it sends a push notification to the mobile device, a message to the email and displays a pop-up alert.
Parameters Period - smoothing period, recommended values are from 9 to 64. The greater the period, the smoother the indicator. Method - smoothing method, may range from 0 to 3. Label - text

Forex Indicator "Trend Entry Histogram" for MT4 Trend Entry Histogram indicator can be used for search of entry signals into the trend direction once Entry bar appears This indicator has unique feature - it takes both: price and volume for calculations Trend Entry Histogram can be in 2 colors: red for bearish trend and blue for bullish one . Once you see steady trend (minimum 10 consecutive histogram bars of the same color) - wait for entry bar Entry signal is 1 column with oppos

Developed methods for trading collected in one indicator. In the form of arrows, it defines entries in the direction of the trend.
It has 2 types of arrows - trend and signal guides, informing about the potential movement in the direction of the trend.
Works without redrawing, ready for use on all symbols/tools.
The most suitable time frames to use are M15, M30, H1, H4.
How to use
The indicator finds the direction of the trend in the form of a signal arrow, a graphic rectangle stretches

Description Shows whether market is trending or not, to what extent, which direction, and if the trend is increasing. The indicator is very useful for trend following strategies. The indicator can also alert when the market transitions from being flat to trending, which can serve as a great entry point. The alert is controllable directly from the chart, with an on-chart tick box to enable the alert. Also includes bonus indicators of current spread and ask/bid prices in large text, color coded as

Attention!!! Do not try to test the EA in the MT4 Tester, it is simply impossible, because the EA opens positions on 27 different instruments and 8 timeframe . The tester is able to test only one pair. Multi-currency tester is possible only in MT5. Instructions for launching a multi-currency tester in MT5: https://youtu.be/WrQQwMQclrY How EA works: 1. The main strategy for the breakdown of local extremes is used. 2. An additional algorithm is used to control losing trades and redistribute

Forex Indicator "MACD with Trend ZigZag" for MT4 MACD indicator itself is one of the most popular tool for trend trading "MACD with Trend ZigZag" is excellent for using with Price Action entries or in combination with other indicators Use this indicator to select most accurate entry signals: - If MACD is above 0 (green color) and ZigZag line is upward - search only for Buy Price Action patterns - If MACD is below 0 (pink color) and ZigZag line is downward - search only for Sell Price Action

This highly informative indicator applies overbought/oversold levels for more accurate representation of the market situation. All moving average settings are available, including average type and price it is based on. It is also possible to change the appearance of the indicator - line or histogram. Additional parameters enable more fine-tuning, while trading can be inside the channel and along a trend.
Distinctive features Oversold/overbought levels; Does not redraw. Additional parameters fo
GO Breakout and Retest is probably the best price action indicator you can currently find on the market. Designed for price action traders and not only, the indicator helps you spot retests after breakouts of supply / demand zones.
After purchase, leave a review, a comment or make a screenshot of your purchase and contact me to receive for free the Trade Entry Manager utility !
Please read the full description of the product in order to use the indicator properly !
Feel free to check out

questo codice è stato originariamente pubblicato da LuxAlgo in un altro linguaggio di programmazione.
Ha un'accettabile capacità di previsione del trend che può essere utilizzata per molti scopi di trading. ecco una descrizione del generatore di codice:
Questo indicatore si basa sugli smoothers Nadaraya-Watson pubblicati in precedenza. Abbiamo creato un indicatore di inviluppo basato sul Kernel Smoothing con avvisi integrati dagli incroci tra le estremità del prezzo e dell'inviluppo. A dif

Trend Sniper Super Indicator is one of the best indicator which can provide you will perfect signals for short term and long term trades. This indicator is suitable for both scalping and swing trading strategies. The indicator is over 85% accurate. It uses terminal Message Alerts, Emails and Push notifications to your mobile device to inform you about the new trading opportunities and it will calculate the take profit and stop loss level for you. All you will need to do is to place a trade. Subs

Trend Power Indicator is an indicator which helps to identify trend direction and its power by using moving averages ZigZag pattern and correlations of tradable instruments. It provides trend power data with user-friendly interface which can be read easily and fast. This indicator by default is configured for trading of Adam Khoo's ( Piranhaprofit ) strategies. It saves mass of time for searching of tradable pairs by his strategies. It indicates when all required moving averages are alignment
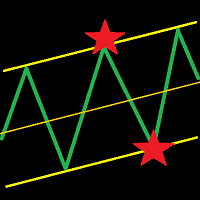
This indicator draws a trend line and a trend tunnel on the chart. You can choose several calculation methods, alerts, notifications, and other settings. It can also draw trendlines from another TimeFrame. You can also use this indicator for your ExpertAdvisor. The current values of the lines are stored in the memory buffer from where the EA can load them. You can trade the price bounce from the upper and lower lines . Settings TimeFrame – trend timeframe Description – show description of line
Top and Bottom Scalper
BINARY AND FOREX
The signals indicate strong reversal points (Tops/bottoms)- The indicator gives accurate signals on any currency pairs and instruments. It also has a setting for adjusting the frequency of the signals. It is further strengthened and made robust by the support and resistance zones. There are different qualities of zones as per robustness.
Inputs ZONE SETTINGS; BackLimit - default is 10 000. Check the past bars for formations. First Time Fram

This is a price action trading robot, the EA will stick to the medium term trend and price to deliver trades. Orders are always protected by the user set stop loss points. With the capital management system, it will help that EA operates in accordance with its purpose. Telegram : https://t.me/trungtqIT Timeframe is H1. Minimum account balance: $100. Attention is Important: EA only test live on demo or real accounts. Backtest results are just random and inaccurate.
Features: Every trade is prot
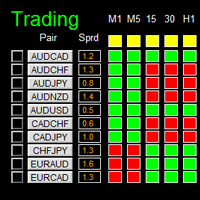
如果产品有任何问题或者您需要在此产品上添加功能,请联系我 Contact/message me if you encounter any issue using the product or need extra feature to add on the base version.
Dashboard Super Candle is an intuitive, and handy graphic tool to help you to: Have 28 pairs under control with one dashboard. Monitor candle direction, identify possible price movement and trend. Provide trading signals based on the candle direction selected by you. Automatically manage order once signal are generated. Have the ability to select which
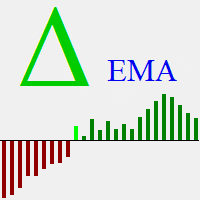
Delta EMA is a momentum indicator based on the changes of closing price from one bar to the next. It displays a histogram of the exponential moving average of those changes, showing magnitude and direction of trend. Positive delta values are displayed as green bars, and negative delta values are displayed as red bars. The transition from negative to positive delta, or from positive to negative delta, indicates trend reversal. Transition bars that exceed a user specified value are displayed in br

There are only a limited number of copies left, priced at 390 USD . After that, the price will be raised to 500 USD. All backtests were done with a modelling quality of 99.90%. The EA can trade on 7 currency pairs. To trade, you will need an ECN, RAW, STP or NDD account, which charges commissions and fees but gives a small spread. To trade you need the correct name of the currency pair without prefix and suffix and extra dot, otherwise you need to change the name of the currency pair in the

This Dashboard displays signals in grid view for the 28 major fx currency pairs. It is Mainly used for forex scalping in between 10 to 20 pips maximum and can be used on major trend market decisions. It Uses mainly Moving average and does not give false signal. All you need to note is the point in the grid where the signal occurs. A beep sound is heard whenever there is a new signal and it will be displayedat the top of the chart.

Algo Trading Indicaor
With this indicator , you’ll have zones and trends that hight probability the price will reverse from it. so will gives you all the help that you need
Why should you join us !? 1-This indicator is logical since it’s working in previous days movement , to predict the future movements.
2-Algo trading indicator will help you to draw trends which is special and are too strong than the basics trend , trends will change with the frame time that you work on .
3-We can

MACD (short for Moving Average Convergence/Divergence) is one of the most famous and oldest indicators ever created and is widely used among beginners . However, there is a newer version of the MACD that is named Impulse MACD which have less false signals than the standard MACD. Classic MACD helps us to identify potential trends by displaying crossovers between two lines. If MACD line crosses above the Signal line it shows us that the market is potentially up trending and that it would be a go

Average Daily Weekly Monthly Range Alerts.
The most complete multi-period dynamic range indicator with full alert options. Visually displays the Average Range lines on chart + real time distances to the Range Highs and Lows. Notifications are sent when the average ranges are hit. An essential tool for any serious trader! Average period ranges, especially the ADR (Average Daily Range) for day traders, are one of the most useful and consistently reliable indicators available to traders. Always a

Elliott Wave Trend was designed for the scientific wave counting. This tool focuses to get rid of the vagueness of the classic Elliott Wave Counting using the guideline from the template and pattern approach. In doing so, firstly Elliott Wave Trend offers the template for your wave counting. Secondly, it offers Wave Structural Score to assist to identify accurate wave formation. It offers both impulse wave Structural Score and corrective wave Structure Score. Structural Score is the rating to sh

BeST_123 Strategy is clearly based on the 123_Pattern which is a frequent Reversal Chart Pattern of a very high Success Ratio . It occurs at the end of trends and swings and it’s a serious indication of high probability for a change in trend. Theoretically an 123_pattern is valid when the price closes beyond the level of #2 local top/bottom, a moment when the indicator draws an Entry Arrow, raises an Alert and a corresponding Position can be opened. The BeST 123_Strategy Indicator is non-repai

OFFER! OFFER! NEXT Price Will be 650$ and the rental option will be removed after this. Don't miss the current price offer before it is too late. Dear Traders I am so glad to introduce my Super Powers Indicator. The purpose of this trading tool is to help serious traders who want to make trading one of their main source of income. I know trading is not an easy task but if you have the right tools, knowledge and motivation to trade then you are ready to go in this industry. My role is to help y

BeST_Chande TrendScore Indicator points the start of a trend with high degree of accuracy and it is amazing for scalping on the 1min timeframe. It is also a simple way to rate trend strength. It indicates both the direction and strength of a trend and can be easily combined with various trend-following, swing and scalping strategies. As of a trend’s direction and strength a value of +10 signals a strong uptrend while a value of -10 signals a strong downtrend. Generally a positive score show
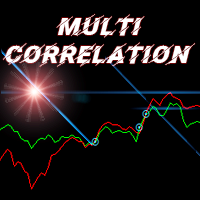
Indicator of correlation of two trading instruments.
Ideal for pair trading.
Example of use: if there is a significant divergence of correlated trading instruments, open two deals in the direction of each of them. Trades are closed when the correlation lines are crossed. Settings: First symbol (if empty - current) - The first trading instrument (if empty, the current one); Second tool (if empty - current) - Second trading instrument (if empty - current); Number of bars - Number of bars for

BeST_Gann Swing Oscillator is an MT4 indicator that is based on the corresponding work of Robert Krausz who introduced it in the book “ A.W.D Gann Treasure Discovered ” .
The Gann Swing Oscillator is a range-bounding technical indicator that oscillates between +1 and -1 and thus it describes the market swings.
Generally when the market is in an upswing, the Gann Swing Oscillator describes it as 2 higher highs with the value of +1 while after an upswing, the downswing is expected.
Also the do

Round Numbers And Psychological Levels (Multi Pair And Multi Time Frame) : ---LIMITED TIME OFFER: NEXT 25 CLIENTS ONLY ---46% OFF REGULAR PRICE AND 2 FREE BONUSES ---SEE BELOW FOR FULL DETAILS Studies show that more orders end in '0' than any other number. Also know as 'round numbers', or 'psychological levels',
these levels act as price barriers where large amounts of orders will generally accumulate. And the larger the number,
the larger the psychological significance. Meaning that even
It is a tool for technical analysis. It allows you to make measurements: Fibo, including the search for clusters Fibo levels (by the DiNapoli method) Overbalance Trend line Selecting S/D levels
Input parameters Trend_Color - color of the trend line Trend_Width - width of the trend line Trend_info - if true, along with the trend line additional information is displayed (low, high, medium of the trend line) Trend_info_color_up_dn - color of the text describing the trend line Trend_info_font_up_d
Il MetaTrader Market è un sito semplice e pratico dove gli sviluppatori possono vendere le loro applicazioni di trading.
Ti aiuteremo a pubblicare il tuo prodotto e ti spiegheremo come prepararne la descrizione per il Market. Tutte le applicazioni sul Market sono protette da crittografia e possono essere eseguite solo sul computer dell'acquirente. La copia illegale è impossibile.
Ti stai perdendo delle opportunità di trading:
- App di trading gratuite
- Oltre 8.000 segnali per il copy trading
- Notizie economiche per esplorare i mercati finanziari
Registrazione
Accedi
Se non hai un account, registrati
Consenti l'uso dei cookie per accedere al sito MQL5.com.
Abilita le impostazioni necessarie nel browser, altrimenti non sarà possibile accedere.