Guarda i video tutorial del Market su YouTube
Come acquistare un Robot di Trading o un indicatore
Esegui il tuo EA
hosting virtuale
hosting virtuale
Prova un indicatore/robot di trading prima di acquistarlo
Vuoi guadagnare nel Market?
Come presentare un prodotto per venderlo con successo
Expert Advisors e Indicatori per MetaTrader 4 - 83

Moving indicator. It is written so that it doesn't signal when two moving averages cross. Easy to operate. It performed well on European and Asian currencies. Designed for long-term and medium-term types of trading. Индикатор мувингов. Написан так что даёт сигнал при пересечении двух скользящих. Прост в управлении. Хорошо себя показал на европейских и азиатских валютах. Рассчитан на долгосрочный тип торговли.
FREE

Slow T3 MA Trend indicator derived from T3 moving averages. This indicator is part of the T3 Cloud MA indicator and is posted here on its own. Buying/Selling opportunities above/below line. The MA line can also be used as dynamic support/resistance for more aggressive entries. Use default values for best settings. The number of look back bars is user defined. This indicator can be used in combination with other strategies such as price action. Suitable for all time frames.
FREE

Demo is limited to the currency pair CADCHF. Full version: https://www.mql5.com/en/market/product/27237 Essentials for manual trading. The utility includes functions such as money management, automatic exits, hedging of positions, setting orders by date, OrderClose menu and others. Simple and clearly arranged, the tool works with one or more orders. Low tick rate compatible.
Features Display money management - right lot size is calculated from stoploss, account balance and risk appetite Sched
FREE

Harrow Band is an indicator based on support and resistance values. This indicator provides six bands that indicate the nearest of support or resistance position. With this indicator, it will be easier to see where entry and exit points of a trade are located.
Pairs and Timeframes This indicator can be used in any pairs and timeframes, but it is recommended to use it in XAUUSD H1.
Parameters NumCandle - number of candles used to calculate the support and resistance position. BandColor - colo
FREE

This indicator is a tool to measure the relative strength of different currency pairs. It used a user selected base currency as a comparing standard, and evaluate all other major currencies base on their relative strength/weakness. the stronger one currency compare to the base currency, the higher its value. Base currency has a fix strength value of 50.
Indicator parameters Strength Period - Change the strength period in the settings affects the number of bars used for calculation. The higher
FREE
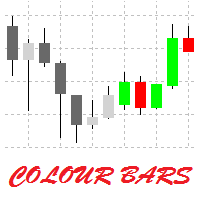
This is a simple utility for visual market analysis. Users can select trading day and time. Bullish candles located within the necessary time interval are shown in green, while bearish ones - in red. Candles outside of the trading time interval are shown in gray and dark gray.
Parameters Trade_Time = "00:00-00:00" - enter trading time. TradeSunday - trade on Sunday. TradeMonday - trade on Monday. TradeTuesday - trade on Tuesday. TradeWednesday - trade on Wednesday. TradeThursday - trade on
FREE
The indicator displays the signals of the RSX oscillator in a separate window. The indicator's signals are best used as signals for opening a deal when the price breaks the high or low of the bar on which the signal was given. The opposite signal cancels the previous signal. Settings: Data period for indicator calculation - data period for indicator calculation; Data period to display the indicator - data period to display the indicator; Price used to calculate the indicator - price used to cal
FREE

The indicator plots an affine chart for the current instrument by subtracting the trend component from the price. When launched, creates a trend line in the main window. Position this line in the desired direction. The indicator plots an affine chart according to the specified trend.
Input parameters Maximum number of pictured bars - the maximum number of displayed bars. Trend line name - name of the trend line. Trend line color - color of the trend line. Black candle color - color of a bullis
FREE
A popular signal indicator marking buy/sell points. Recommended for use in conjunction with a trend indicator to filter signals. The indicator has only one adjustable parameter that determines its sensitivity, which greatly simplifies setting the indicator to the current market and the user's trading style. The indicator can be used to trade any market. Its basic parameters perform well in most situations. At the same time, before starting trading, you should choose the most effective indicator
FREE

This Expert Advisor alerts users when the price crosses the chart lines. Horizontal and trend lines can be processed. Number of lines is not limited. Parameters prefix of signal line – prefix for the names of the objects (lines) processed by the indicator. If left empty, all horizontal and trend lines are processed. price Mode – bid or ask. timeout – crossing alert timeout. number of repeats – number of crossing alert repeats. number of comment lines – self-explanatory.
FREE

Welcome to our page This indicator is suitable for any time frame but our recommended time frames are 30M and above. Perfectly working with all pairs. Buy Call: When the candle has been crossed above the ichi cloud. (See the Screenshot Attachment) Sell Call: When the candle has been crossed below the ichi cloud. (See the Screenshot Attachment) Happy and profitable trade !!!
FREE
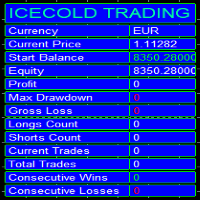
Icecold Trading OSD (On Screen Display) Is very Helpful and easy to use. Try Demo out today!
On Screen Display -Start Balance -Equity -Profit -Max Drawdown -Gross Loss -Longs count -Shorts count -Current Trades -Total Trades
*Know that in the Total Trades, Consecutive Wins & Consecutive Loss columns , those are ALL of the trades your account has done. It does not show 0 when loaded if you have completed trades already in Account History... Just note. To RESET just change Account history per
FREE

Free Version. This expert advisor is optimized for the USD/JPY forex value,It can be used for any forex currency by setting the values listed below. Its operation is based on a multi time frame moving average strategy, so it can be classified as a trend expert. When the trend has consolidated on one direction the algorithm buys or sells the currency pair. In the event of a trend inversion, there is a fixed stop loss, while the take profit is variable with the trailing stop function. For thi
FREE

This is a free demo version for USDJPY only. Here is the link to full version: https://www.mql5.com/en/market/product/25912 This product has no input parameters. The product helps you to open and close orders faster, include instant and pending orders. It helps you to open order faster and easier, to make an order you simply click on the button.
Buttons List BUY/SELL: to open instant Buy or Sell orders. BUY STOP/BUY LIMIT/SELL STOP/SELL LIMIT: to open pending order. The distance to the current
FREE

Version 4.0 100% free utility + 100% free signals. FREE SIGNALS VIA TELEGRAM https://t.me/joinchat/Jwa33g_jjsXwE4GrAAjihA Take the signal from the Mailbox and launch the adviser. Use the signal instruction and open a position. Use the lot as described below in the instructions. Close Take Profit. What's new. 4 levels for profit. 5/8/13/21 9 levels of Trail Stop. Manage your profit using a simple interface. DONATE PLEASE http://paypal.me/mql4Root // ---------------------------------------------
FREE
This is a technical indicator that put on strategy tester the buttons of the expert adviser "Control adora". Usually when applied the controladora to the strategy tester, the buttons do not appear and therefore its functions (like directly buy, sell, close orders or place stop loss indicator) can't be used. But now you can if have the Manual Backtest indicator. If you don't have Control adora, you can get it from here . This indicator get on the chart the buttons that can be of use in strategy t
FREE

This indicator helps you determine the evolution of the price depending on how these fly objects are shown in the chart. When the gliders opens their wings considerably warns us of a possible change in trend. On the contrary, when seems to get speed (looks thin because lines of wings are grouped) demonstrates safety and continuity in trend. Each wing of a glider is a directrix between the closing price and the high/low prices of the previous bar. The color (green/red) of each glider foresees bet
FREE

This utility clones the chart it is running on. It opens the same chart with the same graphical objects, set of indicators (saving the parameters) and the rest of the elements. In essence, it performs a deep copying of the original chart, transferring the template to the opened chart. The symbol and the timeframe of the original chart are also saved.
FREE

Tester BO and Tester Signal Bar is a script that allows you to test your trading strategies. The tester has two buffers with up / down signals. An example of use can be seen in the screenshots below. Using the indicator tester, you can achieve the maximum ratio of profitable trades for binary options. Improvement for forex is also planned. I wrote the idea at the very bottom in the “Planned work” group. You can filter your signals by the following data: 1- start date analyze. Interval (1 day, 7
FREE

This indicator smoothes the value of CCI (Commodity Channel Index) and reduces its volatility. By using this indicator, the fluctuations created by the CCI indicator are reduced. The smoothed CCI value is placed in a buffer that you can use in your EA and strategy. Leave me a comment if you want By using this indicator, you no longer need to use the Moving Average indicator on the CCI indicator.
FREE
Всем привет. И снова, я, Вадим Сергеевич Лепехо, трейдер(частный) опыт 20 лет около. Forex в основном. Предлагаю Вам оценить, протестировать, опробовать индикатор. И дать свою оценку, заключение, РЕЗЮМЕ....)))). Итак, как он работает. Очень прост в понимании. Алгоритм такой. Индикатор на графике(chart) рисует кружки снизу сверху, разных цветов. Ждем когда появится на фоне одних красных кружков 1, 2, ну на крайняк 3 кружка зеленого цвета и + обязательно должен появится следом опять кружок красног
FREE

I decided to list it for free. Combined Informer of DeMarker with RSI MTF. Each parameter can be change values in menu. it is good for scalping or for weekly trading and looks as universal fx-toy. Now I use it for BTC, ETH, BNB. In menu you can turn on daily percentage gain info, weekly and monthly gains also included as informers. Short ATR helps to determine when price was slow/stopped and entry for pulse pump/dump. The filter of numbers of RSI can be tuned for overbought/oversold values w
FREE

Long term stats is a trend indicator. As the name suggests, it computes long term running average, standard deviation and min/max values Average and standard deviation are plotted on the graph and deviation value is taken as input parameter (similarly to bollinger bands). Historical minimum and maximum are plotted on the graph and updated for each bar, considering historical time series slope. (this is to somehow account for inflation/deflation) Can be used as filter for signals, as trigger to
FREE

IMP
The Panel presents a number of indicators in abbreviated form: 2 oscillators, 2 trend and 1 volume indicator. Location - upper left corner.
Indicators values and colors can be customized by the user. Combined with other market analysis, can greatly improve trading results. This Indicator is a suitable tool for beginners and professional traders as one.
Metta Trader 4 Indicator Version _1.0
FREE

Add indicator "Symbol Name Drawer " on chart. Indicator creates text object with name of current symbol.
You can change symbols on chart and indicator automatically changes text.
Free to use. Simple tool.
If you have any suggestion you can write me about it in comments. I try to improve this tool in future versions. Thanks for using my indicator. If you want to order something special in mql4 or mql5 message.
FREE

***IMPORTANT: This free indicator works with the paid for Strong Weak Forex Expert Advisor. The EA also depends on the following custom indicators: Strong Weak Heiken Ashi Strong Weak Symbols Strong Weak Values Strong Weak Indicator Download them for free in the Market. The EA will not work without it. These are all custom indicators which the Strong Weak Forex Expert Advisor relies on to generate trading signals. If you have any problems with installation send me a message.
FREE

Funziona bene nel tester della strategia. Provatelo con la DEMO GRATUITA (build 1353).
How to run the FREE DEMO => https://www.mql5.com/en/blogs/post/749299
Msg2Discord invia testo libero e catture da una casella di testo a Discord.
Se si scrivono linee, segni o commenti sul grafico, l'immagine verrà inviata.
Uno strumento molto utile e semplice.
- Invio di messaggi liberi
1. Inserire il testo libero nella casella EDIT.
2. Premere il pulsante INVIA.
- Invio di un messaggio
FREE
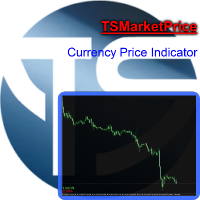
Indicator that displays the current price and the percentage of loss or gain, compared to the previous day.
The benefits you get : Possibility to choose your favorite crosses. Never redesigns, does not retreat, never recalculates. Works on forex and CFD, timeframe from M1 to monthly. Easy to use.
Parameters : FontSize = 20; font size FontType = "Tahoma"; character type Angle = Bottom_Right; angle view (top right .. top left sect ..) Show_Price = true; view the Bid Show_Var = true; see the d
FREE

This is a simple indicator that shows the spread in points. It is useful for those like trade scalper, in addition to be customizable. Functions: Color - I don't need to explain :) Font type - I don't need to explain :) Font size - I don't need to explain :) Aditional text - aditional text after the spread number. Corner - specify the corner where the spread will be written. X position - horizontal distance from the edge. Y position - vertical distance from the edge. Check out our others indicat
FREE
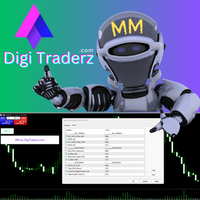
There is no doubt that money management plays a key role in the success of a forex trader. Many people, despite having a good strategy for trading in the forex market, fail to earn a steady income because they do not observe the stop loss and take profit levels in their trades.
The Digitraderz.com team, due to the request of some of their audience, has designed a trader assistant robot for managing the stop loss and take profit levels in forex trades. This money management robot is offered fo
FREE

Индикатор сглаженного Stochastic Oscillator (xStoh)
Входные параметры: xK Period - K период xD Period - D период xSlowing - замедление xMethod - метод усреднения (0-SMA | 1-EMA | 2-SMMA | 3 - LWMA) xPrice field - тип цены (0 - Low/High | 1 - Close/Close) Принцип работы
Индикатор перерассчитывает стандартный технический индикатор Stochastic Oscillator (дважды усредняет получаемые значения iStochastic).
FREE
This practical tool let you setup your keyboard to have shortcuts and hotkeys to change Chart TimeFrame.
Bring your trading to another level by actually take fast and smooth control of switching Time Frames without losing time clicking all over the Meta Trader Terminal. This tool is born due to scalping issues, where switching from higher timeframe and lower timeframes is really mandatory to make a multi timeframe analysis of the trading setup. Uplift your trading activity, by letting your k
FREE

Scientific Calculator is a script designed to compute expressions of science, engineering and mathematics.
General Description
The expression to calculate must obey syntax rules and precedence order, being constituted by the following elements: Integer and real numbers. Mathematical operators for addition (+), subtraction (-), multiplication (*), division (/) and exponentiation (^). Mathematical and trigonometric functions . Curved parentheses (()) to define the precedence and c
FREE
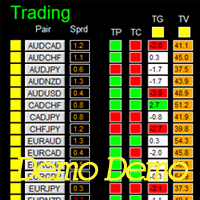
For full version of this panel Dashboard Trading Made Simple, please try it out to get familiar with all functionalities for free, LINK . It has full functionalities of the paid version, except Demo version only works on W1 time-frame, full version has option for all time-frame Stochastic is not available in demo version, it displays data but not works as filter. TDI momentum indicator is not available in demo version, it displays data but not works as filter. The Alert and send notification fun
FREE
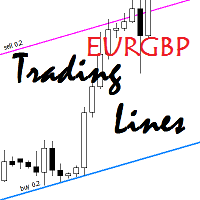
This utility is an Expert Advisor for semi-automatic trading within a price channel. It enters the market when the price crosses the channel boundary. Trend lines with a special type of description should mark the boundaries of the price channel. Trader is responsible for creating and aligning such trade lines on the required chart. The lines should be placed according to the same rules the "buy limit" and "sell limit" pending orders are placed. A trend line with a description of type "buy x" (w
FREE
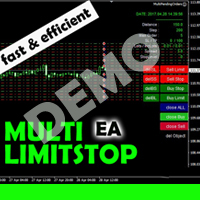
This EA (TRIAL VERSION) is designed for automatic placing of pending orders (sell limit, buy limit, sell stop, buy stop) including Stop Loss & Take Profit levels (editable) with only one button click. This EA can make order multi pending level / pending orders grid. So, with this EA placing pending orders will be faster, more accurate and more efficient.
Main Purposes Automation Pending orders grid style trading. Automation of the process of placing the Pending Orders: fast accurate efficient
FREE

My Trading History is a very useful tool for traders to know in which currency pairs, metals, indices, crypto currencies are good for trading , because this tool get all orders that made by you or EA's and organize them by symbols and tell you number of orders that you or EAs made per each symbol and show Portfolio for each symbol
You can customize the dashboard and the dashboard location on the chart as you like.
FREE

This is Demo Version of PipsFactoryMonthly This indicator depends on High and Low price of Currency in last Month and then i made some secret equations to draw 10 lines.
Features You will know what exactly price you should enter the market. You will know when to be out of market. You will know you what should you do in market: Buy Sell Take profit and there are 3 levels to take your profit Support Resistance Risk to buy Risk to Sell
Signal Types and Timeframe Used You can use this indicator
FREE

This is a demo version of CyberTrader Assistant tool. In demo version you cannot change lots value (it is set to the minimal value for the given symbol) and price rounding function for pending orders is unavailable This tool simplifies routine trading tasks (like opening market orders, setting up pending orders, closing of all orders and orders by parameter), helps to control losses by use of break even stop and trailing stop, and adds a little bit of cyber punk edge to your trading
Control El
FREE

This is a very simple script that will show you the following info about any symbol in your chart: Point, digits, spread, stop level, lot size, tick value, tick size, swap long, swap short, starting date (if future contract), expiration date (if future contract), trade allowed, minimum lot size, lot step, maximum lot size, swap type, profit calculation mode, margin calculation mode, initial margin, margin maintenance, margin when hedged, margin required, freeze level. All this info is extracted
FREE
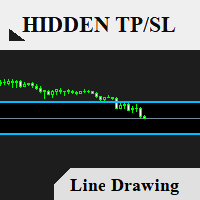
This's free demo version for testing on CADCHF currency. Full version can be found here : https://www.mql5.com/en/market/product/38022
Smart Tools for control stop-loss and take profit level. Drawing horizontal line to control stop-loss and take profit level. Can be setting stop-loss and take-profit level as low as possible! even 1 pip. Can be drag and drop lines on real-time. Useful for scalping trading method.
How to use ? Just place this EA to any currency that you want to take control o
FREE
This indicator displays in the form of an oscillator the difference between the maximum/minimum prices for the current period of time and the maximum/minimum price for a longer period. An increase in indicator values above zero indicates that the maximum price for the current period is greater than the maximum price for the period selected as an indicator parameter. This situation in most cases indicates an increase in the value of the asset. A drop in indicator values below zero indicates t
FREE

The MAtrio indicator displays three moving averages on any timeframe at once with a period of 50-day, 100-day, 200-day. After attaching to the chart, it immediately displays three moving averages with the parameters of simple (SMA) moving average SmoothingType50 , simple (SMA) moving average SmoothingType100 , simple (SMA) moving average SmoothingType200 . Accordingly, with the price type ValuePrices50, ValuePrices100, ValuePrices200 , by default, the price is Close price everywhere. All parame
FREE
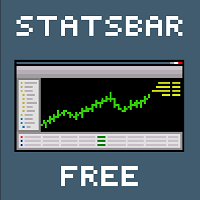
StatBar 1.6 Indicator showing balance, earnings for today, yesterday and the day before yesterday. The indicator also shows: - Server; - GMT; - Server time; - Shoulder; - Spread.
Description of variables: extern int Magic = "-1"; // Magic for statistics -1 = all 0 = manual extern string Symboll = "-1"; // Symbol for statistics -1 = all 0 = current EURUSD = for EURUSD
FREE
Nombre del Indicador: Two Lines Color 1 Telegran:13 Crow Trading Club
Descripción: Este indicador personalizado para MetaTrader 4, "Two Lines Color 1", es una herramienta de análisis técnico diseñada para ayudarte a identificar oportunidades de trading en los mercados financieros. Este indicador utiliza dos Medias Móviles Simples (SMA) de diferentes períodos y las representa en el gráfico con dos líneas de colores distintos.
Las características clave de este indicador son las siguientes:
FREE

Информирование пользователя о величине текущего спрэда цветом, в зависимости от тренда. Простой и удобный информатор. Расположить можно в любом месте графика (настраивается во входных параметрах). При активном индикаторе наносим на график горизонтальную линию цветом, указанным во входных параметрах. Эта линия будет (по Вашему мнению) точкой разворота тренда. Если цена будет ниже линии - цвет величины спрэда будет окрашен в цвет "медвежьего" тренда, если цена буде выше линии - цвет величины спрэ
FREE

Simple Strategy Checklist Panel, as its name suggests, is a panel that works as a checklist, and can place up to twenty lines of text. This was created for traders who want to have their trading plan or to-do list at hand, a simple but useful product for many.
I will write this pointless paragraph since Metatrader asks me to put a minimum of 6300 characters, so I also explain that the list can also be used to make purchases from the supermarket! Example bread, milk, flour and much more... Enj
FREE

This script was created for the best and easiest manual trading execution with automatic money management and TP/SL prices. Magic number included. Use the Buy, Sell, Stop and Limit scripts for a complete manual trading execution system. Parameters are self-explanatory. Take Profit and Stop Loss are measured in points for 5-digit brokers and pips for 4-digit brokers.
FREE

History Exporter can help to export your orders history from MT4 account. After that you can use another data analysis tools to get what you want. File format is .csv file, the content such as below OrderID,Symbol,Type,Lots,OpenTime,OpenPrice,StopLoss,TakeProfit,CloseTime,ClosePrice,Commission,Swap,MagicNo,Comment,ProfitUSD,ProfitPips,NetProfit,Duration,(Days),(HH:MM:SS), 21520206,EURCHF,buy,0.05,2020.03.10 08:06:15,1.06304,0.00000,0.00000,2020.03.11 13:37:38,1.06015,-0.60,-0.05,28282888,RedRab
FREE

This indicator calculates average speed of moving average indicator. Here is parameters: BarsToProcess - indicator calculating period; MaPeriod - period of Moving Average indicator; AveragingPeriod - period (MA values) of the basis of which the average value is calculated; MA_Method, MA_Apply_to - using to set MA indicator parameters; Thats all! Good luck.
FREE
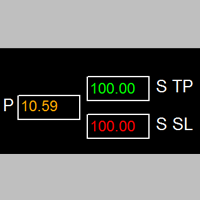
如果产品有任何问题或者您需要在此产品上添加功能,请联系我 Contact/message me if you encounter any issue using the product or need extra feature to add on the base version.
Session TakeProfit StopLoss is basically helping to set the take profit and stop loss in dollar for the total open orders (session). Once the total profit is greater than session_tp or less than session_sl, the EA will help to close all open orders acting similarly to a take profit/stop loss for a single order.
Inputs session_tp: session take profit s
FREE
Double Smoothed Stochastics – DSS Bressert is an oscillator introduced by William Blau and Walter Bressert. The calculation of DSS Bressert values is similar to the stochastic indicator. The confirmation of the indicator's signal is the overcoming by the price of the high/low of the bar on which the signal was given by the indicator.
Settings: Price - the price at which the indicator is calculated; EMA_Period - smoothing period; Stoch_Period - oscillator period;
OB_Level - overbought level;
FREE

Risk Management Panel is unique to tool calculate your risk quickly and place trades based on your account money. There are two options for the user Account Equity Account Balance Tools like these is specially useful when you have to take a quickly decision about your trade but dont have the time to calculate the risk. It works with magic number. So the advantage is a trade placed by this panel could be manipulated by the other expert advisors as well
FREE

The indicator allows you to trade binary options. The recommended time frame is М1 and the expiration time is 1 minutes. The indicator suitable for auto and manual trading. A possible signal is specified as a arrows above/under a candle. You should wait until the candle closes! Arrows are not re-painted Trade sessions: London and New York section Currency pairs: EUR/GRB Working time frame: M1 Expiration time: 1 minute The indicator also shows good results when using the martingale strategy - "
FREE

Tool converted from tradingview. A simple indicator that plots difference between 2 moving averages and depicts convergance/divergance in color coded format.
Anything <= 0 is red and shows a bearish trend whereas > 0 is green and shows bullish trend.
Adjust the input parameters as following for your preferred time frame :
4-Hr: Exponential, 15, 30
Daily: Exponential, 10, 20
Weekly: Exponential, 5, 10
FREE
StrxInfoPanel is an essential tool for every trader It gives you an immediate idea about your account and realtime informations about the current symbol and timeframe you are analyzing Every information line can be hidden and shown via parameters, even panel position can be changed via input parameters Parameters list: Corner : the screen corner where you want the panel to be shown Left, Top, and Width : customizable position and panel dimensions BgColor : background color Show XXX : every infor
FREE

Strategy creation : Create lines of stop loss, entry and take profit. Live parameters such as lot size, gap in pip from SL to TP, Risk/Reward ratio are update whenever lines of SL and Entry move. This function allows traders to clarify their strategy before making any orders. Risk management - The risk calculation function calculates the volume for a new order taking into account the set risk and the distance from the Stoptloss to Entry Line. In addition, maximum risk (%), RR value are
FREE
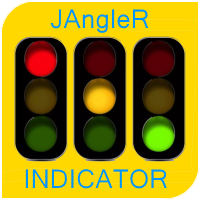
The oscillator indicator " JAngleR " is one of a series of three calculators of the angular deviation of the price chart of a trading instrument.
INPUT PARAMETER: DRAWs =128 - Number of bars to display the indicator in the chart history; Period_IND =14 - calculation period of the indicator in the number of bars; ma_period =1 - Moving Average Period; ma_method =MODE_SMA - moving Method; applied_price =PRICE_CLOSE - applied Moving Average Price. The values of the indicator indicators are degree
FREE

The indicator searches for matches in history for a specified range of the latest known oscillated Moving Average data.
Found matches are indicated on the graph as colored fields. Analysis of historical data (the behavior of quotes in history) will help make decisions in trading.
The matches found are updated when a new bar is opened (i.e., the calculation is performed upon opening prices).
The value of the increase accuracy (Accuracy) must be changed with a decrease in the timeframe, and
FREE
The product combines the best features of the standard WPR oscillator with the adaptive digital filter. The indicator allows entering and exiting the market at the very beginning and end of a trend. The indicator generates high-probability signals while retaining high sensitivity. The indicator does not repaint on fully formed bars. Options: Ind_Price - price used for the indicator calculation; Ind_Period - indicator period. Application rules: A big red dot - a strong bearish trend, if the price
FREE
This indicator displays DeMarker oscillator data for two different periods. The position of the histogram above zero indicates an increase in prices. The location of the histogram below zero indicates a fall in prices. On fully formed chart bars, the indicator is not redrawn. At the same time, the indicator values at 0 bar (the current bar, the bar that has not finished forming yet) may change. Thus, the indicator values at 0 bar should be ignored.
- Sale subject to all conditions:
Indica
FREE

Questo script è progettato per valutare i pesi in varie funzioni della finestra. Un indicatore basato su queste funzioni della finestra può essere scaricato all'indirizzo https://www.mql5.com/ru/market/product/72160 Parametri di input: iPeriod – periodo indicatore. iPeriodo >= 2 iCenter è l'indice del riferimento in cui si troverà il centro della funzione finestra. Per impostazione predefinita, questo parametro è 0: il centro della finestra coincide con il centro dell'indicatore. Con 1 <= iCent
FREE

Highly configurable Accumulation and Distribution (AD) indicator. Features: Alert functions. Multi timeframe ability (lower and higher TF also). Color customization. Linear interpolation and histogram mode options. Works on strategy tester in multi timeframe mode (at weekend without ticks also). Adjustable Levels. Parameters:
Ad Timeframe: You can set the lower/higher timeframes for Ad. Bar Shift for Lower Timeframe: Shift left or right the lower timeframe's candle. Stepless (Linear I
FREE

Lo script è molto utile per coloro che lavorano con un gran numero di ordini. Succede che ci sia un profitto sul conto e devi chiudere tutti gli ordini sul conto contemporaneamente. è a questo che serve lo script Full Closer.
Opzioni di script: Close Type -specificare il tipo di ordine che si desidera chiudere. Se vuoi chiudere solo gli ordini BUY. impostare il parametro su Only BUY orders e, se si desidera chiudere tutti gli ordini, lasciare il parametro in All type MagicNumber -se hai diver
FREE

Choosing the levels of StopLoss and TakeProfit can have a very strong impact on the overall performance of trading. In addition to the obvious parameters of a trade transaction - the size of a possible win or probable loss - the levels of StopLoss and TakeProfit also affect the expected duration of the transaction, and the profitability of trading in general. If you have already determined the optimal transaction duration using the “ AIS-ODT ” script, then you can begin to determine the paramete
FREE
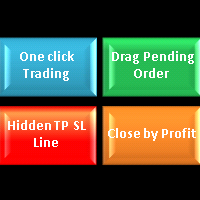
"All in one on Ultimate Panel" Helping in opening and manage orders with "one click trading" system. Note: This demo version is for testing on CADCHF pair only. The full version can be found here: https://www.mql5.com/en/market/product/11558
Features
1. Speed Trading / One Click Trading. Just set Lot Size, Stop Loss,Take Profit level. Then click the "BUY!" / "SELL!" button. Order will open immediately.
2. Drag line to place pending order. Just click "BUY LINE" or "SELL LINE" butto
FREE

Note: this product is a free limited version of the full featured product Currency Timeframe Strength Matrix . It only includes AUD, CAD, CHF currencies instead of all 8 currencies. It includes only 5S, 1M, 5M time frames instead of all 8 (5S, 1M, 5M, 15M, 30M, 1H, 4H, 1D).
What is it? The Currency TimeFrame Strength Matrix is a simple and comprehensive Forex map that gives a snapshot of what is happening in the Forex market at the very present time. It illustrates the strength and momentum
FREE

The indicator "Elvis A" is designed for a very strict determination of the reversal. With the author's settings, it is installed on the D1 chart. It will skip many signals and choose only the most reliable ones. Therefore, it is better to set it on several currency pairs.
The screenshot shows an example of this indicator in the form of an expert Advisor on a currency pair with a very large spread.
FREE
Machine translation of the following: This indicator is used to close or open the price and time scales.Select true to display scale and false to close scale.After the price scale is closed and then opened, it may show that it is not at all. But it can be solved by switching time cycle.This indicator has two tags, D and P, which can be opened or closed in real time by clicking.The related parameters can be modified by user, such as the name, position and coordinates of the label.
FREE

Индикатор показывает максимальное отклонение от скользящей средней за заданный период. Границы канала могут послужить своего рода зонами перекупленности/перепроданности, от которых может произойти откат цены к центру канала. За этими уровнями и стоит искать дополнительные сигналы для входа в сделку. В настройках индикатора всего 2 параметра - период, за который будет расчитываться индикатор и метод усреднения скользящей средней.
FREE
Il MetaTrader Market è l'unico negozio online dove è possibile scaricare la versione demo gratuita di un robot di trading che consente di effettuare test e ottimizzazioni utilizzando dati statistici.
Leggi la descrizione dell'applicazione e le recensioni di altri clienti, scaricala direttamente sul tuo terminale e prova un robot di trading prima di acquistarlo. Solo sul MetaTrader Market è possibile testare un'applicazione in modo assolutamente gratuito.
Ti stai perdendo delle opportunità di trading:
- App di trading gratuite
- Oltre 8.000 segnali per il copy trading
- Notizie economiche per esplorare i mercati finanziari
Registrazione
Accedi
Se non hai un account, registrati
Consenti l'uso dei cookie per accedere al sito MQL5.com.
Abilita le impostazioni necessarie nel browser, altrimenti non sarà possibile accedere.