Guarda i video tutorial del Market su YouTube
Come acquistare un Robot di Trading o un indicatore
Esegui il tuo EA
hosting virtuale
hosting virtuale
Prova un indicatore/robot di trading prima di acquistarlo
Vuoi guadagnare nel Market?
Come presentare un prodotto per venderlo con successo
Expert Advisors e Indicatori per MetaTrader 4 - 22

Certainly! An EA Exponential Moving Average (EMA) strategy is a trading or investment approach used in financial markets, particularly in the context of stocks, cryptocurrencies, and other assets. Here's an explanation in English: An Exponential Moving Average (EMA) strategy is a popular method employed by traders and investors to analyze price trends in financial markets. It's a technical analysis tool that helps identify potential buying or selling opportunities based on historical price data.

This is a volume profile that shows the volume with a fixed constant time frame that you set. The indicator also shows the maximum volume value (VPOC - VOLUME POINT OF CONTROL) and the average value, colors and settings you can adjust as you like, there are many possibilities. If you need an indicator that shows the variable volume range frames there is ...HERE... Volume Profile is an advanced charting study that displays trading activity over a specified time period at specified price leve

The Relative Momentum Index (RMI) was developed by Roger Altman, and introduced in his Feb 1993 article in Technical Analysis of Stocks & Commodities magazine. As its name suggests, Relative Momentum Index adds a momentum component to the traditional RSI, designed to increase reliability by decreasing spurious oscillations between defined overbought and oversold levels. This Relative Momentum Index indicator has 2 components. A change in RMI line color provides a warning signal for an upward or
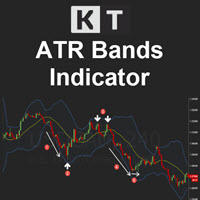
KT ATR Bands draws the volatility envelops and bands using a combination of Average True Range and Moving average. They are typically used to identify the potential reversal points and the periods of high and low volatility.
Features
Multi-Timeframe Ability: For example, you can have the atr bands from the daily timeframe on the H1 timeframe. Smart Alerts: You can turn on/off alerts for each band separately. Also, you can choose a minimum time interval between each alert to stop unnecessary,

Short Term Scalper EA is an Expert Advisor works in the short-term direction and always uses a tight stop loss invisible to the broker. Only one order per currency pair can be opened at a time. When the short-term trend changes, the EA changes the type of the pending order, deletes the old one and places a new order. The pending order follows the price in anticipation of when the market begins its short-term movement. This scalper does not work in a flat, therefore it should be used on highly v
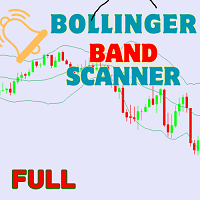
Welcome to the world of advanced trading with the Bollinger Bands Scanner! Maximize your trading potential with our powerful MT4 indicator designed for seamless analysis and real-time insights. Key Features: Effortless Bollinger Bands Scanning: Unlock the full potential of the Bollinger Bands Scanner by effortlessly scanning multiple assets. Receive instant alerts when specific Bollinger Bands conditions are met, ensuring you stay ahead of market movements. Comprehensive Dashboard Insights: Gai
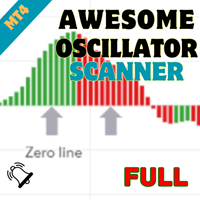
Welcome to the world of advanced trading with the Awesome Oscillator Scanner! Maximize your trading experience with our powerful MT4 indicator designed for seamless analysis and real-time insights. Key Features: Effortless Awesome Oscillator Scanning: Unlock the full potential of the Awesome Oscillator Scanner by effortlessly scanning multiple currency pairs. Receive instant alerts when specific Awesome Oscillator conditions are met, ensuring you stay ahead of market movements. Comprehensive Da
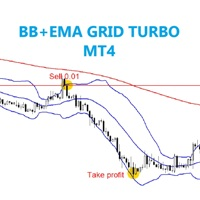
The EA trades on candles breakout from above or below BB, then be checked trend by MA to confirm order position. SETTING Symbole - Set symbol to trade. BB_period - Set BB period. BB_deviation - Set BB deviation. MA_period - Set MA period. Lots - start lot. Multiple_lots - Multiply lot for next order. Max_lots - maximum lot. Grid_boost - Frequency of opening position (Less = more order). Grid_minimum_pips - Check distance grid from last order. TP_pips - take profit, in pips. SL_money - Stop l

Daily supply and demand levels for breakouts or reversals. Use on 1 Hour charts No nonsense, for the confident trader who trades price action supply and demand levels with daily projections without the fluff using 1 Hour charts. MT5 Version: https://www.mql5.com/en/market/product/108522 The Bank Trader Indicator is a sophisticated tool employed by institutional traders, particularly those in banking institutions, to navigate the complex world of forex markets. Rooted in the principles of daily

What is this EA about? This EA is right for you if you use martingale or grid systems without own recovery. Why? Using Martingale or grid systems are pretty good on one hand because the give steady little return. But if the trend goes against the used system, more and more trades are opened. It can burn your whole account. During a trend normally there are some pullbacks. This EA is taking advantage of these pullbacks. It takes the oldest and and all trades with profit to calculate the average p

MTF Heiken Ashi MA is a multiple timeframe Heiken Ashi & Moving Average indicator. Fully customizable for advanced & unique Heiken Ashi & Moving Average calculations.
Key Features Modified appearance and appeal from the traditional using only H eiken Ashi MA bodies. MTF Higher or lower timeframes available making this it great for trends and scalping. There are many settings that can be non-repaint for signals at a new bar and at bar 0.
Inputs Timeframe = PERIOD_CURRENT - timeframe of Movin
FREE

Super Trend Bars is a trend finding indicator. It tries to find the trends that are most likely to trend. A set of indicators and a set of algorithms. Trend probability changes color when it finds a high trend. The red color represents the declining trend. The lime color represents the upward trend. Super Trend Bar changes color when it finds a trend.
Features This indicator is a trend indicator by itself. It can operate without the need for additional indicators. When you see the first lime c

Box martingale system is an indicator designed to trade martingale. This indicator sends a signal from the highest point where the trend is likely to return. With these signals the user starts the trades. These signals appear in the form of a box. The user can see from which point the signal is given. The important thing in trading martingale is to find a good starting point. This indicator provides this starting point.
Trade rules Start processing when the first trade signal arrives. The impo

Pivot trend indicator is a trend indicator that uses standard pivot calculation and some indicators. The purpose of the indicator is to calculate the possible trends using the pivot point. And to give the user an idea about trend direction. You can use this display as a trend indicator. Or with other indicators suitable for your strategy.
Features The green bar represents the upward trend. The red bar represents the downward trend. The blue pivot point represents the upward trend. The yellow p

My Intraday trading session indicator. SL Session Strength 28 Pair https://www.mql5.com/en/market/product/57585 This strategy is even used by the Banks to make profits. They take a strong currency and pitch against a weak currency This indicator allows you to analyze the hidden trends and correlations between the 8 most traded currencies via unique strength meter which creates multiple charts in a single window based on the price action of each currency in relation to all other currenci

Description: The indicator shows the TDI indicator in a separate window, and with the RSI component, the indicator finds possible divergences with M or W patterns. KEY LINKS: How to Install - Frequent Questions - All Products Functions: Finds Market Makers patterns. Finds extremes or exhaustion into the market. Looks for a trend continuation. Content: TDI Indicator Divergence and M or W Signals Note 1: This indicator should only be considered as a part of any trading strategy. You shoul

KT MACD Alerts is a personal implementation of the standard MACD indicator available in Metatrader. It provides alerts and also draws vertical lines for the below two events: When MACD crosses above the zero line. When MACD crosses below the zero line.
Features It comes with an inbuilt MTF scanner, which shows the MACD direction on every time frame. A perfect choice for traders who speculate the MACD crossovers above/below the zero line. Along with the alerts, it also draws the vertical line

An indicator based on candlestick patterns
To catch short-term and long-term trends
If it gives a signal in the direction of the trend, it is long term
And if it gives a signal in the opposite direction of the trend, it is short term
Too many signals
Can be used in all symbols
Can be used in all time frames
Attributes: Too many signals Can be used in all symbols Can be used in all time frames Simple settings Simple and fast usage With author lifetime support
Settings: Candle back: Th

THIS EA IS DESING TO USED IN BTCUSD
Do you want to accompany Criptotrading to the next level of bitcoin trading?
You just have to download it and try it yourself. Also testing it is free. Are you not going to try them?
Criptotrading it is a Secure Automated Software for trade Forex market and indices.
The architecture is a Fully Automatic Autonomous Robot Expert capable of independently analyzing the market and making trading decisions
Criptotrading It is an advanced and profe
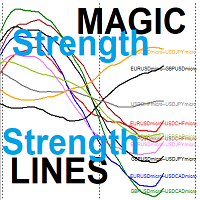
the MAGIC Smooth Strength lines for Currencies couples Each line represents the relative strength of two couples out of 5 user input symbols -> 10 indicator lines Your Strategy is based on selecting the weaker strength line and wait for a reversal sign OR Your Strategy is based on selecting the stronger strength line and wait for a reversal sign When reversal occurs you will trade on the two symbols represented by this line like the strength relative line for EURUSD and USDCAD when it is th

This is the multi-time frame Fisher Divergence indicator for MetaTrader 4, with signal arrows and a Signals panel which is freely movable showing the last signals and their time in color. The indicator draws some lines based on signal time. On the time frames below H4, the indicator scans for H4 divergence signals and draws it on chart with thick trend lines, and also it draws arrows for them. And also it scans the current time frame and draws a line at divergence location and places signal arro

Trendfinder SMA With Zone and Alert are Colored candlesticks showing the trend based on two SMA as Signal and two SMA as a Buy and Sell Zone and the slope of the slow moving average. This indicator will give you the color change on the next bar on the confirmation candle and will provide alert on Buy and sell signal, when it enters the buy and sell zone and when the market test the buy or sell zones as support or resistance and will never repaint . This indicator has the following: 2 SMA for th

このインディケータはボリンジャーバンドを裁量およびEAで実際に利用してきた私自身の経験から、より手軽に、かつ効果的に活用できるよう作成された裁量トレード用サインツールです。 ブレイクアウトでの順張り、リバウンドでの逆張りの両面で利用でき、各種のフィルター機能でより精度の高いサインを発信します 勝敗判定機能により、このインディケータの直近の相場環境に対する有効性を確認できます 全通貨ペア、全タイムフレームで利用できます。リペイントはしません
設定項目は以下の通りです。 Bollinger Bands Period
Bollinger Bands Deviation
Bollinger Bands Shift
Entry Mode ...ボリンジャーバンドにタッチしてからのBreakout(順張り), Rebound(逆張り)のどちらかを指定 Plus Filter ...独自アルゴリズムによるフィルターでシグナルの精度を高めます(Reboundモード専用) Trend Filter ...下で設定する移動平均のトレンド方向でのシグナルに限定します Moving Aver

This indcator shows the trend with the color histogram. It is simple and easy to use. Usage: If the histogram changes from the aqua to the fuchsia, which means the trend is up. If the histogram changes from the fuchsia to the aqua,which means the trend is down. Inputs: MaPeriods: the periods of moving average. f1: the multiplier of inner bands f2: the multiplier of outer bands Popup Window Alert Email Alert Mobile Push Alert Alerts When the trend changes from the long trend to the short trend or

This indicator provides several drawing tools to assist in various methods of chart analysis.
The drawings will keep their proportions (according to their handle trendline) across different chart scales, update in real time, and multiple drawings are supported.
#
Drawing Option
Description
1 Grid box draggable boxed grid, user defines rows x colums, diagonal ray option 2 Grid partial or fullscreen grid, sized by handle line 3 Grid flex a diagonal grid, sized and sloped by handle line

PURCHASE THIS INDICATOR AND GET OUR SECRET BONUS! Why is TREND Important? This is one of the biggest questions asked by beginner traders. Trend is important because that is primarily when the market moves the most. When a market has good volume, many banks, hedgefunds and large institutions are participating and driving price up or down in strong trends. THIS IS THE PERFECT TIME TO TRADE. The uGenesys Multi-Trend Indicator was specifically designed to identify when a trend has started in the ma

EA Setting, Common Common
1)Long & Short -allow EA open short and long position
Live Trading
1)Tick -Allow live trading
Safety
Tick All
1)Allow DLL import
2)Allow import of external experts
3)Allow modification Signal settings Inputs Variable Value Remarks Open new series true Make it default Trade BUY true Make it default Trade SELL true
Make it default Support manual order true
Make it default Max sell order 10 You may co

Pivot Points และระดับ (Support) และ(Resistance) บนแผนภูมิการเทรดใน MetaTrader 4 สำหรับตลาด Forex : คำนวณ Pivot Points : สคริปต์คำนวณจุด Pivot โดยใช้ข้อมูลราคาประวัติศาสตร์ เช่น ราคาเปิด, ราคาสูงสุด, ราคาต่ำสุด, และราคาปิด จากช่วงเวลาที่กำหนด (เช่น วัน, ชั่วโมง, ฯลฯ) จุด Pivot และระดับต่างๆ เช่น R1, R2, R3 (ระดับการต้านทาน) และ S1, S2, S3 (ระดับการสนับสนุน) ถูกคำนวณออกมา แสดงบนแผนภูมิ : หลังจากคำนวณจุด Pivot และระดับต่างๆ, สคริปต์จะแสดงเส้นเหล่านี้บนแผนภูมิ MT4 เพื่อช่วยให้นักเทรดสามารถเห็นจุดที่
This indicator computes Chaikin Money Flow (CMF) which is very useful to identify price trend. The indicator provides alerts when upper or lower levels (specified by user) are crossed by CMF. You can decide to receive a standard alert on MT4 and/or a push notification on your Metatrader app. You can configure the indicator by also specifying: • CMF periods • Levels at which the alert is provided
Link Telegram Channel for help settings
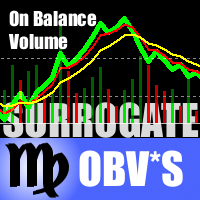
This is a special edition of the On-Balance Volume indicator based on pseudo-real volumes emulated from tick volumes. It calculates a near to real estimation of trade volumes distribution for Forex instruments (where only tick volumes are available) and then applies conventional OBV formula to them. Volumes are calculated by the same algorithm that's used in the indicator TrueVolumeSurrogate . The indicator itself is not required but can be used for reference.
Parameters MAfast - fast moving a

MA Multi-Currencies Multi-Timeframes Histogram BUY/SELL Indicator up to 6 currencies on time calculations based on 6 time frames : M5, M15, M30, H1, H4, D1 Trading Strategies: **TREND shifts to UP trend when Green point appears after Red and Gray points -> Close SELL positions then add new BUY positions on new Green points **TREND shifts to DOWN trend when Red point appears after Green and Gray points -> Close BUY positions then add new SELL positions on new Red points ** Close BUY position

Introducing the SPYDER AI Intraday EA , a revolutionary forex expert advisor that combines cutting-edge technology with the power of CHATGPT and AI to navigate the complex world of currency trading. Designed to excel in both trending and ranging markets, SPYDER AI Intraday EA brings a new dimension to your trading experience. Telegram for live updates(myfxbook) and huge discount - https://t.me/botshub670 With a special focus on the AUDNZD , AUDCAD , and EURGBP currency pairs, SPYDER AI Intraday
Mars 12 is a Pullback indicator is a powerful indicator of Pullback trade for any par and any timeframe. It doesn't requires any additional indicators for the trading setup.The indicator gives clear signals about opening and closing trades.This Indicator is a unique, high quality and affordable trading tool. Can be used in combination with other indicators Perfect For New Traders And Expert Traders Low risk entries. Never repaints signal. Never backpaints signal. Never recalculates signal.

This is an advanced multi-timeframe version of the popular Hull Moving Average (HMA). Features Graphical panel with HMA indicator data from all timeframes at the same time . If the HMA has switched its direction on any timeframe, a question mark or exclamation mark is displayed on the panel, accompanied by a text and audio message. The messages can be configured separately for each timeframe using the corresponding checkboxes.
The indicator is located in a separate window, so as not to overloa
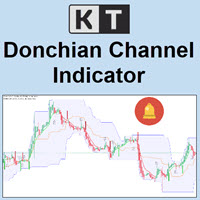
KT Donchian Channel is an advanced version of the famous Donchian channel first developed by Richard Donchian. It consists of three bands based on the moving average of last high and low prices. Upper Band: Highest price over last n period. Lower Band: Lowest price over last n period. Middle Band: The average of upper and lower band (Upper Band + Lower Band) / 2. Where n is 20 or a custom period value is chosen by the trader.
Features
A straightforward implementation of the Donchian channel

** All Symbols x All Time frames scan just by pressing scanner button ** *** Contact me after the purchase to send you instructions and add you in "Order Block group" for sharing or seeing experiences with other users. Introduction: The central banks and financial institutions mainly drive the market, Order block is considered a market behavior that indicates accumulation of orders from banks and institutions, then the market tends to make a sharp move(Imbalance) on either side once the order bl

EA Dragon Golden is an EA with a scalping strategy system following the trend candle or reverse, it is recommended to use large and sufficient equity because this EA is a martiangle system and can be used for hedging. Due to many requests to return to the previous version, this product is currently the old version of Dragon Golden. If you want a new product you can download it here : Agape Advisor
IMPORTANT! Contact me immediately after the purchase to get instructions and a bonus! Only 4
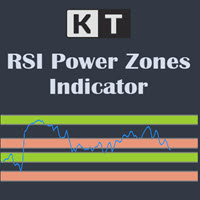
The KT RSI Power Zones divides and shows the movement of RSI into four different power zones to identify the potential support and resistance zones using the RSI.
Bull Support The bull support ranges from 40 to 50. The price is expected to reverse to the upside from this zone.
Bull Resistance The bull resistance ranges from 80 to 90. The price is expected to reverse to the downsize from this zone.
Bear Support The bear support ranges from 20 to 30. The price is expected to reverse to the

Martin Armstrong Cycles employs an unconventional form of technical analysis on your charts aimed at capturing market angles, swift market movements, price reversals, and early trend shifts. I strongly advise all traders to integrate cyclical analysis into their charting methods, as it unveils the inherent rhythms of markets. Every element in the universe follows a cycle, and so does price!
Analytical Benefits of Cyclical Analysis
The angle of the cycle provides a roadmap for anticipating fu
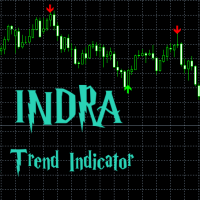
What is the INDRA Trend indicator? A INDRA Trend is a trend following indicator which give most accurate arrow signals of BUY and Sell based on the moving average , buying power and selling power in market, checking with other multiple indicators and providing the best possible time to get in to the market . This indicator is tested in multiple time frames as showed in screenshots it is also tested in multiple currency pairs , crypto and metal pairs such as USD/CAD EUR/JPY EUR/USD EUR/CHF US

SuperTrend AM is an indicator that allows you to open a position at the very beginning of a significant price movement. The second most important quality of the indicator is the ability to follow the trend as long as possible in order to obtain all potential profits while minimizing potential losses. This indicator does not repaint or not recalculate. A version of this indicator with advanced settings and signal notifications is SuperTrend 3 AM .
Signal of the indicator: red arrow appearing a
FREE

Mr. Averager MT4 is a Expert Advisor for the MetaTrader 4 trading terminal. The trading algorithm is based on the principle of position averaging. Due to averaging, the EA is not sensitive to the quality of entry points and can work almost at any time and in almost any market. The EA supports 2 trading modes: Automatic start and Manual start. In Automatic start mode, the EA independently starts a new series of orders. In Manual start mode, the first order of the series is opened manually using
Convergence Pro is a fully automated expert adviser that uses a model of trading designed to find entries at retraces, retrace extremes, and reversals. A safe multiplier is employed in order to recover unprofitable trades and maximize profit. This EA is always trading, relying on the convergence of trend exhaustion points at multiple time frames to take advantage of reversals. Convergence Pro is currently designed to work on the M30 timeframe . Demo signal currently resides here: https://www.
FREE
Signal Trend Super
Indicator of accurate market entry.
Very good entry indicator for your trading system, I recommend to use it together with - System Trend Pro and Professional Trade Arrow
The indicator does not redraw and does not change its data. Wait until the candle closes.
Any questions? Need help?, I am always happy to help, write me in private messages or
In Telegram
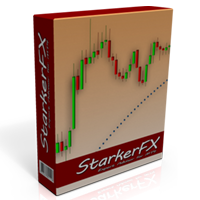
StarkerFX EA is a martingale and trend following robot with trailing stop . This expert advisor is using MACD and Parabolic SAR indicators. There are no complicated settings. The only one input is the equity multiplier for automatic lot calculation. If you want to change it, please backtest it before using on real account. higher equity multiplier = higher lots = higher risk (recommended setting is: 1.0) This EA has been optimized for EUR/USD currency pair and for M5 timeframe. Feel free to ba
FREE

"Wouldn't we all love to reliably know when a stock is starting to trend, and when it is in flat territory? An indicator that would somehow tell you to ignore the head fakes and shakeouts, and focus only on the move that counts?" The Choppiness Index is a non-directional indicator designed to determine if the market is choppy (trading sideways) or not choppy (trading within a trend in either direction). It is an oscillating indicator between -50 (very trendy) and +50 (very choppy). There are man

The indicator shows the channel in which the price moves The algorithm for calculating the indicator is based on Fibonacci numbers, and also depends on the volatility of the instrument. Corrections and price reversals are most likely near the channel borders. Allows you to conduct trend and counter trend trade within the channel It works on all timeframes, on any currency pairs, metals and cryptocurrency Can be used when working with binary options
Distinctive features Shows clear boundaries o
FREE

CCI Trend Finder indicator with different colors at levels 0, 100 and -100. The cross is a signal for "123 Exit" as presented by MPlay and used in Woodies CCI system. This exit signal is effective especially in short-term breakout trades, because it prevents early exiting at small corrections. This indicator is great for having it as an extra tool for your analysis.
FREE

Th3Eng HistoMaster indicator Free Histogram Indicator to detect the current trend direction. The indicator is based on CCI indicator. Also draw arrows when it detect the trend is strong buy or strong sell, with Alerting system (Popup with sound, Email alerting and mobile notification). Also draws a dashboard shows all Time-Frames' current signal.
Requirements
works with all pairs, stocks, CFDs and crypto currencies. works with all Spreads works with all Account types works on all Time-Frames
FREE

It is an algorithm to detect trend changes early. You should try multiple values for the Multiplier parameter (1 <value <10 recommended). At first glance you can see effective entries. This is, in fact, one of the rows that Geleg Faktor initially had. But it was removed because it was no longer needed. The other rows were sufficient for G.Faktor's effectiveness, but I still wanted to share this one.
Always test before using it on your live account so that you fully understand how it works and
FREE

*OPTIMIZE THIS EA BEFORE TEST, MAKE SURE IT WORKS FOR YOU BEFORE PURCHASE Once upon a time, in the bustling streets of Wall Street, there existed a sophisticated algorithm known as the "MOMENTUM PRO" Trader. This digital entity was not just any ordinary piece of code; it was equipped with a repertoire of a feed forward neural network that gave it a keen insight into the ever-shifting dynamics of the financial markets.
At the core of its decision-making process lay the moving averages (MA) and

BreakHarmony Multi-Timeframe Breakout Indicator for MT4
The BreakHarmony Multi-Timeframe Breakout Indicator for MT4 is a highly advanced tool providing information on breakout points across different timeframes, aiding traders in decision-making and understanding market movements. [ Features and Manual | MT5 version | All Products ] The indicator tracks breakout points on price charts across 6 timeframes. Breakout prices are indicated with the closing price of the corresponding candl

Classic indicator. The Fractals indicator analyzes the price patterns that form on the candlestick chart and display the reversal points of the market trend. The indicator consists of candles, the middle of which is either the highest (up fractal) or the lowest (down fractal). Highs and lows, indicated by the indicator on the chart, are recommended to be taken as points that form support and resistance lines. Unlike the original indicator, where fractals are formed by five candles (high/low in t
FREE

The logic of this robot is simple, but very powerful. It monitors the current trend using long-term candlesticks, using multiple candlesticks to increase reliability. The EA first monitors the current trend and then places orders in line with the trend. The timing of the orders is based on an internal RCI indicator. The entry value for RCI can be freely adjusted. A value closer to 1 will increase accuracy, but decrease the frequency of entries. It trades with a TP of 50 and an SL of 50, but if
FREE

This powerful tool helps you to easily access Fibonacci tools at different times and in different markets. This tool has the ability to send signals based on Fibonacci as well as setting alarms to be aware of broken Fibonacci levels. Among the capabilities of this tool are the following:
Identifies market trends Fibonacci auto design If Fibonacci levels are broken, it sends a message Send Fibonacci signal
Manuals: After selecting the target market, run the tool In the input settings accordi
FREE
After purchasing, you can request and receive any two of my products for free!
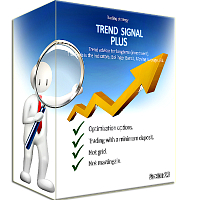
После покупки вы можете запросить и получить два любых моих продукта бесплатно! Trend signal plus is a trend advisor. The EA is based on the following indicators: Bollinger Bands, Moving Average, RSI. Entering a buy / sell position is carried out according to a trend on rollbacks on a signal with partial closing of the first position at a small take profit. Currency pairs: H1; M30 (EURUSD, GBPUSD, EURJPY, EURGBP
FREE

TrendFinder VolumeI are Colored candlesticks showing the trend based on Volume and Slope of Trend
This indicator will give you the color change on the next bar on the confirmation candle and will never repaint Lime Green = Possible Buy (Volume up), Teal Green = Bullish Weak (Volume Decreasing), Red = Possible Sell (Volume up) , Orange = Bearish Weak (Volume Decreasing)
TrendFinder Volume is optimize to trade on any market and to be used trending and None trending markets. For best results us
FREE

Free parabolic SAR expert advisor is a completely free expert advisor that trades using Parabolic SAR dots. It opens and closes trades based on the first dots of a new trend. The various settings are explained below.
Parameters NOTE: The default settings are just place holders and not necessarily the best. Use the settings that best suites you or your strategy. Lots - This is the lot size of the EAs trades. 0.1 is the default setting. StopLoss - Stop loss setting. AllowBuy - Set to true to all
FREE

Bollinger Bands with NN “Bollinger Bands are a widely used technical indicator for measuring and displaying the volatility of securities. The bands accomplish this by showing whether prices are high with the use of an upper band, and whether they are low with the use of a lower band. The bands are based on the volatility (standard deviation) of the past price data. This indicator can aid in rigorous pattern recognition and is useful in comparing current price action to possible buy and sell sign
FREE
MT5 Version Available Here: Coming soon...
Telegram Channel & Group : https://t.me/bluedigitsfx
V.I.P Group Access: Send Payment Proof of any of our Paid Products to our Inbox
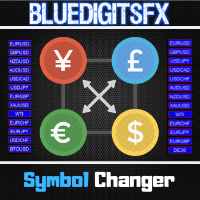
Recommended Broker: https://eb4.app/BDFXOsprey * The Most User Friendly Symbol Changer on Metatrader ! Features
Change Timeframes in 1 click of a button on 1 chart. Change Between All Currency Pairs in 1 Click of a button on 1 chart. Ability to Turn Boxes to Current Candle Colors. Easily Identify the Trend f
FREE

The End Point indicator is an indicator that predicts that the tired trend should now return. In this indicator law, we can easily understand that the trend which is in constant or continuous decline should now be reversed. to With these signals the user starts the trades.
Our Popular Products Super Oscillator HC Cross Signal Super Cross Trend Strong Trend Super Signal Suggestions Recommended time interval: M30, H1 Run with at least 20 pairs. Operate with a maximum of two pairs. For every coup
FREE

Traditional RSI is one of the most popular and must-known indicator that every traders would use. In this combination, we use two RSI period with smoothed factor to smooth the RSI lines for better results. Besides, bottom of Indicator is the Trend-filter display in different colors in order to let Traders identify the trends much easier Grey : Sideway market Light-Blue : Weak UP-Trend Blue : Strong UP-Trend Light-Red : Weak DOWN-Trend Red : Strong DOWN-Trend Signal: Blue-Arrow
FREE

GoldTrend MT4 - is a leading indicator for Gold on MetaTrader 4
- In Update version has been added new ability on USD pairs
( AUDUSD, EURUSD, GBPUSD, NZDUSD, USDCAD, USDCHF, USDJPY )
- very easy to use , even for beginners
- Stoploss and Take Profit provided - no repaint, no redraw and no lagging
When you decide to enter the global market , then there is a technical skill you absolutely must have, - which is all about trends .
Why - GoldTrend is different from others :
Not onl

Check the Trend Power This indicator is designed to identify the POWER of trend. This is NOT define bullish or bearish trend. It is quite easy to look at the power when the indicator line turns Green the trend are strong when the indicator line turns Red the trend are Weak strategy for trade is : Open possition only when the power go Green Exit possition when the power change to Red
FREE
Use Stochastic with oversold and overbought to find trading opportunities. Use RSI to identify strength of trend anf confirm the trend matches the stochastic overbought and oversold. Trade on MACD cross matching the trend identified by Stochastic and RSI. Set stop loss at a recent swing high or swing low. Set take profit as a ratio of stop loss. Exits are on take profit and stop loss only, there is no exit signal.
FREE
This oscillator calculates different price/time vectors to plot the aggregate market direction and two moving averages, in order to detect if the market is accelerating or decelerating. [ Installation Guide | Update Guide | Troubleshooting | FAQ | All Products ] Easy to use and understand Acts as a top-quality filter for trades It has a unique speed detection algorithm It is non-repainting and non-backpainting It implements alerts of all kinds It can be used as a top-quality filter for trend tra
FREE
Hello traders, this trading strategy is based on the the Larry Connors RSI-2 strategy, We begin with a 200 periods EMA to find the direction of the market. This is important because we only trade in the main trend direction.
We then look for pull backs using the RSI with a period of 2 to get entry signals. Trades are then exited using the 5 EMA.
Lot size should be calculated using 1% of 1 the ATR value and positions can be added as long as the entry criterion is met.
TRADING IS RISKY AND
FREE

BOROT Assistant : Trading Assistant for Manual Traders
Description:
The Trading Assistant is a user-friendly tool designed for manual traders to improve their trading performance and enhance their decision-making process. It offers a comprehensive range of features that help traders effectively manage risk and reward, execute orders, and identify potential trading opportunities. The Assistant's key features include:
Risk and Reward Box : Clients can easily draw a risk and reward box on the
FREE

Simple indicator that shows external ( outside ) bars. In certain cases, external bars can be seen as strong trend bars instead of range bars. This can be observed when a with-trend external bar occurs at a reversal from a strong trend. It will help you notice more easily different patterns like - Inside-outside-inside, Inside- Inside -inside, outside - Inside -outside, etc. Works perfectly with my other free indicators Internal bar and Shadows
Inputs: How many history bars to calculate on l
FREE

The ADX Trader is a project for you, it has great potential. Ill upload the source file of this EA on my blog, so keep a look out for it. You may tweak it to your satisfaction. It comes with risk management, and built in Algo. You'll notice when you click on View" inside mt4, top left corner, you'll have an option "strategy tester". Click on it, run it in the strategy tester by selecting "Forex mastery ADX trader". If you have the source code (from my blog), then you have the ability to change h
FREE
Il MetaTrader Market è il posto migliore per vendere robot di trading e indicatori tecnici.
Basta solo sviluppare un'applicazione per la piattaforma MetaTrader con un design accattivante e una buona descrizione. Ti spiegheremo come pubblicare il tuo prodotto sul Market per metterlo a disposizione di milioni di utenti MetaTrader.
Ti stai perdendo delle opportunità di trading:
- App di trading gratuite
- Oltre 8.000 segnali per il copy trading
- Notizie economiche per esplorare i mercati finanziari
Registrazione
Accedi
Se non hai un account, registrati
Consenti l'uso dei cookie per accedere al sito MQL5.com.
Abilita le impostazioni necessarie nel browser, altrimenti non sarà possibile accedere.