Guarda i video tutorial del Market su YouTube
Come acquistare un Robot di Trading o un indicatore
Esegui il tuo EA
hosting virtuale
hosting virtuale
Prova un indicatore/robot di trading prima di acquistarlo
Vuoi guadagnare nel Market?
Come presentare un prodotto per venderlo con successo
Expert Advisors e Indicatori per MetaTrader 4 - 182
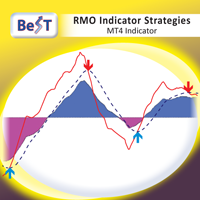
BeST_RMO Indicator Strategies is an MT4 Indicator that is based on the corresponding famous Oscillator created by Rahul Mohindar that detects trends in all markets and it can produce Buy and Sell Signals of high winning probability forming a complete and standalone trading system of impressive results.
The indicator uses 2 strategies as a selection: i) Classic : produces Reversed Entry Signals by the crossings of zero (0) line and ii) MAsSignals : produces Reversed Entry Signals using MAs of RM

Money Printer EA is an Expert Advisor designed specifically for trading Gold and Forex. - It good to combo with Buy Sell Signals to follow Trend and Sellect Buy Only/Sell Only for EA work Semi-Automatic. - Recommend ECN broker with LOW SPREAD: IC Market , Exness, NordFX , FXPRIMUS , Alpari , FXTM
SETTINGS Max order - Maximum of orders. Open new series - on / off beginning of a new series of orders.
Start lots - start lot. Trade Buy - allow the adviser to buy. Trade Sell - allow the advis

The Trend Hist indicator is designed to display on a chart and visually evaluate the trailing algorithm by inside bars.
This indicator finds strong trend movements of a currency pair on a given number of bars, and also finds a correction to this trend. If the trend is strong enough, and the correction becomes equal to the one specified in the parameters, then the indicator signals this.

Description of strategy: The EA trades on 2 pairs with a positive correlation. On one, he trades only for buying, on the second only for selling. If the position goes to a loss, the adviser begins to resolve it by opening deals much smaller in volume than the original one and biting off small pieces on price rollbacks. The opposite trade, which is in the black, will not be closed until the unprofitable one is resolved or until they reach the specified profit in total.
Clearing (averaging) trades

Closes a losing position. Due to the previous continuous, profitable series. SymbolsWork: Currency instruments (pairs) for the EA to work with. There may be variations when setting a pair. If set simply as EURUSD , GBPUSD: or AUDUSD:ALL , the EA opens both buy and sell orders. If a specific order type is set after a colon USDJPY:BUY , then the EA opens only buy orders and in case of eurjpy:sell , it performs only sell orders. The pairs are separated by commas. For example, the following entry "E

Hello everyone
Tasty Lemon is a very easy to use trading system. With the help of the MACD and the ADX indicator, the trading system searches for suitable entry points on the H1 and H4 charts. Since the expert advisor tries to achieve higher profits, it works with a trailing stop. The strategy does not include any Martingale or Grid components. To keep the risk as low as possible, we recommend 1000$ per 0.01 lot and a VPS or a 24/7 computer so that the EA can monitor the positions.
Traded curr

This is the PORTUGUESE version, to buy the ENGLISH version, visit: https://www.mql5.com/en/market/product/103149 GET LordEA FREE INSTALLED AND OPERATING ON YOUR ACCOUNT, ASK ME PRIVATE MESSAGE. The LordEA specialist is a robot for Meta Trader with the objective of working with the robot's own trend and strategies.
We use by default methods of distancing and type of geometric lot where the robot will detect through the trend an exact time to open a new order, or even under martingale. LordEA i
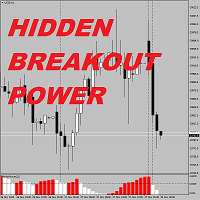
Hidden Breakout Power The market has a cycle, keeps on moving from: RANGE -> BREAKOUT -> TREND ->CONSOLIDATION ->RANGE RANGE and TREND The two major states, while the BREAKOUT refer to the short period of market breaking the range, CONSOLIDATION refer to the long consolidation of market and shrink to range. Usually oscillatory indicator performs well in RANGE states and perform poorly in trend state, while TREND indicator is the other way around, it performs will in a TREND states and but poor
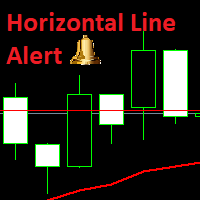
This indicator's main objective is to be able to receive alerts whenever your support and resistance level have been touched and has the candle closed over the support/resistance level. It is a fairly simple indicator, all you need to do is place a horizontal line at where your support/resistance level is and whenever a candle touches and closes past the candle, you will receive an alert. Each line will generate two alerts per candle, once when the candle touches the line and once when it closes

1. Automated trading system 2. Follow the trend / Breakout / Price Action 3. It can be add more positions to the trend(Pyramiding)
Parameters:
EA1: Entry Strategic Settings Stop New Open Orders: false/true Strategic_ABC: TrendFollow/BreakOut/PriceAction Trade Direction: Buy_Only Sell_Only Buy_Sell Pyramid Hedge(Long+Short): true/false(add positions to both direction) Hidden SL/TP Line: It can be hidden SL/TP line
EA2: Risk Management Setti

Bomber is a fully automated Algorithmic Expert Advisor with multi-Strategies based on our IA optimization on different traditional strategies such as moving average , Ichimoku ,ADX, ... ,You are able to choose any one of the strategies or using all of them same as default setting together. live signal: https://www.mql5.com/en/signals/940345 Telegram group: h ttps://t.me/BomberExpert :::::::::::::::Requirement & Recommendations::::::::::::::: Please send us private message for better support.

This PORTFOLIO of 5 strategies has been developed, tested and traded live on GBPJPY H1 TF. Multiple EAs traded together will lead to a bigger profits and smoother equity curve. 5 not correlated EAs logics for GBPJPY H1 merged to a single strategy. Very SIMPLE STRATEGIES with only FEW PARAMETERS. Every trade has his own logic for STOP LOSS. To catch the profits every strategy uses different approach - some has TAKE PROFIT, some uses TIME BASED EXITS or PROFIT TRAILING. EA has been backtested o
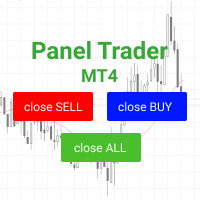
Торговая панель для быстрой и удобной торговли. Панель позволяет быстро открывать и закрывать ордера. Отдельное закрытие ордеров по позиции Sell и Buy. Так же есть возможность закрыть полностью все ордера. Торговая панель выводит информацию о прибыли, общего объема и количестве ордеров по позициям Sell и Buy. Иногда некоторые позиции могут не закрыться это связанно из-за волатильности рынка. В таком случае повторно нажмите закрыть позицию. Для работы панели необходимо разрешить автоторговлю.

The Trend Slow indicator uses the author's algorithm for analyzing price behavior and displays the result of complex work in the form of lines. For simplicity, the algorithm automatically changes the line color according to its direction.
The indicator has a parameter to enable alerts when the color changes, thus helping the trader to identify new market trends.
This system will help you find high-probability trades in the direction of strong trends.

Breakouts Strategy EA is a Secure Automated Software for Generation of Daily Profits for Forex Market. Safe strategy! The architecture is a Fully Automatic Autonomous Robot Expert capable of independently analyzing the market and making trading decisions.
The Trading system is Multi-currency and is able to trade on H1 charts: EURUSD, GBPUSD, USDJPY, SPX500, DAX30, GOLD - NOT Martingale! NOT GRID, Averaging and other dangerous strategies are NOT used! - Recommend ECN broker with LOW SPREAD:

Galaxy Gadman X9 is a fully automated Expert Advisor designed for Traders. Galaxy Gadman X9 is a robot trader with multi-currency scalper Expert Advisor. Galaxy Gadman X9 uses a trading system buystop and sellstop orders This robot trades on any Time Frame, Can be use on all pairs. This not martingale, hedge, or averaging Expert Advisor. The system is ready-to-use with the setup is simple,with simple optimization on Stop Loss, and Trailing. Please use a good broker with low spread and low stop

LordAutoTrendLine is an indicator for MetaTrader that was developed with the intention of analyzing up and down trend lines in the financial market.
Trend lines are used to calculate together with a Fibonnaci for example, the high and low of a currency pair.
In the example of the H4 images, we can see a line crossing 1790 high and 1784 low, an example, if going below 1784 will mean selling, and very certainly according to the line, it can reach 1790 first without any much effort, ie , purchas

SALE:
Special Intro Price: $80
0/10 copies at $250
0/10 at $500
Final price: $750
After years of detailed study we have finally released Pip Producer . This EA is the result of years of hard work and we believe that you will love the system we have put together here. Pip Producer is a system of 26 individual high quality signals, that adapt to the market conditions. The system employs a fixed money management system where you can set your risk according to your account size. 0.01 lots per $1000

THE SOUND OF MARKET is an indicator designed to detect the sound produced for the market movement. This system detects the background sound produced by market movements in real time to decide in your operation. In addition, by analyzing the sound recorded in the indicator, we can detect operational patterns. You can download the demo and test it yourself.
The indicator has a text help in the upper right corner, in which it shows whether the indicator has a bullish or bearish backgrou

Team Trading System is based on the logic of order strategies and profit-taking strategies working as a team. In general, EA consists of two parts as strategies and take profits section. Strategies section are special strategies that we create for symbols. Strategies continue to open buy and sell orders independently. Takeprofits closes orders that are opened by working as a team. Take Profits logic is that profitable orders go by closing lost orders. They never work selfishly. In this wa

Индикатор горизонтальных и вертикальных объемов. Предназначен для внутридневной и среднесрочной торговли (до Н4).Рассчитывается на основе тиковых или реальных объёмах (если их предоставляет брокер). Ценовой уровень, внутри свечи, на котором было максимальное количество сделок, выделяется цветом. Вертикальные объемы определяют паттерны Price Action (SonicR, BetterVolume) или импульсы (Enhanced) на выбор. Сочетание вертикальных и горизонтальных значений позволяет определить среднесрочные уровни по

Brief description
TrendWatch indicator analyze chart trend strength and acceleration. Analysis is based on close price SMA with configurable period. Result is given as set of two curves in the indicator window. Blue (default color) curve identify trend direction and strength. Yellow curve (default color) identify trend tendency to accelerate/deceleare. Scale of curves is normed to maximal value in given time period. Both curves can be additionally smoothed using configurable SMA and/or set to z

The indicator shows the trend change and how the market is changing. When calculating, many parameters are weighed. Therefore, divergence between the chart and the indicator is possible.
Input parameters:
IndicatorPeriod: several calculation periods (small - small period, medium - medium period, long - long period).
You can trade by divergence, analyzed on the resistance and support lines (and other types of graphical analysis), as part of other indicators. Tags: Stochastic, Trend.

Indicator formula: High-Low + Volume; Open-Close + Volume That is, an attempt to bring price and volume to a common denominator.
Input parameters:
IndicatorPeriod: several periods of calculation (small-short-term; medium-medium; long-long-term).
MnojitelLine, MnpjitelLine2 - multiplication of lines for comparison.
AverageVolume - averaging volumes for calculation (needed to remove the dependence on volumes).
If both the indicator and the chart make a fast jump, then we are waiting for a ro

The indicator is a tough Moving Average, weighted by many parameters. Accordingly, you need to trade according to the volatility of the chart. For convenience, moving averages of High, Low, Median ((High-Low) / 2) periods have been added to the indicator.
Input parameters:
IndicatorPeriod (green line): several periods (general-general, calculation for all periods; small- small period; medium- medium period; long- long period)
MaLine- indicator smoothing (Moving Average) (blue line).
PeriodH

Important!! ZO Trend MTF can't work on MN and W1 timeframe. /*--------------------------------------------------------------------------------------------------------------------------------------------------------------------------------------------- ZO TREND : https://www.mql5.com/en/market/product/49138 ZO Trend MTF an indicator used to search for entry point. With the session candle algorithm on many timeframe, ZO Trend creates an area for traders find good Entry Point. ZO SYSTEM BASIC SET

LordTrendSignal is a financial market indicator for Meta Trader that checks signals through trends and candles, works on all TimeFrames (M1, M5, M15, M30, H1, H4, D1).
LordTrendSignal checks the signal through trends and candles and informs you via notification, alerts via email and push on the automatic screen.
The trend flexibility of LordTrendSignal is high, however, together with other of our indicators LordAutoFibonacci and LordAutoTrendLine you will be able to work very well to obtain m

Team Trading System is based on the logic of order strategies and profit-taking strategies working as a team. In general, EA consists of two parts as strategies and take profits section. Strategies section are special strategies that we create for symbols. Strategies continue to open buy and sell orders independently. Takeprofits closes orders that are opened by working as a team. Take Profits logic is that profitable orders go by closing lost orders. They never work selfishly. In this wa
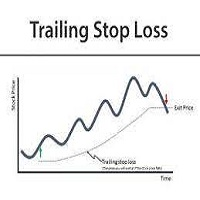
TrailingStopLoss
This tool applies trailingstoploss to orders opened manually or opened by an expert. * For testing on demo it will be open only one buy order so you can see how trailing stop works. It doesnt open orders itself in real or demo accounts but manage your opened orders .
It is simple to use.
Input Parameters
Stoploss calculation level : default is 5, stoploss will be calculation after 5 pips from opening price.
Stoploss movement step : default is 5, Once stop loss is activated,

Following trend indicator coached by Alina. This product made based by RSI and Oscillator. Another indicator to support this strategy will send to you free by whatsapp. Been tested this for over 3 years, over 60% winning rate. Support Eur Usd, Eur JPY , Nzd Usd, Xau Usd. Aud Jpy , Aud Usd , Eur Cad , Usd Cad , Usd Chf , Gbp Usd, Aud Cad , Aud Nzd. quality signals and can be used for everyday .
100% no redrawing
You can trade on any underlying asset.
The most favorable time for work is the European, American session.
When a blue arrow appears under the candlestick, an UP option is acquired.
When the red arrow appears, a DOWN option is acquired.
One feature of the indicator should be noted: a signal is generated when a candle is opened; it is worth opening a deal on this bar
Thanks to this, you can effectively trade binary options with 1-knee martingale money management (step) It

MOUNTAINS:It is an indicator that detects market consolidations prior to a movement.
The objective of this indicator is to indicate the areas before the market makes a move.
The areas that we are interested in detecting are the PLATEAU, which are between the slopes.
When the system detects a PLATEAU , the trader must place his operation in that area, waiting for the increase in volatility to reach its target.
The best option to carry out the operation of the PLATEAU is through coverage o

MEDUSA X is a Revolutionary Momentum and Pullback Algorithm Expert Advisor, specializing on the low spread major pairs, GBPUSD. This EA trades frequently during the day if there's a valid signal.
Real Signal: https://www.mql5.com/en/signals/1681843
Extremely EASY-TO-USE, with TREND EMA, RSI, Volatility filters all highly optimized at the backend.
Most of the time, the trades will TP 5pips with single entries. Like a experienced human trader, It utilizes additional Grid averaging trades (

Professional EA.
This EA has 3 ea's built in; You can choose whether to use the manual, the Classic, or Caramilla.
The EA automatically identifies supports and resistances, in the time frame set by the number of 1 minute bars (7200 bars, in the default (5 days)); the EA will calculate the pivot, looking for the high, low, and close from the number of bars entered.
It depends on the selected Ea (manual, caramilla, classic) it will calculate the support to open the long, and the resistance to op

This indicator significantly expands the capabilities of the usual ZigZag due to the addition of parabolic channels at the earliest stage of their inception. Download the demo version and test it in the tester. All graphics in the tester are working. But the ZigZag algorithm is special here, because it is implemented on a unique author's ultrafast loop-less algorithm for calculating parabolic regression and calculating its standard deviation. The features of this ZigZag are: Fast calculation, r
Trend PRO and Breakout EDGE Expert Advisor is developed using the PipFinite Trend PRO and Breakout EDGE Indicators, the best indicators on the market so far. PipFinite Trend Pro's smart algorithm detects the trend, filters out market noise and gives entry signals with exit levels. Whereas PipFinite Breakout EDGE follow a step-by-step system that detects the most powerful breakouts, discover market patterns that generate massive rewards based on a proven and tested strategy. This EA open order
LordOscilatorSignal is a financial market indicator for Meta Trader, which uses standard market indicators; Stochastic, Moving Average, MACD, MA Xover, P.SAR.
Exactly! this single indicator has the help and assistants of (5) indicators.
The LordOscilatorSignal has a graphic panel of great visualization and understanding, being able to observe the values of each indicator and timeframes.
LordOscilatorSignal identifies through the trends of the buying and selling indicators, if all indicators

The DYJ GlobalForexTradeWarLaguerre is based on Laguerre indicator. It can be used for any currency pair and timeframe. It also uses MA indicator filtering false signals.
open long order when FastMA crosses above the SlowMA and Laguerre's oversold. open short order when FastMA crosses below the SlowMA and Laguerre's overbought.
Most trading strategies put their emphasis on finding out when to enter the market. Whether it’s technical or fundamental, everyone is looking for an entry
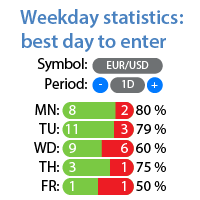
Statistiche di profitto/perdita per ogni giorno della settimana Guarda il mio #1 Utility : 66+ funzioni, incluse statistiche estese | Contattami se hai domande Modalità di visualizzazione delle statistiche: Per la coppia di valute/strumento di trading selezionato Statistiche per tutte le operazioni (" ALL ") Puoi selezionare il periodo per cui desideri ottenere le statistiche: 1 giorno 1 settimana 1 mese 2 mesi 3 mesi 6 mesi 1 anno 2 anni Intera cronologia di trading Informazioni visuali
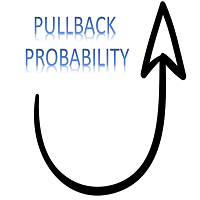
Pullback Probability It is an indicator that shows us the probability that the price will t urn around and we can operate that market turn.
The indicator marks a line that oscillates between a percentage of 0% to 100%.
The one indicated in the upper left corner shows us a help in which it informs us of the area in which the price is in real time, as well as the percentage that the candle is open. You can download the demo and test it yourself.
The indicator marks 6 work zones. 1) Above

Скользящее среднее с уровнями, построенными на основе индикатора ATR. В отличие от обычных уровней с постоянным отклонением, которые можно добавить к Moving Average, в уровнях MA with ATR bands учитывается волатильность рынка. Основной вариант использования индикатора: покупать при пробое верхнего уровня, продавать - при пробое нижнего.
ПАРАМЕТРЫ MA_Period : п ериод усреднения скользящей средней MA_Method : м етод усреднения скользящей средней MA_Price : и спользуемая цена для скользящей сред

We all dream of becoming a foreign exchange trading expert, making a lot of money and having a large number of trading fans who adore us. There seems to be only one thing standing in our way: actually learning how to enter and leave the foreign exchange market. Most trading strategies put their emphasis on finding out when to enter the market. Whether it’s technical or fundamental, everyone is looking for an entry signal. However, this only covers half of the trade. As any trader knows, there a

Hello. Sales of the first 3 versions are offered with a 50% discount and then the price increases. The signals generated by this robot: https://www.mql5.com/en/signals/1028072?source=Site+Profile Recommended broker for ProEA This robot is the result of my many years of experience in the field of financial data and programming. Pairs of currencies that can work with this robot: XAUUSD, GBPUSD, NZDUSD, AUDJPY, EURUSD, AUDUSD, USDCHF, EURGBP, GBPJPY. Of course, gold is not recommended for low capit
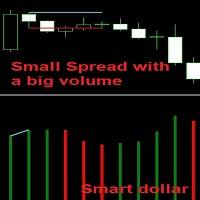
When the current candle is smaller than the previous candle but its volume is greater than the previous one, it means that the market maker is blocking the trend, means that it is in the process of (buying or selling). So when the price closes above that candle, we buy and if it closes below that candle we sell as well. Note that this candle becomes a strong zone as resistance or support. The indicator draws two lines on the divergence spread volume candle, you have to wait for the price to clo
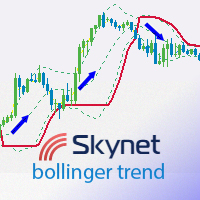
This indicator displays entry points to the market using Bollinger tapes and exit points, which are determined by the specified distance in points from the entry point. If indicator line is above the price - it is "sell" zone for traders, and if indicator line is lower than the price - it is bullish trend. The information panel shows the results of the indicator so that you can configure it more precisely and see how the parameters affect the result. Alert about the points of entry and exit come
Добрый день. Рынок форекс он иррационален иначе бы на нем бы зарабатывали 95 % трейдеров. Но статистика говорит об обратном 95 % рейдеров сливают свои депозиты. Это факт. И нет ни одного индикатора, который бы предсказывал движение рынка немного заглядываю в будущее. Как только вам показалось, что вот он граальный индикатор или советник - ваш депозит начинает таять. Рынок обязательно накажет и вы потеряете если не весь свой депозит, но значительную его часть точно. Раз рынок форекс иррационал

Bombi is a fully automated Algorithmic Expert Advisor with multi-Strategies based on our IA optimization on different traditional strategies such as moving average , Ichimoku ,ADX, ... ,You are able to choose any one of the strategies or using all of them same as default setting together. Live signal: https://www.mql5.com/en/signals/940345 Telegram group: h ttps://t.me/BomberExpert This EA is optimised for EURUSD on M15 time frame based on default setting .
You can find the full Ver

ВНИМАНИЕ — ИЗУЧИТЕ ОПИСАНИЕ! Применять только на валютной паре GBPUSD - H1. Данный индикатор ежедневно после закрытия 13-го бара определяет есть ли сегодня точка силы или нет. Если ее нет, индикатор ничего не нарисует, тогда этот день пропускаем. Если же уровень будет отображен, вам необходимо только наблюдать за дальнейшим движением цены. Чтобы сигнал предварительно был подтвержден важно, чтобы выполнились некоторые базовые условия в течение этого и максимум следующего дня, а именно: цена дост
The price fluctuates. Just like planets oscillating in a star system. The wavelength of the oscillations depends on gravity in the center and other factors in the system.
You can benefit from these oscillations with this expert advisor in the market.
It is an expert advisor suitable for beginners with simple usage inputs. Stoploss Calculation Level: Stoploss Begins after breakeven in points
Stoploss Movement Step: Step points after stoploss works.
Minimum Start Level in Points: Minimum strat lev
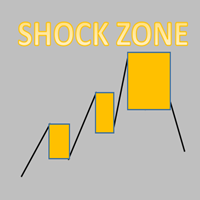
Every trading shock range is a point of gaining momentum!
The stop loss is generally the height of the shock zone.
Take profit depends on personal preference and market position. Generally at least double the height of the shock zone. Being in a good market position, it can have a profit-loss ratio of 5-10
Necessary for traders: tools and indicators Waves automatically calculate indicators, channel trend trading Perfect trend-wave automatic calculation channel calculation , MT4 Perfect tre

This is a price action trading robot, the EA will stick to the medium term trend and price to deliver trades. Orders are always protected by the user set stop loss points. With the capital management system, it will help that EA operates in accordance with its purpose. Telegram : https://t.me/trungtqIT
Timeframe is M5,M15. Minimum account balance: $30. Attention is Important: EA only test live on demo or real accounts. Backtest results are just random and inaccurate.
Features: Every trade is p

Provide ideas for trend trading.
Automatic calculation and generation of trend channels.
The channel line, also known as the pipeline line, is to draw a straight line parallel to the trend line in the opposite direction of the trend line, and the straight line crosses the highest or lowest price of the recent period. These two lines run the price in the middle and have obvious pipe or channel shapes. Necessary for traders: tools and indicators Waves automatically calculate indicators, channel

This is a Semi-Automatic Martingale EA
It is Semi-Automatic because It waits for the first executed order available and then opens a grid of pending limit orders in the same direction of the first one The first order that we usually call the master trade can be opened manually or via any other EA, indipendent from this one There is a dedicated Telegram Group with use cases and best settings here , feel free to join and ask for a functional copy in demo accounts before buying
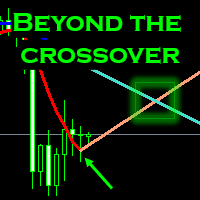
Do you want to anticipate to the crossover movements? Raise your change of success? With this program t he Crossovers can be anticipated before its appearance and thus get a better price. Developed a MA line that anticipated the crossovers and also it can be used for support and resistance level. Check in the backtesting and get the reversal at the beginning. Description MA beyond the crossover is an average price calculation over a certain time period causing a faster reaction be
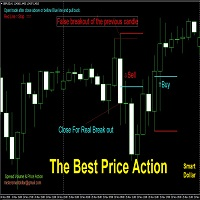
This price action is a very strong strategy, it is based on the fact that the price makes a false breakout of the previous candle and closes in the other side. which means that the area of the false breakout contains very powerful orders which push the price to turn in the other direction. the indicator helps you to choose the time frame for the price action and the minimum number of points for the area which is between the blue and red line. when the indicator gives an alert, it's time to wait
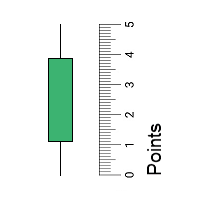
Индикатор отображает High-Low и Open-Close размеры свечей. Также по этим размерам можно построить простые скользящие средние. Линия скользящей средней строится по формуле: Линия MA = MA(Period) * Delta. Чтобы скрыть скользящую среднюю, достаточно установить ее период равным 0.
Чтобы собрать статистику по размерам свечей, используйте скрипт Candle Size Stats .
ПАРАМЕТРЫ Period_MA_HL: период усреднения скользящей средней, построенной по размерам High-Low свечей Delta_MA_HL: множитель для High-

Genetic Code, is an indicator that differentiates two types of market: the market in range and the market with volatility.
This indicator allows the trader to choose whether to use a range trade or a volatility trade. You can download the demo and test it yourself.
When observing the trace of the indicator it shows us narrow areas that correspond to market ranges.
These ranges always end with a volatility process, so you can work with two conditional pending orders.
When the two DNA strands
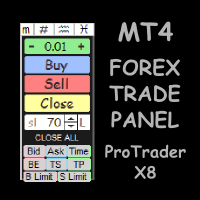
ProTrader X8 is a multifunctional trading utility for FOREX, MT4
Interactive and compact panel, it doesn't take up space on the screen, making it difficult to see the graph!
Developed exclusively for Forex traders, ideal for people who trade manually.
Note:
1 - This utility does not work in the strategy tester
2 - Try the demo version before buying unlimited ProTrader X8
Demo version → https://www.mql5.com/en/market/product/59012
ProTrader X8 functions:
• Buttons for buy, sell and close to

HAWA GOLD Advanced trading indicator with realistic pre-defined entry and exit levels with almost 80% win rate. The system focuses only Small and Steady Profits . It uses fixed stop loss for every signal to keep money management in place. As compare to other available indicators in market, HAWA gold has unique feature of displaying total profit and loss in terms of points where 1PIP=10points and Minimum profit is 10 pips. Its smart and advanced algorithm detects trend and trend strength usin
THIS ROBOT EA WITH INDICATOR ONE MA PLUS. Open order BUY = If Bid > MA1. Open order SELL = If Ask < MA1.
STRATEGY FROM ONE MA PLUS : - With Target profit perday (work on forward test). - with multi filter : maxspread,maxlot. - with multi takeprofit : include 4 step. - with multi stoploss : include 3 step.
PARAMETERS SETTING :
EA_Indicators=ONE MA VERSION;
Hedging=false;
Use_MaxSpread=true;
MaxSpread=50;
MaxLot=1;
Target_profit_perday=50;
lockprofit=2;//Minimal Profit in money
Step_LockPro
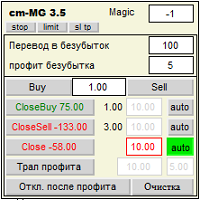
The expert Advisor helps you set a network of pending orders and collect profit from any price movement. You can use it to trade many grid strategies. You can also use it to track open positions.
"Buy Stop — - open a network of pending stop orders for sale "Sell Stop" - open a network of pending stop orders for purchase "Buy Limit" - open a network of pending limit orders for sale "Sell Limit" - open a network of pending limit orders for purchase "Close Buy" - button for closing the entire net

New Ea with indicator TWO MA PLUS. Open order BUY : If MA1 > MA2. Open order SELL : If MA1 < MA2. The advantages of EA TWO MA PLUS are: It is equipped with various filters, including: maxspread, maxlot, takeprofit, stop loss, profit target per day, and many more. Setting_Indicator TWO MA = Ma1_Period=14; Ma2_period=28; Ma_Mode=0; EA_indicators=TWO MA ; Hedging=false; ==> true/false Use_MaxSpread=true; MaxSpread=50; ==> Maximal Spread MaxLot=1; ==> Maximal lot Target_profit_perday=50; ==> can wo

introduzione L'esperto Forex Martingale Multi M4 per Meta trader 4 è un algoritmo basato sulla martingala dotato di segnali di trading basati sul modello di prezzo ipercomprato/ipervenduto dell'indice di forza relativa. La sicurezza è un must per un algoritmo martingala al fine di contrastare un completo wipeout nel miglior modo possibile, e ovviamente questo è incluso. È importante sottolineare e che l'utente comprenda che l'uso della martingala non è completamente esente da rischi e deve esser

This PORTFOLIO of 5 strategies has been developed, tested and traded live on USDJPY H4 TF. Multiple EAs traded together will lead to a bigger profits and smoother equity curve. 5 not correlated EAs logics for USDJPY H4 merged to a single strategy. Very SIMPLE STRATEGIES with only FEW PARAMETERS. Every trade has his own logic for STOP LOSS. To catch the profits every strategy uses different approach - some has TAKE PROFIT, some uses TIME BASED EXITS or PROFIT TRAILING. EA has been backtested o

This is MT4 version of StochScanner It scans Stochastic from Multi Symbols and Multi Timeframes and displayed on the dashboard on a single chart. . 4 scanning modes: 1. Mode OverBought/OverSold Indicator scans Overbought and OverSold . OverBought : current stochastic is above level 80 and OverSold : current stochastic is below level 20 2. Mode Signal It means if the previous stochastic is on OverBought or OverSold ( either Main Line and Signal Line ) and the current Main Line cross over the curr

MA bounce LITE arrows is simplified version of main indicator MA bounce . It's for people who don't need to use all features of main indicator. Lite version shows only arrows on chart when there is high probability of price bounce from selected MA.
MA bounce LITE arrows input settings: Current MA period - period of moving average on current TF Current MA type - moving average calculation method on current TF Current MA applied price - applied price of moving average on current TF
MA bounce LITE arrows is simplified version of main indicator MA bounce . It's for people who don't need to use all features of main indicator. Lite version shows only HTF line in short/long term opertion method.
MA bounce LITE htf line input settings: TD line source for calculation - choose if oscillators or price levels will be used as source for calculation TD line method (for oscillators source) - choose between long term and short term calculation Filter period (for oscillators source)

The RealCryptoLevels indicator by downloading the order book of crypt exchanges with maximum depth shows horizontal volumes of popular crypto currencies on the chart, so you can see not only the volumes, but also the levels and them strength (see screenshots), which is very important for successful trading in all strategies from scalping to medium-term trading, because you can see the preferences of buyers and sellers at the moment and their mood for the future. The indicator pulls volume dat

This robot EA with simple indicator ONE CANDLE, but this ea is equipped with various strategies, including: hedging technique (true / false), martingale technique (set 1 = off). also equipped with various filters, including: maxspread, maxlot, target profit per day, take profit with 4 layers, stop loss with 3 layers and many other strategies. Open order BUY = If iClose[1] > iOpen[1]. Open order SELL = If iClose[1] < iOpen[1]. EA_indicators=ONE CANDLE VERSION; Hedging=false; Use_MaxSpread=true;

Extensive research and testing went into building this EA and the best result has been programmed into the default setting. This is an Extremely Profitable EA that can be left running for months without interference. This EA uses common sense to beat the bank daily. Risk management is vital for successful trading and this EA makes it easy to manage your lot size to Equity ratio. The default setting makes one trade a day when the market makes its big move and trails the profit. This EA also has s
Il MetaTrader Market è l'unico negozio online dove è possibile scaricare la versione demo gratuita di un robot di trading che consente di effettuare test e ottimizzazioni utilizzando dati statistici.
Leggi la descrizione dell'applicazione e le recensioni di altri clienti, scaricala direttamente sul tuo terminale e prova un robot di trading prima di acquistarlo. Solo sul MetaTrader Market è possibile testare un'applicazione in modo assolutamente gratuito.
Ti stai perdendo delle opportunità di trading:
- App di trading gratuite
- Oltre 8.000 segnali per il copy trading
- Notizie economiche per esplorare i mercati finanziari
Registrazione
Accedi
Se non hai un account, registrati
Consenti l'uso dei cookie per accedere al sito MQL5.com.
Abilita le impostazioni necessarie nel browser, altrimenti non sarà possibile accedere.