Guarda i video tutorial del Market su YouTube
Come acquistare un Robot di Trading o un indicatore
Esegui il tuo EA
hosting virtuale
hosting virtuale
Prova un indicatore/robot di trading prima di acquistarlo
Vuoi guadagnare nel Market?
Come presentare un prodotto per venderlo con successo
Expert Advisors e Indicatori per MetaTrader 4 - 15

What is the Volume Weighted Average Price (VWAP)? The volume weighted average price (VWAP) is a trading benchmark used by traders that gives the average price an instrument has traded at throughout the day, based on both volume and price. It is important because it provides traders with insight into both the trend and value of the instrument.
What is the Difference between VWAP and AVWAP? While VWAP is having as starting point the beggining of the day,week,month etc. in the AVWAP you can pla

A simple but effective helper that will allow you to track both global and local market trends. The indicator combines the work of two oscillators: Stochastic and RSI. Both indicators can be set to any timeframe.
Advantages of Use Multitimeframe - you can adjust both indicators to the desired timeframes. To obtain the entry points, you can use the Elder's triple screen system. Highly customizable - you can configure not only the parameters of the indicators, but also their appearance (color an
FREE
Download the USDJPY free version here.
Scalping Strategy
BUY SELL
Having a strategy in the market is one of the main conditions for trading. The presence of various and complicated indicators and tools sometimes makes trading difficult, and the user gets confused after trying various methods and gets stuck in a loss cycle, the result of which is usually clear. This indicator is a simple strategy based on the detection of pivots and short-term trends, which helps you to easily trade i
FREE

The Breakout Indicator That Has Been Proven & Tested! Breakout Analyzer uses an advanced algorithm based on high probability price patterns. Each trade is analyzed on the statistics panel to help you evaluate the best breakout setups.
Bonus Strategy 1
Breakout Analyzer with Volume Critical Watch Video: (Click Here)
Bonus Strategy 2
Breakout Analyzer with Strength Meter
Watch Video: (Click Here)
Features Universal compatibility to different trading systems Analyzes statistics of breako
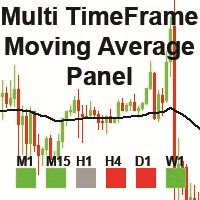
The "MTF Moving Average Panel" indicator is more of a helping tool than an indicator, it serves to help traders to spot the trend direction without having to change the timeframe and check all timeframes. It is best used with other indicators and signals, to help filter the signals according the trend based on multiple timeframes.
Indicator inputs : - Moving Average period : The period for the Moving Average. Default is set to 50 periods. - Moving Average method : The method of calculation of
FREE

Double Breakout is an automatic expert advisor with two separate strateges that uses martingale. The MACD indicator with adjustable parameters is used as inputs for each flow of orders. The specified takeprofit and stoploss levels are used to exit the position. General recommendation
The minimum recommended deposit is 1000 cents. Spread is recommended not more than 3 points. It is better to use trend currency pairs. The martingale parameter can be set from 0.1 to any value. When martingale
FREE

This indicator presents an alternative approach to identify Market Structure. The logic used is derived from learning material created by DaveTeaches (on X)
When quantifying Market Structure, it is common to use fractal highs and lows to identify "significant" swing pivots. When price closes through these pivots, we may identify a Market Structure Shift (MSS) for reversals or a Break of Structure (BOS) for continuations. The main difference with this "protected" logic is in how we determine

Oppure ( BD% ) che è un indice di volatilità che misura la volatilità in percentuale anziché in punti. L'idea di BD% è quella di creare un indice in base alla Classic Standard Deviation (CSD) che si sposta tra 0 e 100 percento.
È possibile utilizzare BD% per confrontare la volatilità per lo stesso titolo in diversi periodi di tempo o periodi di tempo diversi. Inoltre, puoi utilizzare BD% per confrontare la volatilità tra diversi titoli in diversi mercati in termini di percentuale anziché di p

This is a powerful system for binary options and intraday trading. The indicator neither repaints, nor changes its readings. Binary Reverse is designed to determine the points where the price reverses. The indicator fixes both reversals and roll-backs considerably expanding your analytical capabilities. It not only clearly shows correction and reversal points, but also tracks the overall trend dynamics.
Trading recommendations Coincidence of two signals (arrow and cross) is a strong entry sign

How the Indicator Works:
This is a Multi-timeframe MA multimeter indicator which studies if price is above or below a particular EMA range and shows Red/Green/Yellow signals. Red: Price Below EMA range Green: Price above range Yellow: Price within range
Indicator Properties:
EMA Settings: - Default Period is 200. You can change all MA Settings like Period, MA Method (SMA, EMA, etc) or MA Applied Price (Close, Open, etc).
- EMA Range list is a comma separated value list for different timefr
FREE

This indicator uses a different approach from the previous version to get it's trendlines. This method is derived from Orchard Forex, and the process of making the indicator is demonstrated in there video https://www.youtube.com/watch?v=mEaiurw56wY&t=1425s .
The basic idea behind this indicator is it draws a tangent line on the highest levels and lowest levels of the bars used for calculation, while ensuring that the lines don't intersect with the bars in review (alittle confusing? I kno
FREE
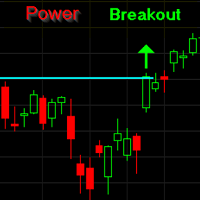
The Power Breaker Expert Advisor follows this trend-based breakout strategy for the day. This works based on the intelligent identification of the resistance and support on a specific time period combined with real time order management. This EA has smart risk management capability as the lot size is dynamic based on the margin available. This EA can work with a minimum investment as low as $100. It has a proven back testing record for last 2 years (result attached below) with great compounding
FREE

Candle Breakout EA is a trading tool for traders using the high and low breakout strategy of a previous candle. The EA waits till the price is higher than the previous candle's maximum or below the previous candle's minimum, and later opens a certain order (you can choose which type of order to open when the extremes are broken). This type of trading is well suited for classic strategies such as day trading on daily charts, breaking the morning candle on Monday, impulse trading, etc. The Expert

Robot CFO1.2EA is an innovative financial management system designed to optimize portfolio performance through the integration of contrarian, hedging, and grid techniques. Leveraging cutting-edge artificial intelligence algorithms, it provides sophisticated risk management and investment strategies tailored to meet the unique needs of your financial portfolio.
Robot CFO1.2EA employs a contrarian investment approach, capitalizing on market inefficiencies and deviations from the norm. It identif
FREE

Concept
Market arranges in Time upcoming Phases according to the present Results of its Interest. Directing Modulations are an Interaction of immanent Periods, which show in Reference to Time cyclic Activity and to Price leveling Activity. PointZero is a projecting Price Mask of this Concept of Time and Price and categorizing developed Price Movements related to their own Range: how far moved ? indicating their Status by marking special Events: when which Action ? setting the Situation in a fu
FREE

This trend scanner indicator is using two main indicators to identify trends. Frist the EMAs to provide a view on Bullish / Bearish momentum. When the shorter EMA (calculated off more recent price action) crosses, or is above, the slower moving EMA (calculated off a longer period of price action), it suggests that the market is in an uptrend. Second the Stochastic RSI, When RSI is < 20 it is considered oversold, and when > 80 it is overbought. These conditions suggests that momentum is very str
FREE
Strategy Master is a 5-in-1 EA, offering a choice of 5 distinct strategies within a single expert advisor. You can activate one to five strategies simultaneously and customize your trading by enabling or disabling filters to validate entries. These five strategies encompass a range of approaches, including three technical strategies (Moving Average, Bollinger Bands, and Ichimoku), a renowned price action strategy (Breakout), and a time-based strategy (SendOrder at Time). We understand that mar
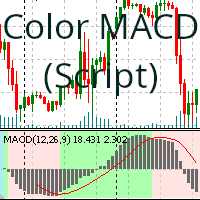
Un script (drag-and-drop) che colora lo sfondo dell'indicatore MACD in base alla tendenza di acquisto o di vendita.
I parametri che è possibile modificare sono gli stessi forniti dall'indicatore MACD di MetaTrader e, in aggiunta, quelli necessari per modificare i colori che si ritengono più appropriati in base alle proprie preferenze. I parametri che è possibile modificare sono i seguenti: Fast EMA Slow EMA MACD SMA Apply To Color Positive Trend Color Negative Trend
FREE

Make grid trading safe again | Built by a grid trader >> for grid traders.
Walkthrough Video <== Get Grid Rescue up and running in 5 minutes This is MT4 version, click here for BlueSwift GridRescue MT5 (settings and logics are same in both versions) BlueSwift Grid Rescue MT4 is a risk management utility EA (used together with other grid trading experts) that can help you trade aggressive grid systems with manageable drawdown, therefore reduce substanstially margin call risk as w

Trading with the help of the MACD indicator has become even more convenient. Flexible settings will help you choose what you really need in your trading. Use the strategy that you need - the indicator uses 3 strategies. Download the demo right now! I recommend watching my advisor - Night Zen EA Subscribe to my telegram channel, link in my profile contacts - my profile See also my other products on mql5.com - my products Advantages of the indicator: In this indicator, the interpretation of th
FREE

Volatility under control. The indicator shows the optimal depth for setting goals within the day and on the average trend. It also builds pivot zones for the estimated correction depth. As an accompaniment, the key levels of the structure are displayed for several timeframes. Classical volatility indicators ATR & ADX on fixed timeframes are used for calculation. The calculation takes into account the spread, and if the market is slightly volatile, you will see a warning about the risk. You can c
FREE

Best price, read GS smart channel ! 3 copies left for $185. Next price --> $250 Traders who purchase GS smart receive a personal bonus. After purchase contact me for assistance GS smart is 3 in 1 = Superior Grid Expert Advisor + News feed + Trend indicator. (for MT5: GS smart5 ) You don't need to follow the trend, the EA uses the trend indicator in the trading algorithm. Automatically adjusts its parameters to work on any Forex instrument (including cryptocurrencies, indices and CFDs) for USD

This indicator helps you to scan symbols which are in the Market Watch window and filter out a trend according to RSI.
The relative strength index (RSI) is a technical indicator used in the analysis of financial markets. It is intended to chart the current and historical strength or weakness of a stock or market based on the closing prices of a recent trading period. The indicator should not be confused with relative strength. The RSI is classified as a momentum oscillator, measuring the veloc
FREE
This indicator copies graphical objects (vertical lines, horizontal lines, text labels, fibo and etc.) from master chart to other charts.
For example, you can copy lines from the chart GBPUSD with period H1 to chart GBPUSD with period M15. It's makes technical analyses more simple. Show label - show label on the Master chart, where you draw graphical objects to copy; Font size - font size of label; Type of synchronisation - type of synchronisation Copy text - on/off copy of text objects
Copy
FREE
MACD Trend EA is based on the popular forex indicator MACD (Moving Average Convergence Divergence). It is fully automated trading expert advisor and completely FREE! As the name suggests, this expert advisor uses a trend-following strategy and uses the MACD indicator to detect the beginning of uptrends and downtrends.
MACD Trend EA Top Features - Trend Following Strategy - Money Management - Advanced Exit System + TP and SL - Trailing Stop System - Broker protection System - Custom Magic
FREE

GTAS S-Trend is a momentum indicator that helps to determine trends using combination of MACD, RSI and moving averages. This indicator was created by Bernard Prats Desclaux, proprietary trader and ex-hedge fund manager, founder of E-Winvest.
Description The indicator oscillates between -65 and +65 with a neutral zone between -25 and +25 around a 0 equilibrium line. S-Trend between -25 and +25 indicates congestion zones with a bullish bias between 0 and +25, and a bearish bias between 0 and -25
FREE
Download the free version here.
A Full Concept of BUY/SELL Scalping Strategy Trend detection is one of the basic challenges of every trader. Finding a way to tell when to enter a trade is very important, timing is a game changer, not too early and not too late. Sometimes, due to not knowing the market conditions, the trader closes his positions with a small profit or allows the losses to grow, these are the mistakes that novice traders make. Indicator Trend Whipper is a complete trading st
FREE

The Pioneer Of Trend Detection! A Powerful Indicator That Avoids Whipsaws And Uncertain Market Noise. Functions mainly as a filter to help you trade in the direction of the trend. It works in any pair or timeframe.
Features Advanced trend detection software using complex algorithms that can be used as the supporting tool or system. Unique trend detection that avoids whipsaws and uncertain market noise Analyzes statistics of maximum profits and calculates possible targets for the next signal Fl
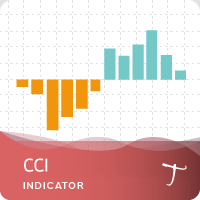
28 symbols, multi-time frame powerful Dashboard for the full market view Customizable Buy/Sell alerts, push alerts, email alerts, and visual on-screen alerts. Marked buy/sell signals Two color trend histogram. The commodity channel index (CCI) is an oscillator originally introduced by Donald Lambert in 1980. CCI measures current price level relative to an average price level over a given period of time. CCI is high when prices are above the average price, and low when the prices are below the a
FREE

The Multi Trendlines indicator automatically draws the dominant trendlines on the current chart. The indicator looks for the 5 best Up trends and the 5 best Down trends as at the current price, drawing each trendline if filter conditions are met. The trendlines are named "Trendline"+[Direction]+Symbol()+TrendlineSequenceNumber For example: The second Up trendline on a EURUSD chart would be named "TrendlineUpEURUSD2". To get its current value would be: ObjectGet("TrendlineUpEURUSD2",OBJPROP_PRI
FREE

Versione MT5 | Indicatore Valable ZigZag | FAQ La teoria delle onde di Elliott è un'interpretazione dei processi dei mercati finanziari che si basa sul modello visivo delle onde sui grafici dei prezzi. Secondo questa teoria, possiamo sapere esattamente quale tendenza sta prevalendo sul mercato, ascendente o discendente. L'indicatore Valable ZigZag mostra la struttura a onde del mercato e indica la direzione del trend principale al momento sul timeframe corrente. Per comodità, l'indicatore Tr

There are only a limited number of copies left, priced at 390 USD . After that, the price will be raised to 500 USD. All backtests were done with a modelling quality of 99.90%. The EA can trade on 7 currency pairs. To trade, you will need an ECN, RAW, STP or NDD account, which charges commissions and fees but gives a small spread. To trade you need the correct name of the currency pair without prefix and suffix and extra dot, otherwise you need to change the name of the currency pair in the

In FX, signals from doji patterns can be effective in capturing potential trend developments. Therefore, setting pending orders simultaneously after the appearance of a doji can make it easier to capture the onset of a trend.
Setting stop-loss (SL) and take-profit (TP) levels more widely can enhance the probability of success, but it also increases the associated risk.
In the event of a loss, it is possible to recover by increasing the next position size through multi-lot trading, but this
FREE

This indicator is suitable for trading Forex and Binary Options, depending on its settings. The indicator is designed for trend trading. A buy signal: An up arrow appears on the chart. A sell signal: A down arrow appears on the chart.
Input parameters === Setup CCI === Period CCI 1 - Period of the CCI Period CCI 2 - Period of the CCI Level BUY - Level of the CCI for buying Level SELL - Level of the CCI for selling === Setup RSI === Level SELL - Level of the RSI for selling Period SELL - Period
FREE

MACD (short for Moving Average Convergence/Divergence) is one of the most famous and oldest indicators ever created and is widely used among beginners . However, there is a newer version of the MACD that is named Impulse MACD which have less false signals than the standard MACD. Classic MACD helps us to identify potential trends by displaying crossovers between two lines. If MACD line crosses above the Signal line it shows us that the market is potentially up trending and that it would be a go

zGold is an Expert Advisor built, designed and configured to be used with Gold/XAUUSD . The system uses custom Trend algorithms to find key entry points into the market and executes them once the right criteria is met and it uses a mixture of Indicators and Price Action. The Expert Advisor also has a custom filtering algorithm to disregard false signals and work around possible market reversals. To combat spread related issues the closing strategy is based around account profits, totals and cur
FREE

This indicator evaluates the market sentiment using raw price action measurements, and it is an amazing trading confirmation. It can be used to take a trend-trade approach or a contrarian approach using reversal patterns. [ Installation Guide | Update Guide | Troubleshooting | FAQ | All Products ] Find early reversals Confirm short-term trades Detect indecision on the market Take contrarian trades near support and resistance levels Trade inside bars confirmed by overall direction of the market T
FREE

This expert advisor implements the original Dennis and Eckhardt trading system, commonly known as The Turtle Trader. It trades exactly like the original turtles did, and can be used by experienced traders to capture trends in up or down markets. [ Installation Guide | Update Guide | Troubleshooting | FAQ | All Products ] Easy to use and supervise Fully configurable strategy settings Fully configurable trading settings Works for ECN/Non-ECN brokers and 2-3-4-5 digit symbols Works for CFDs and for
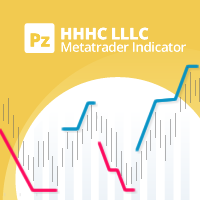
A personal implementation of a famous trend principle known as higher high, higher close, lower low, lower close (HHHC - HHHL). It uses price action alone to determine trend direction, trend changes and pullback zones. [ Installation Guide | Update Guide | Troubleshooting | FAQ | All Products ] Customizable breakout period Customizable colors and sizes It is non-repainting and non-backpainting It implements alerts of all kinds The indicator defines three price zones: Buy zones are blue Sell zon
FREE

BeST_Gann Swing Oscillator is an MT4 indicator that is based on the corresponding work of Robert Krausz who introduced it in the book “ A.W.D Gann Treasure Discovered ” .
The Gann Swing Oscillator is a range-bounding technical indicator that oscillates between +1 and -1 and thus it describes the market swings.
Generally when the market is in an upswing, the Gann Swing Oscillator describes it as 2 higher highs with the value of +1 while after an upswing, the downswing is expected.
Also the do

R Chimp Scalper è un eccellente strumento di trading per speculatori forex e day trader.
I segnali di questo indicatore di scalping sono molto chiari e facili da leggere.
Disegna barre verdi e rosse sopra e sotto il livello zero in finestre di trading separate: Le barre verdi si allineano sopra il livello zero, indicando una tendenza speculativa rialzista. Le barre rosse si allineano sotto lo zero, indicando una tendenza al ribasso dello scalping. Le letture degli indicatori al di sopra del
FREE
Counterattack EA is a fully automatic Grid Expert Advisor for Trend Scalping Trading on XAUUSD timeframe M1 but also in others.
Recommendations The Expert is programmed to work on XAUUSD M1, but you can use all others timeframes also. An ECN broker is always recommended A low latency VPS is always recommended. The recommended Leverage is 1:100 or more. The recommended capital is 10000 ($/cent) per 0.01 Lots or more. For higher Lots please test by yourself Please test Demo before you
FREE

The elite (V3) multi-indicator suite from JoaquinTrading specifically geared towards Forex & binary options, including regulated exchanges such Nadex, Cantor Exchange, and other binary option brokers.
The Probability Tool Suite Elite will provide the given win/loss outcome probabilities of up to 10 strike levels, a specific expiration duration, based on a combination of up to 16 indicators, rules, or conditions and derivative behavior (i.e. expiry, touch, touch & retrace). Using this indicat

Big summer sale. Save up to 40% on my products. Supply & Demand dashboard - save 10$! The Netsrac Supply&Demand Dashboard shows you at a glance where relevant zones are located on your favorite assets. Open your chart directly from the dashboard and trade zones that really matter. Features
Finds the next relevant supply and demand zone and displays the distance to this zone (in pips) Finds and displays the zones in three different timeframes Calculates a trend indicator for the current and past

Friends, we present to your attention our new Forex Gump Laser indicator. Since there are no designers in our team, but mainly mathematicians, financiers, programmers and traders, we did not make any special changes in the indicator design. In appearance, it resembles the usual Forex Gump. On the other hand, Forex Gump has become not just the name of an indicator, it is a brand. And we try to preserve the corporate identity in all its varieties. The whole essence of the indicator in its operatio

Leo Trend is a signal indicator that shows the market entry points, as well as the trend direction and flat on the chart in the form of arrows and lines. Leo Trend will be useful both for beginners creating a trading strategy, and for professionals to integrate into ready-made trading systems. Leo Trend works without redrawing and without significant delays. The operation of the indicator is demonstrated in the video. In addition, you can test this indicator in the strategy tester free of charge
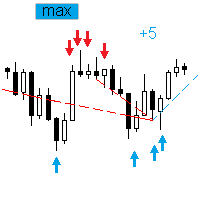
The Expert Advisor trades the signals from an artificial neural network with one hidden layer. Presence of a signal is checked at the closing of the specified period. MAIN PARAMETERS Net option - setting the order grid. When placing a market (not pending, Pending order offset=0 ) order according to a signal, the grid order is set. The following direction are available: follow the trend , against the treand and both directions . The number of placed orders is taken from the ...maximum deals with
The IT Moving RSI EA is a cutting-edge tool designed to empower traders with deep insights into market trends and price movements. This expert advisor is a powerful ally for both novice and experienced traders, offering the ability to make well-informed decisions by harnessing the combined power of moving averages and the Relative Strength Index (RSI). Whether you are starting your trading journey or are a seasoned trader, this EA is a must-have addition to your trading arsenal. Join our telegr
FREE

RSI Signal Scanner The primary trend of the stock or asset is an important tool in making sure the indicator's readings are properly understood. For example, some of the technical analysts, have promoted the idea that an oversold reading on the RSI in an uptrend is likely much higher than 30%, and an overbought reading on the RSI during a downtrend is much lower than the 70% level. This indicator notifies you of RSI important levels breakouts (30% and 70%) by searching among the symbols and chec
FREE

The Point61 indicator is the result of many years of monitoring of price behavior of currency pairs and metals.
It is not a secret, that in times of uncertainty, traders are looking for possible levels of support and resistance - the point, where price should stop its movement.
There are 2 possible scenarios at these points:
1. Reverse (correction) to the opposite direction;
2. Breakthrough to continue movement. Very often these points are used to set stop orders - TakeProfit or
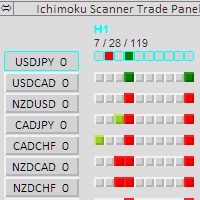
This scanner is a tool used to support trading with the Ichimoku method. Its basic features are: 10 trading setups implemented in accordance with the Ichimoku technique, the possibility of simultaneous scanning, all financial instruments available on the platform, the possibility of simultaneous scanning, in all timeframes available on the platform, available Manual and Auto trade , the ability to open in Manual mode from the level of the chart, the ability to determine the size of the position

Overview
The Volume SuperTrend AI is an advanced technical indicator used to predict trends in price movements by utilizing a combination of traditional SuperTrend calculation and AI techniques, particularly the k-nearest neighbors (KNN) algorithm.
The Volume SuperTrend AI is designed to provide traders with insights into potential market trends, using both volume-weighted moving averages (VWMA) and the k-nearest neighbors (KNN) algorithm. By combining these approaches, the indicat

A powerful trend analysis tool for traders of all levels Super Trend Analyzer is a technical analysis tool that uses the Relative Strength Index (RSI) and Moving Average (MA) indicators to identify trends in the market. It is a versatile tool that can be used by traders of all levels of experience.
How does it work An uptrend begins when the main trend line and the auxiliary trend line cross from below and the lower minor oscillator is on the rise. A downtrend begins when the main trend line a
FREE

Lisek Stochastic oscillator indicator with Alarm, Push Notifications and e-mail Notifications. The Stochastic indicator is a momentum indicator that shows you how strong or weak the current trend is. It helps you identify overbought and oversold market conditions within a trend. The Stochastic indicator is lagging indicator, which means it don't predict where price is going, it is only providing data on where price has been !!!
How to trade with Stochastic indicator: Trend following: As lon
FREE

The MT4 indicator that we are describing is designed to provide traders with an alert, notification, and email when Fibonacci levels are crossed. The Fibonacci levels are calculated based on the zigzag indicator, which helps to identify potential trend reversals in the market. When the indicator detects that a price has crossed a Fibonacci level, it will trigger an alert and send a notification to the trader's MT4 mobile app. Additionally, the indicator can be configured to send an email to the
FREE

Slope Trend Robot is the Expert Advisors trading with a combination of multiple strategy trading algorithms (Trend, Level Trading, and Money Management with Martingale recovery loss to profitable).
The Trading algorithms. 1. Follow trends with Indicators is Moving average and Envelopes. 2. Open order two ways that trading both BUY and SELL. 3. Open orders with distance. 4. Close order follow indicator's signal with a profit.
How to work? Open BUY When Moving Average Cross Above Envelopes

Diversify the risk in your trading account by combining our Expert Advisors. Build your own custom trading system here: Simple Forex Trading Strategies
The expert advisor opens trades when the SMA and RSI are aligned in the same direction and when the Stochastic has left overbought/oversold areas. The 5 and 10 SMA are also programmed to close the trades if the trend changes. The Stop Loss, Take Profit, and Trailing Stop are calculated based on the ATR indicator. The recommended currency pai
FREE
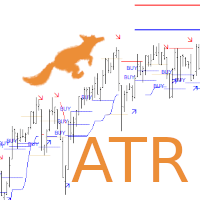
Are you looking for ATR Levels, ATR Trend, ATR Support and Resistance Indicators ? Now you have all in one !!! Info on your chart is showing you: where current price and levels are, what is current trend and signals. Search for an entry with low risk for trading by Lisek ATR Indicator. There are many ways to trade with Lisek ATR Indicator: Trade Support and Resistance Levels. Trade pullbacks (Range trading). Trade breakouts. Trade reversals. Take profit or set stop-loss based on ATR Levels.
FREE

L'Expert Advisor è progettato per il trading aggressivo. L'Expert Advisor dispone di nuovi metodi per determinare la direzione del trend. L'EA commercia con un profitto minimo su un sistema senza perdite, controllando ogni operazione.
Canale Telegram della nostra community - https://t.me/EAQuantumLab Istruzioni dettagliate per il consulente sono disponibili al collegamento https://eaquantumlab.com I segnali reali sono disponibili qui: https://www.mql5.com/en/users/vitalvasa/seller
C

[75% OFF! - SALE ENDS SOON] - RevCan Trend Entry Point is a trend based trade alert indicator for serious traders. It does all the price and chart analysis all by itself, and whenever it finds any potential high quality trading opportunity(Buy or Sell) using its revolutionized price prediction algorithms, it sends instant trade alert directly on the chart, MT4 terminal and on the mobile device. The trade signals will be visible on the chart as Up and Down arrows, while the instant audible aler

VR Cub è un indicatore per ottenere punti di ingresso di alta qualità. L'indicatore è stato sviluppato per facilitare i calcoli matematici e semplificare la ricerca dei punti di ingresso in una posizione. La strategia di trading per la quale è stato scritto l'indicatore ha dimostrato la sua efficacia per molti anni. La semplicità della strategia di trading è il suo grande vantaggio, che consente anche ai trader alle prime armi di commerciare con successo con essa. VR Cub calcola i punti di apert

This tools is design to easily forecast the projection of the current trend through the inputs of Zigzag and get out of the market when the trend do not the ability to maintain it's volatility to go further... the indicator gets the initial and final price from the value of zigzag automatically by adjusting the intdepth of zigzag. You can also switch from Projection to Extension from the inputs tab of indicator.
FREE

This is an unconventional version of the Heiken Ashi Smoothed indicator implemented as lines rather than a histogram. Unlike a usual histogram, the indicator draws the readings of the two moving averages in the form of colored lines.
Example If the candle crosses two indicator lines upwards, a trend is assumed to be changing from bearish to bullish. If the candle crosses two indicator lines downwards, a trend is assumed to be changing from bullish to bearish. The indicator is good at displayin
FREE

The trend in the market can be predicted using trend lines but the problem is you don’t know where exactly the price is going to touch the trend line where you can put your pending orders on. Smart Channel Expert Advisor makes it possible to put an advanced channel around the price data, which can be configured to handle placing orders, opening and closing positions, managing risk per trade, spread, slippage, and trailing stop-loss and take-profit automatically. Features Money Management (Calcul
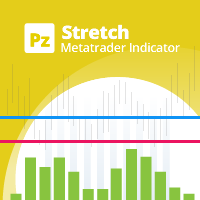
The Stretch is a Toby Crabel price pattern which represents the minimum average price movement/deviation from the open price during a period of time, and is used to calculate two breakout levels for every single trading day. It is calculated by taking the 10 period SMA of the absolute difference between the open and either the high or low, whichever difference is smaller. This value is used to calculate breakout thresholds for the current trading session, which are displayed in the indicator as
FREE

The Investment Castle Chances indicator will show signals on the chart for entering a buy or sell trade. There are 2 types of signals for each direction as follows: Buy / Sell (Orange colored candlesticks) Strong Buy (Green colored candlesticks) / Strong Sell (Red colored candlesticks) You may place a buy trade once you see the Buy arrow or vise versa, or you might prefer to wait for a further confirmation “Strong Buy” / “Strong Sell”. This indicator works best with the high time frames H1, H
FREE

I recommend you to read the product's blog (manual) from start to end so that it is clear from the beginning what the indicator offers. This multi time frame and multi symbol indicator identifies double top/bottom, head & shoulders, pennant/triangle and flag patterns. It is also possible to setup alerts only when a neckline/triangle/flagpole breakout has occured (neckline breakout = confirmed signal for top/bottoms and head & shoulders). The indicator can also be used in single chart mode.
if you want more information please pm me
HI guys this my developing indicator 1st version alert logic work well.. this indicator using can you stronger currency and top weaker currency find well,this;s indicator multy MTF time frame strength work.very good for SL trend screener intraday trader and long time trader, very easily can you watch stronger and weaker index.I hope to more improve this future further,thank you

Please feel free to contact me if you need any further information.
Please let me know if you have any questions.
I hope the above is useful to you. MT MERIT PullBack : It is an indicator created to find pullback signals filter trend. Use a complex method to find signals.
Suitable for short-term profit, able to make profit in many cycles. Suitable for people who trade by yourself, do not use with ea (non auto trade)
manage risk management by yourself (Stop Loss,TP, Risk Reward, ...)
and

Starlink EA is a multi-functional expert advisor for the MetaTrader 4 terminals. The algorithm of the expert advisor allows you to trade both with the trend and against the trend. Trading with the trend is structured in such a way that each new order is opened only if the previous order has a Stop Loss in the profit zone. Trading against the trend is conducted in order to close unprofitable positions with a profit. The advisor has a large number of settings that allow you to conduct conser
MetaTrader Market - i robot di trading e gli indicatori tecnici per trader sono disponibili nel tuo terminale di trading.
Il sistema di pagamento MQL5.community è disponibile per tutti gli utenti registrati sul sito MQL5.com che effettuano transazioni su MetaTrader Services. Puoi depositare e prelevare denaro usando WebMoney, PayPal o una carta di credito.
Ti stai perdendo delle opportunità di trading:
- App di trading gratuite
- Oltre 8.000 segnali per il copy trading
- Notizie economiche per esplorare i mercati finanziari
Registrazione
Accedi
Se non hai un account, registrati
Consenti l'uso dei cookie per accedere al sito MQL5.com.
Abilita le impostazioni necessarie nel browser, altrimenti non sarà possibile accedere.