Guarda i video tutorial del Market su YouTube
Come acquistare un Robot di Trading o un indicatore
Esegui il tuo EA
hosting virtuale
hosting virtuale
Prova un indicatore/robot di trading prima di acquistarlo
Vuoi guadagnare nel Market?
Come presentare un prodotto per venderlo con successo
Expert Advisors e Indicatori per MetaTrader 4 - 103

This is a multi timeframe indicator to show the direction of the trend in multiple timeframes. The calculations are based on some original indicators but with special settings that is working for years and in combination with some newer indicator formulas. The indicator has multiple arrows based on various timeframe signals so that user can clearly see which signal is for which timeframe. Also draws horizontal lines with different thickness settings and colors from various latest signals so that

The Market Maker indicator focuses on key levels as minimum, maximum, opening and closing of important time frames. An attentive observation of these levels will enable you to identify the proper direction of the trend. On these levels the Market Makers try to make a very hunt of Stop Loss. We recommend to use Daily values on H1 chart, Weekly values on H4 chart and Monthly values on D1 charts. Use it setting all three time frames on the same chart and you will see that these levels will be a gre

Gets is a smart trading system with complex market analysis mechanism. The operation principle of Gets is based on neural networks and diversified collection of information from various market analyzers. Then the system analyzes the statistical databases to create a general idea of the current market situation and the further price movement. The information is displayed on the screen in a simple and intuitive way - in the form of buy and sell arrows. Also, the information on the current trend st

Headstrong Expert Advisor is a trend scalper that uses the standard indicators such as Bbands, RSI, ADX, and Moving Averages. It has been developed for trade on EURUSD and USDJPY on M5 time frame. The strategy is simple: open sell trade in overbought zone when the trend is down, and vice versa open buy trade in oversold zone when the trend is up. The closing of trade is done by Take profit (in pips) or by ADX+RSI (stop loss is deliberately higher). Headstrong does not use dangerous strategies li

This Expert Advisor identifies trend reversals based on fractals and some other indicators. If the fractals were formed after a prolonged fall, and the last fractal did not update the minimum of the previous bar's lower fractal, then a trend reversal is determined (at the same time, there must be a fractal in the middle, which is higher than the others). In case other indicators allow trading, a trade is performed (their settings can be customized for optimization).
Input parameters Lots - lot
MMM Keltner Channels EA strategy: The robot uses its built in Keltner Channels indicator all the time and does a calculation to determine the prices trends. If it indicates the price will be bullish, it sends a buy order. If the indicator indicates the price will be bearish, it sends a sell order; It will not send an order unless the calculations determines a good trend of profit; Like all MMM products it is also programmed to minimize your losses and protect your money from the hostile market.

MArketwave is a multicurrency, trend following indicator which combines three of the most commonly used parameters. Parameters Moving Averages Bollinger Bands Stochastic Oscillator The parameters have been customized to provide accurate signals. Signals Thick dark green up arrows - Uptrend Thin light green up arrows - Buy Thick red down arrow - Downtrend Thin red down arrow - Sell Trading tips Check the trend with thick arrows Buy or sell with thin arrows only in the direction of the main trend
The indicator analyzes the direction of the short- and long-term trend over the given periods taking into account market volatility. This approach allows combining high sensitivity of the indicator with a high probability of its signals.
The indicator use principle is very simple: indicator histogram above 0 is a buy signal; indicator histogram below 0 is a sell signal; The indicator is not redrawn on completed bars. This indicator is designed for trading pending orders. Thus, the confirmation

ThreeVS3 is a unique and high quality indicator. It is also a effective and understandable trading tool. The operation concept is on a score basis, which is ranged from -3 to +3. Thus, you can just according to the score to do the trade easily.
How the Score calculated? The Score is calculated by 3 set of formulas. Each of them represent Long term, Short term, and entry level respectively.
How to understand the Score? The Positive sign means favor for long position, and Negative sign means f

SolaceSystem is a trend scalper. The Expert Advisor algorithm calculates price consolidation levels and opens trades if a strong market movement is expected. The Parabolic SAR standard indicator is used to filter trade opening.
Distinctive features Martingale is not used. Does not accumulate loss. Uses take profit and stop loss. Trades are closed either by TP and SL, or using a unique trailing stop algorithm. Automatic lot calculation. The Expert Advisor is fully ready for long-term automated
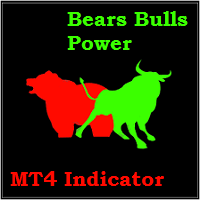
This indicator works on any financial instruments and time periods. The indicator contains only one parameter: nBars - number of bars for histogram's value calculation. If a Green pole rises from a Red pole above the zero line then a Long position may be opened. If a Red pole rises from a Green pole under the zero line then a Short position may be opened. The height of the each pole represents the Power of an Up/Down movement. The transition from Red to Green (and vice versa) shows change of tre

Moving band is a trend based, custom indicator which combines multiple Moving Averages and Bollinger Band .
Features Trend based Indicator Does not repaint No False Signals Works on all Time Frames Applicable on Forex, Indices and Stocks
Input Parameters Show Indicator after Testing : True/False Sound an alert : True/False Send an email : True/False Send a notification : True/False Signals The signals are generated with intersection of multiple Moving Averages with mid Bollinger Band Buy whe

The indicator identifies the most suitable moment for entering the market in terms of market volatility, when the market has the strength to move (the signal is indicated by an arrow under the candle). For each of the signals, the presence of trends on the current and higher timeframes is determined, so that the signal is in the direction of the majority of positions opened on the market (denoted near the signal by abbreviations of timeframes with a trend present). The signal appears after the c

Moving Clouds EA is a multicurrency, trend based Expert Advisor which works with two moving averages and the Ichimoku cloud . Moving Clouds EA derives its signal by the following method: Buy Signal : By intersection of Moving Averages with the Ichimoku Cloud from below upwards. Sell Signal : By intersection of Moving Averages with the Ichimoku Cloud from above downwards.
Input Parameters Settings for Ichimoku : Time Frame - Ichimoku's Time Frame. Senkou Span A - Value for Senkou Span A. Senkou

Ichimotor is a trend based, custom indicator which combines the Ichimoku Cloud and Alligator
Features Trend based Indicator Does not repaint No False signals Works on all timeframe Applicable on Forex, Indices and Stocks
Input Parameters Show Indicator after Testing : True/False Sound an alert : True/False Send an email : True/False Send a notification : True/False
Signals The signals are generated when there is intersection of the Alligator with the Ichimoku Cloud Thick green Up arrows -

Trend CruiserGT (for CAD/CHF) It is a swing trading system that trades on CAD/CHF currency pair on 4-hrly chart . The EA is custom designed to take advantage of the start of rising Canadian dollar in 2017, after seeing over 7 year period of downtrend against the Swiss Franc (CHF). The design of the EA have taken consideration of fundamental analysis over last several quarters for the CAD and CHF counterparts, and analyzing the multi-year chart pattern of this pair. The strategy will take full ad
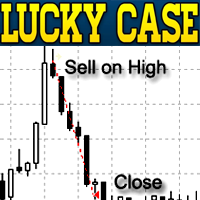
LuckyCase is an Expert Advisor with martingale elements. The EA strategy is based on a significant "deviation" of the price from SAR inadicator and the Bands levels breakthrough point. The money management system is an essential part of the EA. It starts working after a trade is opened. Trades are closed after accumulating specified points of market orders, by deposit % or after an opposite side of the channel is broken through. The default EA settings are meant for: EURUSD M15; USDJPY M15. The
Buy Wait Sell Trigger is very easy to read and use. The one and only indicator's line (color Aqua) can be equal to a zero-line or plus/minus one-line. The zero line is characterizing the flat trend. It means that you should wait. The V-shaped impulse indicates the entrance to the opposite direction. The U-shaped impulse indicates entry orders in the same direction. If the indicator line resizes on the plus one-line, you may go Long. If the indicator line resizes on the minus one-line, you may go

The price is moving between two curve tunnel lines in a trend. The two lines of a tunnel represent support and resistance. In an uptrend, for instance, a trade might be entered at the support of the trend line (shown by the red line in the chart) and exited at resistance of the upper tunnel line (shown by the blue line). Tunnel show trend direction for any timeframe (if you have enough bars on the chart for higher timeframes). Trend, or price tunnel, can be up, down or sideways. If the current p
MACD MTF Signal is an indicator for understanding a trend reversal in any market . It is calculated using the MACD Histogram, which results from the difference between MACD and Signal Line. The strength of MACD MTF Signal is the ability to see more time frames at the same time if they are greater than the one displayed on the chart. In this way it is possible to understand a convergence of ascent or descent on several time frames, which means a strong push in one direction or the other. Another

Parabolic SAR is one of the most popular indicators allowing you to determine in a timely manner the trend reversal, get an early entry point and accurately define the place of profit taking. Parabolic SAR is very efficient in case of a trendy market but often gives false signals during a flat. In order to sort such signals out, it is possible to use the same indicator on higher timeframes. This eliminates the main drawback of the indicator during a flat, while retaining its advantage of early e

This is a fully automated Expert Advisor that does not require stopping during the news release. Trade is conducted by the trend determined by the indicator Ichimoku. Opening the orders occurs near the support (resistance) levels and in presence of the confirmation signals from other indicators. The EA does not require ECN accounts. It works on 4- and 5-digit quotes. The type of quotes is determined automatically. The timeframe of the chart does not matter. The default settings are optimized for

EPriceJPY is a auto-trading EA focused on USDJPY.
Trading Concept The operation concept of EPriceJPY is based on an algorithm that tries to determine the Trend. To be more specific, EPriceJPY works with its own calculation logic based on simulation. It is trying to find out the Top or Bottom in a Trend, and open the Short or Long Position accordingly. Don't expect EPriceJPY to open the trade on the highest or lowest level, because EPriceJPY will trade only when the Top/Bottom can be confirmed.

CHF Portal is designed for Trading USDCHF specifically.
Trading Concept The operation concept of CHF Portal is based on an algorithm which tries to determine the Trend. To be more specific, CHF Portal works with its own calculation logic according to historical volatility and price movement. It is trying to find out the Top or Bottom in a Trend, and open the Short or Long Position accordingly. Don't expect CHF Portal can be able to open the trade on the highest or lowest level, because CHF Por

Trading Machine is an Expert Advisor (Robot) for any financial instrument on the MetaTrader 4 platform. All input parameters are optimized for EURUSD M1 . Of course, you are able to optimize these parameters for any currency pairs and timeframe. The main input parameters are A, B, C, D, and E , which can be any positive numbers. These are input parameters (weight coefficients) of the one layer neural network. The EA checks for a new trend and opens a position accordingly. If a trend changes its

Fenrir is a fully automated quantitative swing trend follower EA. It trades Forex pairs using an adaptive market neutral multi-strategy neural network. It is scalable, and can manage SL and TP for orders opened by concurrent EAs on the same product (so called wolfpack mode ), so that the user can add third party logic. The multi strategy structure reserves all magic numbers in the range of x666xxx, and can manage order injection from other EAs. To work in wolfpack mode , just set any other EA to

This indicator displays the trend movements.
Parameters Trend: Displays the trend movements, true/false. X: moves the trend left and right. Y: moves the trend up and down. How to understand the status: (M1), square indicates the timeframe for 1 minute. If the square is green, trend is up. If the square is red, trend is down. (M5), square indicates the timeframe for 5 minute. If the square is green, trend is up. If the square is red, trend is down. (M15), square indicates the timeframe for 15 m

Steed is a trend-following multicurrency Expert Advisor, intended for long-term and safe investment. The strategy is based on the analysis of statistics of currency pair movements, as well as the correlation between te underlying currencies of the currency pair the EA is trading. Decision on each specific entry is made through technical analysis, while considering the data from different timeframes. It is necessary to understand that periods (weeks or months) of drawdown or operation with zero p

The Predicting Donchian Channel indicator allows predicting the future changes in the levels of the Donchian channel based on the channel position of the price. The standard ZigZag indicator starts drawing its ray in 99% of the time the opposite Donchian channel is touched. The forecast of the channel boundary levels will help in finding the points, where the correction ends or the trend changes, an also to estimate how soon those events can occur.
Configurations Period - Donchian channel calc

EW Oscillator PRO is an indicator for MetaTrader 4 based on mathematical calculations on the price chart. This is one of the most common and useful indicators for finding the trend reversal points. EW Oscillator PRO is equipped with multiple types of notification (push notifications, emails, alerts), which allows opening trades in time. A panel for displaying the information on the indicator signals from different timeframes is located in the top left corner (see screenshot #2).
Distinctive fe

This utility is designed for testing the signal indicators (arrow or trend based). This utility allows quickly evaluating the efficiency of an indicator. To use this utility correctly, enter the exact name of your indicator in name_indicators. Then set filter 1 or 2, depending on the bar, where the order should be opened. Next, set the number of the buffer for buying and selling, set take profit and stop loss. The indicator is ready to be tested. This utility can be used in live trading as well.

The Magneto Volume Trigger indicator is designed for determining the volume confirmed by the candlestick pattern and predicting the trend tendency.
Indicator setup and use The calculation of values is affected by two parameters - Period and Gate . The lower the value of Gate , the higher the sensitivity of the indicator. Period allows making a sample of data for the specified number of candles. The lower the value of Period , the more the indicator is adapted to the current market conditions.

The Expert Advisor trades two strategies, each designed for a particular market behavior. Using both strategies allows you to cover a significant range of trading time and get high and stable results. The Channel strategy is based on the principle of scalping within the channel bounds, during periods of low volatility. Trend strategy builds on the principle of following the trend in during the high volatility hours. The trading periods are selected based on the statistical and fundamental analys

This Expert Advisor implements elements of the Martingale system. Orders are opened at a specified distance from the moving average. The Parabolic SAR indicator and certain technical details are used to ensure the most accurate entries. The EA is highly customizable. It is recommended for simultaneous use on 4 currency pairs: EURUSD M15; GBPUSD M15; USDJPY M15; USDCAD M15. Despite good stability, it is advisable to disable the EA operation during the days rich in news releases.
Configurations

The RiseTrading is a unique High quality and easy to use and affordable trading tool because we have incorporated a number of proprietary features and PowerSignal and MACD and Stochastic indicators. The main advantages of the trend trading strategy used by the Expert Advisor are opening positions only in the direction of a trend, ability for the long-term retention of profitable positions allowing users to achieve good combinations of profit/loss distributions. That can work on a real account at
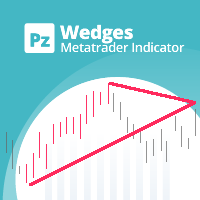
This indicator finds wedges , which are continuation patterns identified by converging trendlines surrounding a price consolidation period. It signals trades using a donchian breakout alongside the formation breakout. [ Installation Guide | Update Guide | Troubleshooting | FAQ | All Products ] Easy to use Customizable colors and sizes It implements breakout signals It implements alerts of all kinds
Optimal Usage To see wedges of all sizes, which can overlap, load the indicator several times on

This multicurrency strategy simultaneously determines the strength of the trends, entry points and the take profit levels for each trade. The indicator can determine entry points on any trading period from M1 to D1. For the convenience of users, the indicator renders the entry point (in the form of an arrow), recommended take profit levels (TP1, TP2, TP3) and the recommended stop loss level (SL1, SL2). The options for using the strategy are described below. Full description of the indicator Cosm
The Currency Strength Index Oscillator multicurrency trend oscillator shows the interaction of the indices of the current symbol's currencies calculated on the basis of the cross-rates of Majors.
Features Calculations are based on complete bars, therefore, it does not redraw. It works on any symbols that include the Majors (AUDJPY, AUDUSD, CHFJPY, EURAUD, EURCAD, EURCHF, EURGBP, EURJPY, EURUSD, GBPAUD, GBPCAD, GBPJPY, GBPCHF, GBPUSD, NZDJPY, NZDUSD, NZDCAD, USDCAD, USDCHF, USDJPY). It works on

The indicator shows and highlights the chart candles, which are formed as a result of large players entering the market in large volumes. Such candles can also be formed after achieving a certainty on the market, when most of the participants hold positions in the same direction. The movement is likely to continue in that direction after such candles. The indicator highlights the significant candles from the existing ones on the chart; The indicator allows identifying the trends based on candles

This indicator helps to define the dominant trend. The Blue line and Red line changes at incrementations of the trends.
Parameters ki: factor of the delay. per: Displays the indicator period. Trend: Displays the Trend movements. Trend true.(false) X: moves the trend left and right. Y: moves the trend up and down. How to understand the status: If the arrow is blue, trend is up. If the arrow is red, trend is down.

Proton EA is a Trend - Momentum Forex strategy that uses indicators to enter and exit orders. Proton EA allows you to change all parameters of the indicators selected for best results. This EA gives you the choice of whether to trade on Friday or not. The EA has a safe mode option which break even at stop loss to reduce losses. It has the ability to use trailing stops and is fully optimized for your needs. This EA has a customizable volume filter to protect you from unexpected volatility. It is

The Magneto Precision Trend indicator is based on candlestick analysis. It determines the trend change on the previous candle, signal is not redrawn.
Indicator setup and use Increasing the Period parameter decreases the indicator sensitivity, resulting in less frequent changes in color but filtering the market noise. However, the trend change signals will arrive visually with a delay. And, conversely, decreasing the value of Period provides more accurate but more frequently changing signals. T

The Magneto Reverse Signal indicator is based on the candlestick analysis. It identifies the reversal points.
Indicator setup and use Adjustment of the indicator is reduced to selection of parameters Period (left window of the panel) and Gate (right window of the panel). It is more convenient to adjust the settings using the control panel directly on the chart. In this case, you can immediately see which optimal parameters can be used in the current market. This method is shown in the video in
Channel hybrid of the Moving Average, Bollinger Bands, RSI and CCI indicators. Unique filtering of signals without redrawing the indicator allows making various trades - both medium-term and short-term. The indicator operation principle lies in searching for the market reversal patterns. The trend reversal detection method uses the channel Triangular Moving Average, which plots equidistant non-redrawing channels with a Deviation period specified in the settings. Comparison of TMA and Bollinger B
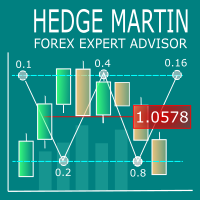
Hedge Martin Expert Advisor restores loss-making positions making them profitable by opening an opposite position with an increased lot.
Trading strategy The EA works on a trend market selecting the appropriate curency pairs. The robot trades depending on the previous candle direction. The first order is set according to the following rules: If the previous candle is bullish, the EA opens a buy order; If the previous candle is bearish, the EA opens a sell order; If the price goes in unfavorabl

NIZMA is a ready-made trading system, that is the most efficient on the EURUSD, AUDUSD and GBPUSD currency pairs. The best timeframes are M5 and higher. The system shows the market entry points in the form of arrows, and also displays the information on the strength and direction of the trend. The signals are easy to interpret. It is suitable for both novice and professional traders. With the properly selected settings, it gives the minimum number of false signals. In tests, this number did not

Volume Analysis Trader looks at volume using a fixed average of volume. This averaging helps spot when volume is rising or declining. Also I have added volume spikes which are when volume suddenly is above the average. These help spot market reversals. This will hep a trader look for the following in their trading: Rising volume during a rally shows trend is strong. Falling volume on a rally shows trend is weakening. As a rule of thumb on daily charts if current volume is higher than yesterday's

MA And Oscillation simple system that overcomes all the market confusion by simply looking at the moving average and stochastic oscillator and signalling when the moving average and stochastic or heading in same direction. The moving average is arguably the simplest but most effective tool when trading larger timeframes. We use this and the Oscillator to time our market entry. Features :
A method of simplifying a sometimes confusing market. Choose if you want to signal only when moving average

The indicator identifies the trend change points. Does not redraw. Calculation is done on an active candle. Lines crossing is used as a trend change point. If the price is above the two lines, there is an uptrend. If the price is below the two lines, there is a downtrend. The indicator allows you to accurately enter the market during a trend change. It can also be used in custom strategies on a detected trend. 3 modes of notification on trend changes. Sound, arrows, sending push-notifications. I

Unity Basket WPR (William's Percent Range) indicator combines serveral pairs' WPR to a combined basket of your defined base currency. This gives you clear trading signals along with potential TP and SL. Use the indicator along with other indicators, like ATR, to avoid flat market situations and an indicator showing you the overall trend like an MA (50). Trade with the trend.
Settings Basket pairs - comma separated list of pairs (default: EURUSD,EURJPY,EURCHF,EURGBP,EURNZD,EURCAD,EURAUD) Period

The trend scalper candles are used to identify short-term trends based on the readings of the MACD, RSI and ATR indicators. All indicator calculations are visualized by candle colors which are overlapped on the chart. The indicator uses gray , green and red colors to paint individual candles, which gives you a lot of useful and easy to read information.
Gray candles Gray candles indicate a range bound period and the information can be used to trade breakouts. Simply mark the high and low of th

TCD (Trend Convergence Divergence) is based on the standard MACD indicator with modified calculations. It displays the trend strength, its impulses and rollbacks. TCD consists of two histograms, the first one shows the main trend, while the second done displays the impulses and rollbacks. The advantages of the indicator include: trading along the trend, entering the market when impulses occur, trading based on divergence of the main trend and divergence of the rollbacks.
Input parameters Show_

Risepanel helps you open positions, close positions and analyze currencies. It works any time frame. For calculations to be correct, your account currency must be USD, EUR or GBP.
Features Market information. Orders and Pending Orders (Stop & Limit). 8 kinds of Pending by trend line. Specifications and Margin Calculation Required by Buy or Sell. Calculate and determine Stop Loss by pip, currency pair price, monetary value and percentage of risk. Calculate and determine the take profit by pip,
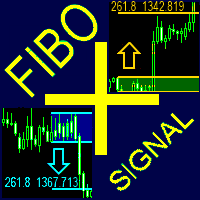
The FiboPlusSignal Expert Advisor. Automatic and manual trading on any instrument (symbol) and on any chart period. The operation algorithm is based on: Fibonacci retracement (5 different methods); calculation of trend direction using 14 indicators; support and resistance lines; horizontal support/resistance levels. Additional features: locking of orders (instead of setting stop loss); trailing stop based on Fibonacci retracement; alert system; visual panel for opening orders in manual trading –
Plotter is an indicator that was created during the ICT mentorship to make charting quick, easy and fun for everybody. Assign a function to any hotkey in indicator settings or use the default keys to perform smart actions that usually takes a lot of time to perform. Click on any bar, press OHLCMBVPOKJH to plot objects, color them with keys 0-9 or modify them with keys ERAZ and much much more. Indicator settings are described below. CHART SETTINGS gmt_offset auto -23 - 23 daylightsavings= set dst
The Expert Advisor strategy is based on the moving average channel breakthrough. VSP is required for flawless operation, the recommended minimum deposit is 1000 units of the base currency. The EA is to be used on M5-H1 of highly liquid currency pairs with a small spread/commission (for example, EURUSD, GBPUSD, AUDUSD, USDJPY, USDCHF, USDCAD, NZDUSD, EURJPY, EURGBP and EURCHF). Features The EA features a predictive algorithm based on price patterns, as well as stop loss and take profit levels; Cu

Algo Mtf is a multi timeframe indicator that can inform you about the situation of the indicators placed on other timeframes. This indicator has the possibility to offer a series of algorithmic calculations such as: RSI, Vortex, MACD, Momentum, Stocastic and ATR. The zones are colored in base of levels of this indicators on the chosen timeframe.
The confluence observation offers excellent operational tips and allows you to identify the trend tendency. The indicator is very efficient and an indi

Ema Dashboard is an innovative dashboard that allows you to monitor Moving Average on multiples symbols and different timeframes. This dashboard allows you to analyze information on 28 pairs on an unique chart. Its functionality includes analysis of All Time Frames. This configuration allows you to identify the Long Term Trend with extreme ease. This panel allows you to take very important directional movements. A click on button opens a new chart (symbol and timeframe).
Graphic Object Symbol
Double Wave applies standard indicators, volatility, volume and a number of custom approaches allowing for efficient combination of all mentioned tools. The indicator allows you to define possible price reversal points both in the direction of a trend (preferable) and against it. Also the indicator assists in determining the trend and visualizes it by displaying a histogram. The indicator works with any symbol provided that you have sufficient history data for a timeframe the indicator is launch
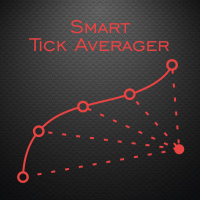
The Smart Tick Averager Expert Advisor is a cost averaging system, based on the analysis of the tick data. Smart Tick Averager finds a short-term trend impulse and attempts to capture a part of the rollback. In case the movement continues in the impulse direction, the EA chooses a moment for opening additional trades according to the grid step. It applies a filter, which minimizes the probability of falling into a strong trend movement. It also uses a filter of the segment, taking its amplitude
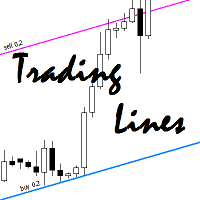
This utility is an Expert Advisor for semi-automatic trading within a price channel. It enters the market when the price crosses the channel boundary. Trend lines with a special type of description should mark the boundaries of the price channel. Trader is responsible for creating and aligning such trade lines on the required chart. The lines should be placed according to the same rules the "buy limit" and "sell limit" pending orders are placed. A trend line with a description of type "buy x" (w

Stochastic Trend Bars indicator is the modified version of the standard stochastic indicator. This indicator is different from the standard stochastic indicator and turned into a trend bars indicator. Added visibility to understand trends. Easy to use and simple. The user will easily detect trends. You can use this indicator as a trend indicator on its own. Or as a trend filter along with other strategically relevant indicators. Easy to use and simple to understand trends.
Suggestions and Feat

Pivots Dashboard is the single most complete instruments set for Pivot Points trading currently available in the market. We have done a comprehensive research prior to the product design to make sure that this product meets every need of Pivot Point trading. Pivots Points are significant levels technical analysts can use to determine directional movement and potential support/resistance levels. Pivot Points are thus predictive or leading indicators. While the points were originally used by floor

The Grid Trader Expert Advisor is a very special algorithm that allows traders to benefit from sideways markets. It trades long and short sides separately and creates two different grids according to its setting. Each side has its account and virtual take profit, determined in money. EA also uses virtual stop loss based on the account's percentage amount. Traders can work with a classic grid where the distance between orders is fixed or choose a more "adaptive" dynamic grid with ATR-based d

The fully automated Yellow EA works on short-term trend changes creating the price "corridor" set in the parameters. Trading is carried out at the external borders of this corridor by opening positions in different directions with different lot sizes.
Version of Yellow Expert Advisor for MetaTrader5 .
The strategy is simple, but effective.
Presence of a sufficient number of parameters allows trader to customize the advisor in accordance with his trading style.
Telegram: https://t.me/re

Trend reversal indicator. This indicator is based on expected value, as well as the Bollinger Bands and Ichimoku Kinko Hyo technical indicators. A trend reversal is determined by a complex mathematical formula, and its confirmation is based on the values of BB and the Ichimoku cloud. Signals are generated at the peak of a trend reversal, i.e. Trend Arrow Finder identifies the beginning of a new trend and the end of the previous trend. When a new candle opens, a signal for opening positions (buy

The strategy is based on the price channel breakout. VPS is required for flawless operation, the recommended minimum deposit is 1000 units of the base currency. The EA is to be used on M5-H1 of highly liquid currency pairs with a small spread/commission (for example, EURUSD, GBPUSD, AUDUSD, USDJPY, USDCHF, USDCAD, NZDUSD, EURJPY, EURGBP and EURCHF). Features The EA features a predictive algorithm based on price patterns, as well as stop loss and take profit levels; Customizable pyramiding, hedgi

Determining the current trend is one of the most important tasks for a trader regardless of their trading style. Price Direction is able to define a trend with a fairly high accuracy. The indicator applies the proprietary method in its calculations. Price Direction is suitable for any currency pair and timeframe. It does not change its readings. The indicator is based on volatility and the unique method. The histogram color depends on the current trend strength - the darker the histogram, the st

The Expert Advisor itself uses anomalies in momentum to identify short term bursts within the market to capture profit. With the use of the standard deviation and variance, the EA looks for changes in the Average True Range in order to place trades at peaks and troughs within the market that have the highest probability of establishing a new trend. It uses a number of different mathematical principles as well as embedded custom indicators. When using this expert advisor, there are four require

This type of EA does not open orders itself. (in backtest mode it open random orders for visualizing, how EA works) This utility is for manual trader, who like trading with Trailing Stops and want automatically trail stop loss of opened positions by preferred algorithm. This EA using one of the seven algorithms (MA, Fractals, SAR, ATR, Movement of Candlesticks, Profit and Points) to catch the trend. You can specify a breakeven level to move stop loss of your opened positions. You can filter ope
Il MetaTrader Market è un sito semplice e pratico dove gli sviluppatori possono vendere le loro applicazioni di trading.
Ti aiuteremo a pubblicare il tuo prodotto e ti spiegheremo come prepararne la descrizione per il Market. Tutte le applicazioni sul Market sono protette da crittografia e possono essere eseguite solo sul computer dell'acquirente. La copia illegale è impossibile.
Ti stai perdendo delle opportunità di trading:
- App di trading gratuite
- Oltre 8.000 segnali per il copy trading
- Notizie economiche per esplorare i mercati finanziari
Registrazione
Accedi
Se non hai un account, registrati
Consenti l'uso dei cookie per accedere al sito MQL5.com.
Abilita le impostazioni necessarie nel browser, altrimenti non sarà possibile accedere.