• Prezzo
     - 
  • Resetta
Guarda i video tutorial del Market su YouTube
Come acquistare un Robot di Trading o un indicatore
Esegui il tuo EA
hosting virtuale
Prova un indicatore/robot di trading prima di acquistarlo
Vuoi guadagnare nel Market?
Come presentare un prodotto per venderlo con successo

Nuovi Expert Advisors e Indicatori per MetaTrader 4 - 3555

icon I robot di trading eseguono le operazioni di mercato automaticamente, mentre gli indicatori permettono di analizzare al meglio le quotazioni e prevedere il comportamento dei prezzi. Con queste applicazioni, sarai in grado di eseguire operazioni in MetaTrader 4 in modo più consapevole, cogliendo più opportunità.
The Doji candlestick pattern is characterized by one that has its open and close prices nearly (if not exactly) equal and resembles the shape of a cross. It is often regarded as a sign of indecision and is especially significant if seen in a down trend or up trend, which potentially signals that sellers or buyers are losing conviction. The TIL Doji Price Action finds and marks all Doji candlestick patterns and intelligent approximations thereof. In addition, it predicts the direction of price wi
Alerts
Maxim Polishchuk
3.5 (2)
Alerts utility issues notifications when orders are opened, closed and removed, as well as when the price touches the selected graphical objects on the chart. The utility supports all graphical objects used in graphical analysis and features a simple graphical interface. Once launched, the indicator works in the background, does not take up space on the chart and does not consume system resources. Tracking order status. If tracking order status is enabled, the utility automatically checks order
FREE
Pivot Lines
Igor Semyonov
5 (1)
Description Pivot Lines is a universal color multicurrency/multisymbol indicator of the Pivot Points levels systems. You can select one of its three versions: Standard Old , Standard New and Fibo . It plots pivot levels for financial instruments in both windows simultaneously. The system will automatically calculate the Pivot Point on the basis of market data for the previous day ( PERIOD_D1 ) or week ( PERIOD_W1 ) and the system of support and resistance levels, three in each. It can also displ
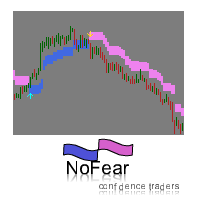
NoFear
Hoang Ngoc Thach
5 (1)
NoFear indicator is based on Advanced Moving Average. It is used in technical chart analysis providing signals whenever a rate change appears that exceeds the upper or lower border. The indicator works very well on trend market. It is easy to find good entry points by blue/violet arrows. The upper and lower bands should be used like support/resistance levels and stop/exit points. All signals do not repaint, and can be used immediately when they are coming. This means we do not need to wait for a
The Zig-Zag indicator is extremely useful for determining price trends, support and resistance areas, and classic chart patterns like head and shoulders, double bottoms and double tops. This indicator is a Multi Time Frame indicator. The indicator is automatically calculate the 3 next available TF and sows ZigZag from those TimeFrames. You cannot use this indicator for the TF greater than D1 (daily).
Riskscope
Paul Geirnaerdt
Riskscope shows all relevant information about your trades on screen. Information on Stop Loss and Take Profit can be shown as price, pips or exposure. Besides, Riskscope can display a high- and low-watermark of the total of your basket of trades. Settings Riskscope's default settings are good enough most of the time. Nearly all of them are fairly standard. Here are the ones that need some explanation. Monospaced font - set this to the (name of) the font you want to use. A monospaced font looks

Sai perché MetaTrader Market è il posto migliore per vendere strategie di trading e indicatori tecnici? Non c'è bisogno di pubblicità o di protezione del software, nessun problema di pagamento. Tutto ciò è fornito da MetaTrader Market.