Guarda i video tutorial del Market su YouTube
Come acquistare un Robot di Trading o un indicatore
Esegui il tuo EA
hosting virtuale
hosting virtuale
Prova un indicatore/robot di trading prima di acquistarlo
Vuoi guadagnare nel Market?
Come presentare un prodotto per venderlo con successo
Nuovi Expert Advisors e Indicatori per MetaTrader 4 - 299

The algorithm based on strict adherence to the price movement (trend) and fixing of any slightest movement. To enter into the market, it uses the instant price movement of an instrument. The EA places Take Profit and Stop Loss to lock in profits and to limit possible losses. The Trailing Stop function allows to fix any sign of market movement. Aggressive scalper can work both with a fixed lot and using percent of deposit. It uses market orders. Does not use such trading elements as Martingale o

Before news release, the EA places two pending orders at a preset distance from the current price – BUYSTOP and SELLSTOP. If the published news does not immediately cause a strong price movement, and the price starts to slowly move in a certain direction, the EA moves one of the order away, and the other one is moved closer following the price, until the price starts moving fast or the orders expire. This makes it possible to place orders as close as possible to the price (20-30 points for the f

The indicator is based on MA with additional processing of all the current prices, as well as all Highs and Lows for an appropriate period. The product efficiently displays trend changes and tracks a trend line and color if conditions remain unchanged. The indicator has only three parameters making it easy to configure.
Parameters PeriodTrend - amount of bars used for a trend calculation PeriodAverage - indicator line averaging period Method - averaging method

The indicator displays volume profiles based on the nesting principle. Profiles periods are pre-set so that each subsequent profile has a length twice as long as the length of the previous profile. In addition to profiles, the indicator displays volume clusters sorted by color, depending on the volume they contain.
Indicator operation features The indicator works on typical timeframes from M5 to MN, but for calculations uses historical data from smaller timeframes: M1 - for timeframes from M5
FREE

This tool serves two purposes. It enables you to place a live trade on a live chart . It allows you to place trades in the strategy tester as it runs. On a live chart you can place a trade by: Clicking a Buy, Sell or Pending Lines button. Scheduling a Buy, Sell, or Pending using the scheduler. In the included screenshots you can see four panels labeled: Manual Trading. Order Lines (pendings). Trade Status. Scheduler. Across the top we can: Hide Panels. Fix the scale. Zoom the chart in/out. Chang

Volume DeltaPanel is a very powerful indicator that read the supply on Market. It calculates the Delta from movement of the price and the difference of BUY volumes and SELL volumes. The Volumes are added to price and normalized to symbol points.
Its special structure allows you to get all Time Frames values available on the platform MT4. Panel can show 28 instruments simultaneously all customizable according to the offer of the Broker. A good observation of this instrument can suggest great ent
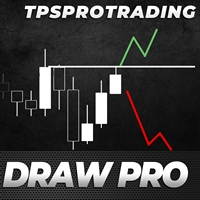
The TPSproDraW indicator allows to draw continuous zigzag lines on the chart. This handy tool will strike fancy of those traders who trade using technical analysis and need visual expression to forecast the price movement.
A drawn continuous zigzag line can be removed as easily as it is drawn - just aim a mouse cursor to the zigzag line and press the Shift key. How it helps:
The Z key - double press to enable the mode of drawing patterns, press one time to disable the mode, Esc - cancel drawn ob
FREE
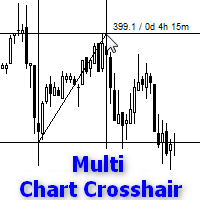
Indicator works like script and shows crosshair on all charts of any symbol. It can be used for comparison price levels and time periods on all charts of the same currency pair or for comparison candles according to time periods on charts of any symbols. You can also compare different types of charts, for instance standard chart with tick or range bar charts. Indicator can be easily attached to chart from navigator menu or using hotkey Ctrl + F, which you need to set manually. Moreover you can a

This is a grid Expert Advisor using EMA to filter a trend and CCi to enter the market. It allows you to manually filter flat and trend parts of the market or traded symbols. The lot is calculated based on the smart algorithm depending on the order location. The EA features the filter of the minimum distance between unidirectional orders calculated based on the specified percentage of the average daily candle for 21 days allowing the EA to avoid excessive load on the deposit. The profit is fixed

Reversal Breakout is a real breakout strategy. It is based on Moving Average indicator to define market trend and breakout points. Try to entry when price reverse is not good, because there are many false reversal signal, so that it is better to trade breakout at reverse point. This EA will work for all Timeframe, but I prefer to use it on H1 or above. Should use it on major pairs which are lowest Spread, and lowest Slippage: EURUSD,GBPUSD,USDJPY,GOLD,... No martingale No Grid Always use Stoplos
The indicator uses 2 Moving Average: 1 fast EMA and 1 slow EMA to define trend, reversal signal and breakout point. Reversal Signal comes on open time, it can be used as scalping signal for short time, but be careful with this signal because it may be an anti-trend signal, the indicator tries to catch reverse point. Breakout signal is where support or resistance was broken out, the reversal signal has failed. Breakout signal is stronger than the Reversal Signal. We can use support/resistance lev

BG Rebate is a new Expert Advisor for trading EURUSD. Timeframe - М1. It uses signals of built-in indicators to enter the market. The indicators determine the best parameters for entry basing on the price chart analysis. Open orders form a basket of orders that close by the indicator signal. A stop loss working only during very strong impulse price movements is assigned to each order. Such movements do not occur during a morning flat, which is the time when the EA is active. The minimum deposit

The indicator is based on Moving Average to define the trend, then it finds a good entry point and follows the trend. We will keep open on a new signal until the trend is changed, and all trades exit on an opposite signal. The exit point is a bit late relative to the highest profitable point (at top/bottom), but it is the best point to exit your trades. Keep the trades, which are moving the right direction to get a high profit, and stop wrong trades as soon as possible when the trend is changed

This indicator calculates the volume profile and places labels that correspond to the VAH, VAL and POC levels, for each candle individually.
Indicator operation features The indicator works on the timeframes from M5 to MN, but it uses the history data of smaller periods: M1 - for periods from M5 to H1, M5 - for the H4 period, M30 - for the D1 period, H4 - for the W1 period, D1 - for the MN period. The color and location of the VAL, VAH and POC labels on the current candle are considered to be c
FREE
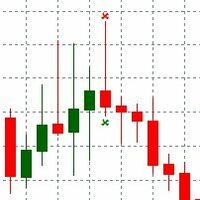
PinBar indicator is an Indicator identifies price reversal, pattern and timely identifies that price trend is changed. The Trend change is immediately identified over the chart. Alert is send over the Chart and Email address. Indicator generated Signal Price is displayed over the chart near the PinBar. Please make sure to use on Higher time frames if you are swing trader. for day traders who want to use M30 or M15 time frames, Take profit should be kept minimal. Lower than M15 is not recommende

[EA] MECHANIC is a MetaTrader (MT4) Expert Advisor designed for use with three basic currency pairs EURUSD, GBPUSD and AUDUSD. With individual settings, it can work very well on any currency pair as well. The EA implements complete, fully functional and exact mechanical trading strategy, with no place for emotions. It is based on standard MT4 indicators "Bollinger Bands" and "Parabolic SAR". The strategy is working on Timeframe M5 only. It is very easy to set up and supervise.
Features It can b

The EA distinguishes a sideways trend from a directional one and changes its trading tactics. When an opposite signal appears, an opposite order is opened, covering the opposite ones. And changes the parameters opposite to close. The Expert Advisor is intended for trading only on foreign exchange market FOREX. Does not work on stock and commodity instruments. Recommended for use on variable periods M5, M15 and H1.
ADVISOR PARAMETERS: ID Expert Advisor - Magic number of the advisor. period FAST

The indicator compares Fractal and Zigzag indicators to define hard Support and Resistance. The arrow signal appears when a new support or resistance emerges or when the price breaks through Support and Resistance zone. This indicator is efficient in conjunction with a rebound and breakout strategy. It works well on H4 and D1 for all pairs.
Settings BarCounts = 200; FastPeriod = 7 - fast period SlowPeriod = 14 - slow period Show_SR = true - show support/resistance Show_Arrows = true - show up/d

Using high-volatility channel breakout-style trading systems has historically worked well across major currency pairs, show promise in determining the opportune time to trade the channel breakout trading strategy. This Breakout Strategy may look simple, but it is good follow trade trader strategy.
Setting: Channel Periods: default 20 BarsCount: bars count in history Alert_Settings = "+++++++++++++++++++++++" SendMailMode = true - Send email SendNotificationMode = true - Send notification to you

Questo indicatore informativo sarà utile per coloro che vogliono essere sempre informati sulla situazione attuale del conto. L'indicatore mostra dati come profitto in punti, percentuale e valuta, nonché lo spread per la coppia corrente e il tempo fino alla chiusura della barra nell'intervallo di tempo corrente. VERSIONE MT5 - Indicatori più utili
Esistono diverse opzioni per posizionare la linea delle informazioni sulla carta: A destra del prezzo (corre dietro al prezzo); Come commento (nell'
FREE
The Martin Pristine trading robot analyzes the signals of the Price Channel Central indicator for trading decisions. No need to additionally attach the indicator to a chart, it's built into the Expert Advisor. After each losing trade, the lot is multiplied by 2. This Expert Advisor can detect 4 and 5-digit quotes automatically. Only one position can be open in the market at the same time.
Expert Advisor settings: TF = 15; - select the chart timeframe for Price Channel Central Bars_Count = 100;

The market is unfair if only because 10% of participants manage 90% of funds. An ordinary trader has slim changes to stand against these "vultures". This problem can be solved. You just need to be among these 10%, learn to predict their intentions and move with them. Volume is the only preemptive factor that faultlessly works on any timeframe and symbol. First, the volume appears and is accumulated, and only then the price moves. The price moves from one volume to another. Areas of volume accumu
The utility copies trades from the signal provider accounts (master accounts, one or multiple providers) to unlimited number of receiver accounts (slave accounts). Attention! Y ou need to use identifiers (Provider number) of the same length if you use several master copiers. For example. 1, 2, 3 or 11, 13, 22. The copying can be set in the opposite direction. The comments with all the recently performed actions are displayed on the screen to monitor the utility actions in slave mode. To avoid p
Vanesa RSI Reverse provides an amazing trading strategy. Use optimization function of Strategy Tester in MetaTrader 4 to find out many high potential parameter sets in very long term of history data (more than 2 years). The EA works well with XAUUSD in M15 but it also give similar results in others symbols and time frame. It just takes some minutes to try it out in your own history data to see the very good performance. We will continue to improve the strategy to get better performance in next v
FREE

BigPanel is a plug-in indicator that works exclusively with Control adora Expert Advisor. Its main functions are as follows: Select two types of button arrangement (horizontal or vertical) Change the buttons' size (from small to big; there are five different sizes in total) Move the buttons' panel around the chart. The arrangement and size can be settled in the indicators properties. To move the buttons' panel, click once over the hand button and move your mouse, the panel will follow it. To sto
FREE

The indicator Net Change is a very useful tool able to extrapolate a percentage in order to have a real reference on the performance of the instrument. This indicator is designed to show the main values: you could monitor the Daily, Weekly, Monthly, Quarterly, Semi-annual and Annual percentages. A necessary tool for those who want to really explore the quantitative logic of the market.
Input values SYMBOLS SETTINGS Use_Only_Current_Symbol (true/false): Permits to manage only current symbol on p

The Best and Worst indicator (similar to Net Change Indicator) has the peculiarity of being a dynamic indicator. It seems a very Stock Exchange Indicator. This means that it is able to draw up a list and put in order the best and worst instruments in descending order. You can choose to show the percentage of any Time Frame: 1M, 5M, 15M, 30M, H1, H4 etc ... This instrument could really give great suggestions on your trading in order to center the right time and to have a total view of the markets
BuyLimit and SellLimit Buttons opens any combination of Buy Limit and Sell Limit pending orders and closes all existing pending orders. If boolSL = true, then the EA will add a Stop Loss value to all pending orders. If boolTP = true, then the EA will add a Take Profit value to all pending orders.
Inputs Before placing all pending orders, the input window is opened allowing you to modify all input parameters: DeleteAllPendings: if true , then all pending orders (for the current currency) can be

Trend Trade indicator is based on ADX indicator to define long/medium/short trend and good entry signals. The product supports virtual trade on chart to show where/when should we make an entry/exit. It works very well on D1 or above. The indicator is efficient on GOLD and CFDs. Alert_Settings = "+++++++++++++++++++++++" SendMailMode = true - Send email SendNotificationMode = true - Send notification to your phone AlertMode = true - Sound alert Show_Virtual_Trades = true - Show virtual trades Sin

This scalping Expert Advisor does not use any indicators. Martingale is not used as well. The product displays a channel, two lines from Ask and Bid. If the channel is touched or broken by the price, the timer is enabled. Upon its expiration, the channel is modified based on new prices. Pending BuyStop and SellStop orders are placed at the specified distance from the channel levels, pending orders are modified following the channel. As soon as a pending order becomes a market one, an opposite or

This indicator is another variant of the famous powerful indicator Fibonacci-SS https://www.mql5.com/en/market/product/10136 but has different behaviour in placing Pending Order and TP Line. Automatically places Fibonacci retracement lines from the last highest and lowest visible bars on the chart with: An auto Pending Order (Buy/Sell). Taking Profit 1, Taking Profit 2 is pivot point and Taking Profit 3 for extended reward opportunity. The best risk and reward ratio.
Simple and powerful indicat

The Piramida Grid EA analyzes the values of the Slope Direction Line indicator for determining position entry. The grid of orders changes once the market reverses. Works on pending BUYSTOP and SELLSTOP orders. Uses a system of averaging losses which controls a balance of open trades and moves it to breakeven. Automatic detection of 4 and 5 decimal places.
Expert Advisor Setup: period = 32; - period for the Slope Direction Line indicator FilterNumber = 2; - Slope Direction Line filter setup ma_m

YF-Meter indicator help you to find the fastest speed up currency pairs.
While the US news are released, non-US currencies rising up or dropping down at the moment.
It is important to consider "the opportunity cost" of opening the positions.
If we can find the fastest rising up or dropping down currency pairs, that would improve our trading. This idea comes up with "Newton's laws of motion", different from the traditional volatility measurement.
After adjustment by the unique filter(the digital

The Expert Advisor is a risk manager helping users to control their trading. In the settings, it is possible to specify the parameters at which the risk manager force closes the opened trades and closes the terminal as well, if it is needed to prevent opening trades on emotions, which do not correspond to the trading strategy. Risk Manager settings Check limit to close - check the equity limit Limit to close (account currency) - equity limit that is checked when Check limit to close is act

i-Regression Channel generates regression channel: Linear regression channel consists of two parallel lines located at the equal distance from the linear regression trend line. The distance between the channel borders and the regression line is equal to the value of the highest close price deviation from the regression line. degree - degree of regression, changes from 1 to 61; kstd - regression channel width; bars - the number of bars for the channel calculation; shift - the channel horizontal s

Breakdown Velocity is a fully automated trading system, using which you'll never miss a trend or sharp price movement. The Expert Advisor uses custom indicators of trend growth and tick volume.
Main Features Low drawdown! Built-in money management Tight stops Protection against high level of spread Protection against slippage (to minimize losses and maximize profits) Non-grid system Not arbitrage. Does not fit results with historical data The maximum loss is no more than 60 points for a 5-digit

The indicator colors bullish, bearish and doji candles. Also, the amount of candles (bullish, bearish and doji) for the last N days is calculated. You can select colors for both bodies and shadows of candles. You can also enable coloring only candle bodies. МetaТrader 5 version: https://www.mql5.com/en/market/product/11649 Parameters color bulls = color of bullish candle bodies color shadow bulls = color of bullish candle shadows color bears = color of bearish candle bodies color shadow bears =
The indicator calculates WPR formula on volume-aware indicators Accumulation/Distribution , OnBalance Volume , or Price Volume Trend . WPR range is moved into positive domain [0..1] for convenience.
Parameters WPR - period of WPR, by default 24; Base - type of the underlying indicator: AccumulationDistribution (by default), OnBalanceVolume, or PriceVolumeTrend; Price - applied price type for OBV and PVT, by default - Close; it's ignored in case of AD;
Screenshots On the screenshots below the
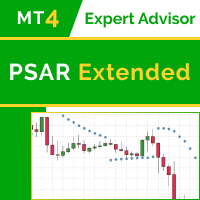
Main idea of this EA lies around the Parabolic SAR indicator. New version this Expert: PSAR Expert Extended 2 The advanced EA version includes the following changes and improvements: The free initial version has been analyzed and the EA algorithm has been improved The EA behavior has been monitored on various account types and in different conditions (fixed/floating spread, ECN/cent accounts, etc.) Cod optimization, bug fixes. The EA functionality has been expanded. Features better flexibilit

Consulente indicatore universale per MetaTrader 4 con una vasta gamma di funzioni, lavorando su indicatori standard. Costruttore di strategie in 1 Expert Advisor. Molti indicatori di trading dal set MetaTrader standard. Possibilità di scegliere 1 segnale su 20 e 5 filtri su 20. Più di cento parametri per la personalizzazione individuale in base alle tue esigenze. Per ogni segnale è possibile personalizzare i parametri dell'indicatore, selezionare un intervallo di tempo e specificare una barra de
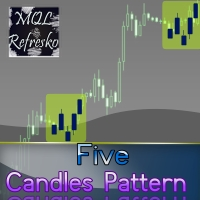
The "Five Candle Pattern" indicator is a novel way to see the market, because with it we can compare and/or seek training or the pattern of the past 4 or 5 Candles, and identify them in the same graph, to view your behavior at an earlier time. The indicator creates a pattern of those 4 or 5 candles and searches backward, identifies, and marks the same formation or pattern. With that information you adjust the strategy that is operating, or create a new one, because you can compare the past devel

The Open All indicator uses a simple market information that is "Open Candle". This tool is able to show all the openings of all time frames in order to extract information of strength and trendy. You can display 28 instruments with relative time frame interior for a total of 252 informations. The display is fully customizable, you can choose either the symbol and enable/disable Time Frames. Using it correctly you could get valuable aid to intercept correlations and turning points in the market.

This is a moving average which can move not only to the right/left, but also up/down. You can also select a mode of displaying the indicator (as a line or as dots) and all other settings of a standard moving average. If you overlay several indicators in one window, you can clearlier determine price channels setting each border individually.
Settings Line_or_Dot - mode of displaying the indicator: true - as a line, false - as dots; MA_period - moving average period; MA_shift_X - number of candle
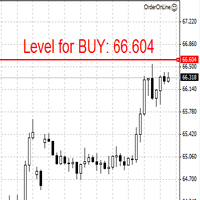
The Expert Advisor opens orders from the horizontal line, the a trader can set on any level by dragging using the mouse or by changing the line properties. For example, when a horizontal line is above the current price, the EA will open a Buy order once the horizontal line is reached. And vice versa: If the line is below the current price, the EA will open a sell order once the line is crossed. A buy crossover of the line is: opening of the current candlestick below the horizontal line; the curr

This is the free version of "SAR Trading Station"(auto trading GBPUSD only), the full version link is here https://www.mql5.com/en/market/product/4690 SAR Trading Station is a semi-auto trading system based on Parabolic SAR and Stochastic etc, and trend driven swing trading strategy. This is an agile platform allowing you to setup various parameters to optimize the specific symbol pair trading strategy for yourself! Risk(Max Loss$): Default is 50, Max loss Per order(Position size is calculated b
FREE

This is an indicator detecting trend direction. It uses the popular Bill Williams Alligator. It shows market state on all timeframes on one chart. As is well known, traders gain the main profit on the Forex market trading by trend, and losses usually occur when the market is flat. So, in order to gain profit a trader should learn to detect trend market and direction of a current trend in a rapid manner. This indicator has been developed for this purpose. MTF Alligator helps to: Profitably trade
FREE
"All in one on Ultimate Panel" Helping in opening and manage orders with "one click trading" system. Note: This demo version is for testing on CADCHF pair only. The full version can be found here: https://www.mql5.com/en/market/product/11558
Features
1. Speed Trading / One Click Trading. Just set Lot Size, Stop Loss,Take Profit level. Then click the "BUY!" / "SELL!" button. Order will open immediately.
2. Drag line to place pending order. Just click "BUY LINE" or "SELL LINE" button.
FREE
The main rule of the profitable trading is opening trades in the direction of a trend. You can define the current trend using fractal analysis. The Important Zone ResSup indicator displays important price support and resistance levels on the chart. The breakthrough or bounce from those levels shows further price direction. The data panel allows you to track the current trends on all timeframes. The current timeframe's important level values are shown in the comments. The indicator can be useful

LoLFx is a scalper Expert Advisor which uses the strategy of support and resistance lines breakthrough. Fully automated. Designed for trading EURUSD, a low spread broker is preferred. The EA independently detects support and resistance lines and places pending orders. When the market changes it removes old pending orders and places new ones. Just in case, orders are placed with preset stops to avoid significant losses in emergency situations, for example in case of Internet disconnection. Virtua
"All in one on Ultimate Panel" Helping in opening and manage orders with "one click trading" system. Note: Demo version for testing can be found here: https://www.mql5.com/en/market/product/11563
Features
1. Speed Trading / One Click Trading. Just set Lot Size, Stop Loss,Take Profit level. Then click the "BUY!" / "SELL!" button. Order will open immediately.
2. Drag line to place pending order. Just click "BUY LINE" or "SELL LINE" button. Then 3 horizontal lines will appear on the cha

https://www.mql5.com/en/signals/my/all
Batman EA is a very simple expert system that works with ZigZag Indicator and using breakout strategy. It only opens trade when market actually breakout. It opens maximum 2 trades (1 buy and 1 sell if one of those does not close). It is very easy to use, does not need any complicated settings, just add it to a chart and it will run like clockwork for you. You can trade or test it on XAUUSD because we created this EA for this pair, but you can also trade or

Volume POC
L'indicatore Volume POC mostra livelli importanti. Puoi usarlo come un sistema di trading indipendente.
Le funzioni di avviso alla chiusura di una candela ti consentono di avere alcune informazioni sulla direzione del mercato.
La visualizzazione grafica è semplice ed efficace. I livelli riportati sono il risultato dello studio dei volumi storici di mercato.
Questi livelli offrono ottimi punti di ingresso e ottimi livelli di supporto e resistenza.
È possibile utilizzare l'indicat
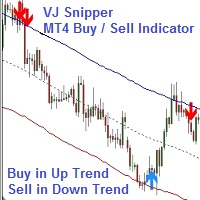
VJ Sniper - MT4 Buy / Sell Indicator: This Indicator is as simple as Buy in Up Trend & Sell in Down Trend. There are 2 Support / Resistance lines for choosing the best Entries. Background: Any in-built indicator of MT4 does not work as stand alone such as Stochastic, CCI or DeMarker etc. But combination of them with trend projection work & give the best results for Trading entries. So this Indicator is blended to give the best results whi

SAAD Scalper is fully automated EA and handles two strategies at same time with its unique style to make most of trades profitable. The EA scalps pips by its strong Entry strategy. Trades that are not successful to scalp are handled in a different and unique way of martingale. It includes two options to deal with open trades. Pending Order Martingale (It helps to reduce Draw Down) Market Order Martingale It works on multiple currency pairs simultaneously and best results found for EURUSD, GBPUSD
FREE
This EA you can automatically act on trend lines of your choice. You only need to draw a line and then press the buy or sell button. Suitable for traders the chart pattern (triangles, channels, spikes ...) act. The tool is also suited for quick and easy to set Pending Orders.
Input parameters Magic - Choose magic number MoneyManagement - Automatically calculated lot size, values are displayed on the lines RiskMode - Choose risk model RiskPercent or RiskMoney RiskPercent - In percent when money

Advanced ideas of the popular MACD indicator: It detects and displays classic and reverse divergences (three methods of detecting divergences). It uses different color to highlight an uptrend and a downtrend. Two methods of determining a trend: а) MACD crosses the 0 level (classic signal); б) MACD crosses its own average (early signal). This is a multi-timeframe indicator: it can display MACD data from other timeframes. Two methods of drawing: classic histogram and line. It generates sound and v

You can fins our other products from link : https://www.mql5.com/en/users/drbastem/seller Also, you can ask all your questins from email : haskayafx@gmail.com or mobile : +90 530 867 5076 or @MehmetBastem on telegram application This indicator is used to determine the trend. Standard Osma indicator is used. It has the indicator warning system: beep, e-mail and has three types of alerts, including messages to mobile phone. It shows the best performance on the chart of 5 minutes. When the

This EA requires a broker having Market Execution (ECN, NDD, STP accounts), low spread, zero StopLevel (or close to such level), no commission if possible (as it influences on the profit amount). Order executin time should be measured in milliseconds, not minutes, requotes and slippage should not happen too often. Deposit: Minimum deposit is $50 (MinLot = 0.01) or $500 (MinLot = 0.1) Recommended currency pairs: EURUSD, GBPUSD, AUDUSD, NZDUSD, USDJPY, USDCHF, USDCAD No Martingale / No grid / No a
FREE

Limpid Expert Advisor capable to work in weak and fast market as well as can do news trading. The EA places pending orders using indicators, price speed and different built-in filters. The strategy works without floating loss and good for low deposit accounts and can work with $50. No Martingale No Grid No Arbitrage No any other risky strategy inside If you have any question about the EA or need any help please contact me
Key Features It can work with small deposit Only Pending Orders Every tra

BreakEven Line è un indicatore molto utile e facile da usare.
In caso di più posizioni aperte sullo stesso strumento, l'indicatore mostra il punto di pareggio dove è possibile chiudere le posizioni.
La sua semplicità grafica lo rende uno strumento discreto e personalizzabile.
Puoi abilitare/disabilitare una linea su un grafico, in modo da rendere invisibile l'indicatore.
Input
Mostra BE cumulativo (linea on/off) Colore della linea di pareggio (per cambiare il colore della linea) Stile dell

Charles Henry Dow felt that if the industrial average and the railroad average both moved in the same direction, it meant that a meaningful economic shift was occurring. In brief, this indicator bases on the Dow's theory. It can create an index of market symbols, almost anythings index. For example: Index of the Euro, Index of the Great Britain Pound, Index of the Japanese Yen, Index of the Swiss Franc, Index of the Gold, Index of the New Zealand Dollar, Index of the Australian Dollar, Index of

Charles Henry Dow felt that if the industrial average and the railroad average both moved in the same direction, it meant that a meaningful economic shift was occurring. In brief, this indicator bases on the Dow's theory. It can create an index of market symbols, almost anythings index. For example: Index of the Euro, Index of the Great Britain Pound, Index of the Japanese Yen, Index of the Swiss Franc, Index of the Gold, Index of the New Zealand Dollar, Index of the Australian Dollar, Index of
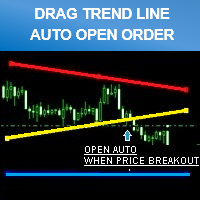
Smart tool system for opening orders by Trend Line automatic.
Just drag a Trend line to define your breakout point then click "Confirm Order" button. The EA will automatically opening order when price breakout Trend line that defined by you. Work on live and back test (Strategy Tester) Can modify trend line on real-time. Note : This demo version is for testing on CADCHF pair only. The full version can be found here: https://www.mql5.com/en/market/product/11202 Features
Drag trend line for open
FREE
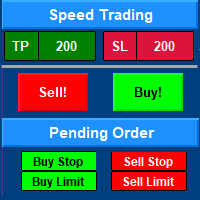
Speed Trading / One click trading / Faster trading. The EA is helping in opening order and allows you to manage orders more quickly with "One Click Trading" system. It can also work with pending orders. This EA can work on live and back-test (Strategy Tester). Note : This demo version is for testing on CADCHF pair only. The full version can be found here: https://www.mql5.com/en/market/product/11203
Features
1. Speed Trading / One Click Trading Panel. Open orders with one click. Setting Lot
FREE
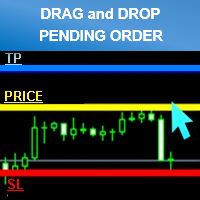
Easy way to place pending order , Just drag line, Set price Can work on live and back-test (Strategy Tester) Note: This demo version is for testing on CADCHF pair only. The full version can be found here: https://www.mql5.com/en/market/product/11174
Features
1.Easy Way f or Opening Pending Orders. You only need to drag line to define open price, stop loss, take profit values. Then click the "ORDER SEND" button. EA will open pending orders automatically. And also automatic detect types o
FREE
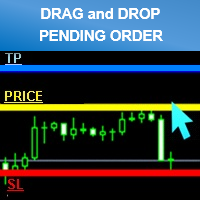
Easy way to place pending order , "Just Drag & Drop" Work on live and back-test (Strategy Tester) Note: Demo version for testing can be found here: https://www.mql5.com/en/market/product/11287
Features
1.Easy Way for Opening Pending Orders. You only need to drag line to define open price, stop loss, take profit values. Then click the "ORDER SEND" button. EA will open pending orders for you automatically. And also automatic detect types of pending order (Limit and Stop).
2. Can work on
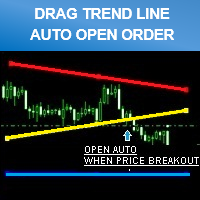
Smart tool system for opening orders by Trend Line automatic.
Just drag a Trend line to define your breakout point then click "Confirm Order" button. The EA will automatically opening order when price breakout Trend line that defined by you. Work on live and back test (Strategy Tester) Can modify trend line on real-time. Note: Free Demo version for testing can be found here: https://www.mql5.com/en/market/product/11289 Features
Drag trend line for open trading by when price breakout that line.
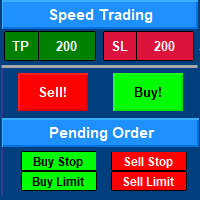
Speed Trading / One click trading / Faster trading. The EA is helping in opening order and allows you to manage orders more quickly with "One Click Trading" system. It can also work with pending orders. This EA can work on live and back-test (Strategy Tester). Note: Demo version for testing can be found here: https://www.mql5.com/en/market/product/11290
Features
1. Speed Trading / One Click Trading Panel. Open orders with one click. Setting Lot Size ,Take Profit, Stop loss on the screen.

This utility tool help you to close all orders or apart of all (you can choose which symbol you want) immediately with only ONE CLICK, its work very fast ,so it will helpful for you in your trading to manage trading faster. If you want to close all orders, you just need to let symbol parameter is blank (like in default setting). If you want to close all orders of one pair (for example EURUSD orders) you need to put symbol =EURUSD (see screenshot below). This is a script, so its will be putted in

This utility tool help you to close all orders having profit immediatly with only ONE CLICK, its work is very fast. You can choose which symbol you want or close all symbols so it will helpful for you in your trading to manage trading faster. If you want it work on all symbols, you just need to leave symbol parameter blank (like in default setting). If you want it work on 1 symbol only (for example EURUSD orders) you need to put symbol =EURUSD (see screenshot below). This is a script, so its wil
Il MetaTrader Market è il posto migliore per vendere robot di trading e indicatori tecnici.
Basta solo sviluppare un'applicazione per la piattaforma MetaTrader con un design accattivante e una buona descrizione. Ti spiegheremo come pubblicare il tuo prodotto sul Market per metterlo a disposizione di milioni di utenti MetaTrader.
Ti stai perdendo delle opportunità di trading:
- App di trading gratuite
- Oltre 8.000 segnali per il copy trading
- Notizie economiche per esplorare i mercati finanziari
Registrazione
Accedi
Se non hai un account, registrati
Consenti l'uso dei cookie per accedere al sito MQL5.com.
Abilita le impostazioni necessarie nel browser, altrimenti non sarà possibile accedere.