Guarda i video tutorial del Market su YouTube
Come acquistare un Robot di Trading o un indicatore
Esegui il tuo EA
hosting virtuale
hosting virtuale
Prova un indicatore/robot di trading prima di acquistarlo
Vuoi guadagnare nel Market?
Come presentare un prodotto per venderlo con successo
Nuovi Expert Advisors e Indicatori per MetaTrader 4 - 289
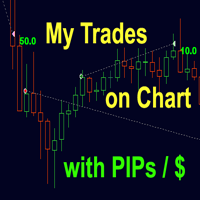
Uno strumento di trading da non perdere. L'indicatore visualizza tutte le operazioni/deal nel grafico con il simbolo a cui è collegato. Stampa il numero di pip in profitto o in perdita. A scelta, stampa una linea verticale attraverso le sottofinestre per una migliore analisi.
Consultate anche la versione PRO qui: My Trade History PRO https://www.mql5.com/en/market/product/50206
Inoltre, aggiunge le informazioni sul risultato totale delle operazioni nella valuta di deposito e sul totale dei pi
FREE

The Expert Advisor does not use indicator, it is always in the market. The logic of the EA is based on the analysis of the previously opened orders present in the market. Expert Advisor settings: StopLoss_Percent - loss level in percent TakeProfit - profit level in points Risk - setting for automatic calculation of order volumes for the EA, works if LOT =0 LOT - fixed volume of orders Slippage - maximum allowed price slippage MagicNumber - magic number for EA's orders Show_Information - enable o

Elastic Grid MT4 is a multi-functional grid Expert Advisor, designed for full or partial automation of various ideas related to grid trading. The EA trades on any timeframe and symbol. It can also trade several symbols with any amount of decimal places. It does not interfere with manual trading and other EAs' operation or any indicators. It allows to adjust its settings on the fly, works only with its own orders displaying all necessary data on them when needed, and for some situations it can be
CAP Zone Recovery EA MT4 is your tool to turn losing trades into winning trades by using a smart "back-and-forth" hedging mechanism. Let the price move to anywhere it likes - the awesome CAP Zone Recovery EA will make profits out of the situation. The secret behind this amazing EA is a famous trading algorithm known as "Zone recovery algorithm" or "The Surefire Forex Hedging Strategy".
CAP Zone Recovery EA MT4 is extremely easy to use. You just open a trade in a trending market - no matter wh

This simple visual expert advisor allows you to trade easily from the chart. It handles risk management for you and can perform several useful tasks with your existing trades, saving time and making risk-management for each individual trade easier. [ Installation Guide | Update Guide | Troubleshooting | FAQ | All Products ] Trade easily from the chart Trade with precise risk management, hassle free Trade pending order with drag and drop price selection Set SL and TP levels with drag and drop pr

The indicator can help traders to assess in advance the number of Lots, Balance and Equity, if the price deviates from the current levels. The indicator will be useful for those who trade using grid strategies or Martingale.
Features The indicator belongs to the category of risk management . It will be useful for the traders who usually have a lot of open orders on one instrument. The indicator helps to assess in advance the account change that would happen in case of possible price change from
Operation principles Non-linear TrailingStop ! The Expert Advisor works on any timeframe and currency pair. Multiple indicators are analyzed during the EA operation. If the required conditions are met, a market order is placed. The EA does not open the next order until the previous one closes.
Important! The significant part of this EA is the TrailingStop block, making the StopLoss follow the price. The main difference between this block from the standard one is that it is not linear. Specify t

The ZUP is based on two ideas. Idea 1 - combine a variety of methods for identifying extremums (minimums and maximums) on the market price charts in a single indicator. Idea 2 - make it possible to easily bind various graphical tools, which allow to analyze the market behavior, to the identified extremums. To implement the first idea , the following has been made in the indicator. Included multiple ZigZag algorithms. Standard ZIGZAG algorithm. The basis of this algorithm is taken from the ZigZag
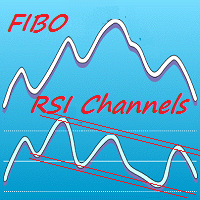
Colored indicator of the linear channels based on the Fibonacci sequence for the RSI. It is used for making trading decisions and analyzing market sentiment. The channel/channels boundaries represent strong support/resistance levels, as they are the Fibonacci proportion levels. Users can select the number of displayed lines of channel boundaries on the chart by means of the input parameters. Various options for using the indicator are shown in the screenshots. The middle of the channel is shown

Femade Indie Vs 1.0 is a simple but multi-currency monitoring Indicator created to instantly notify the trader when an attached currency pair is ready to buy, sell or give signal when such currency pair is getting ready for a big move either up or down. It does this by visual aids on the screen charts, sound and pop-up alerts. If it shows " Medium ", this means that the so called currency signal is almost gone but can still be traded provided the trader will not need a lot of pips which can be b
The strategy is based on my template and is based on the AO and AC indicators. It buys at two green AO and AC, sells at two red AO and AC. The EA has been adapted for four- and five-digit quotes. VPS server is recommended. Before installing on a real trading account, it is recommended to test the parameters on 99.90% quotes at least for the last year. If you need any help, send me a private message. Advantages of the EA template It is possible to combine different capabilities of the template to

Listo Scalper is a fully automated Expert Advisor designed for Traders. Listo Scalp using several indicators. Recommendations for EA use EURUSD, GBPUSD, USDJPY. This robot trades on any Time Frame, please use this EA on M5 timeframe. The system is ready-to-use with the setup is simple,with simple optimization on Take Profit, Stop Loss, and Trailing. Please use a good broker with low spread.
Input Parameters OrderCmt = used for comments Magic = 256 - magic number to identify the order's mode for

The strategy is based on my template and is based on the search and comparison of the unidirectional bars on different timeframes (up to 5). If the bar is bullish and it body is greater than its wick, open a buy trade, if bearish - sell. The EA has been adapted for four- and five-digit quotes. VPS server is recommended. Before installing on a real trading account, it is recommended to test the parameters on 99.90% quotes at least for the last year. If you need any help, send me a private message

The Panda EA trading system is based on the analysis of price action, and it monitors the trend reversals. The operation principle is similar to trailing stop, with the exception that this system helps in finding the entry points, plus additional filters.
Parameters Level: Level of the price channel (in points), for the analysis. The_number_of_levels: The number of levels. StopLoss: Stop loss. TakeProfit: Take Profit. TrailingStop: Trailing stop, works based on the order opening price, set 0 to
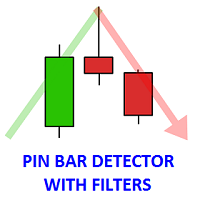
The indicator finds the Pin bars on the chart, perhaps, the most powerful Price Action pattern. The indicator has additional filters, and the user can: specify all parameters of the pin bar size as a percentage of the total candle size (minimum length of the large wick, maximum values of the short wick and body size). set the number of fractals for the last N bars, the Pin bar is based on, i.e. define the support/resistance levels. specify the required number of bearish/bullish bars before the P

A script for closing all open positions in one click. It has no settings, you only need to save it to folder ...\mql4\scripts folder and restart the terminal. A click on the script will close all open positions with the best possible time. Works on all types of accounts with all currency pairs and any broker. The number of open positions is not limited.
The script will be useful for trading strategies, in which you need to manage a large number of orders.

Hi Traders, This useful product will Helps you to get 28 currencies power meter as indicator buffers for use in Expert Advisors and other Indicators . You can get them as buffers 0-27 for current candle. Buffers Value - This values are between -100 to +100 ("-" for Bearish Trend, "+" for Bullish Tread), For Ex. if EURUSD's Buffer is +37 it means it is in a bullish trend and bigger values is better for us. Time Frames - In all time frames you will get same values for each buffer (thy are not depe
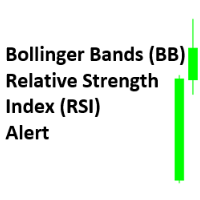
Bollinger Bands (BB) + Relative Strength Index (RSI) + Alert
Many traders are interested in the Reversal Strategy. The indicators Bollinger Bands (BB) and the Relative Strength Index (RSI) are suitable for this strategy. The indicator offered here combines Bollinger Bands (BB) and the Relative Strength Index (RSI) to get pop-up and sound alerts. This supports you especially when trading multiple currency pairs. For this strategy a periodicity of for example >30 minutes could be appropriate.
T

L'indicatore AIS Correct Averages consente di impostare l'inizio di un movimento di tendenza nel mercato. Un'altra importante qualità dell'indicatore è un chiaro segnale della fine del trend. L'indicatore non viene ridisegnato o ricalcolato.
Valori visualizzati h_AE - limite superiore del canale AE
l_AE - limite inferiore del canale AE
h_EC - Valore previsto alto per la barra corrente
l_EC - Valore previsto basso per la barra corrente
Segnali quando si lavora con l'indicatore Il segnale pr

Professional Trend Indicator Ti indicator is based on its own oscillator and shows you trend changes .
Indicator includes adjustable Polynomial and MAs channels , Trend lines and Oscillator filter with whom you can adjust the spread of indicator.
You can run many instances, for all time frames at once, is very fast and has a built-in " slider history testing " technology and “ Error control ”.
Program operates in 2 automatic modes:
1. Slider mode
Turns on when attaching the indicator to the Cha

Colored indicator of the linear channel based on the Fibonacci sequence. It is used for making trading decisions and analyzing market sentiment. The channel boundaries represent strong support/resistance levels, as they are the Fibonacci proportion levels. Users can select the number of displayed lines of channel boundaries on the chart by means of the input parameters. Attaching multiple instances of the indicator to the chart with different calculation periods leads to displaying a system of c
The CAP Equity Guard MT5 is an expert advisor that constantly monitors the equity of your trading account and prevents costly drawdowns. The CAP Equity Guard EA MT5 is a useful tool for money managers! When an emergency procedure takes place, you are notified by visual, email and push alerts. The EA performs the following tasks: It monitors your entire trading account. Easy to use! Just drag it to a random empty chart. It will work perfectly, if MetaTrader restarts. It can be workable with yo

The Expert Advisor works on any timeframe and currency pair. A large spectrum of variables and indicators is analyzed during the EA operation. If the required conditions are met, a pending order is placed. The EA does not open the next order until the previous one closes. The EA contains the TrailingStop block making STOPLOSS follow the price. It is the most efficient on the EURUSD, GBPUSD, USDCHF currency pairs, but it can also be used on any other pair. For best results, run the expert at a br

Price Pressure indicator is capable to determine the total result of buy/sell pressure. The result is given in Average True Range (ATR) percent. Price Pressure analyze price action determining how much pressure is present for each candle. Buying or Selling pressure is cumulative, and the more bear/bull bodies and the larger the bodies, the more likely it is that the pressure will reach a critical point and overwhelm the bulls/bears and drive the market down/up. Strong bulls create buying pressur
Colored indicator of the linear channel. Plotting and calculation is based on the Keltner method. It is used for making trading decisions and analyzing market sentiment. The input parameters provide the ability to adjust the channel on the chart. Attaching multiple instances of the indicator to the chart with different calculation periods leads to displaying a system of channels on the chart. Various options for plotting the channel are shown in the screenshots.
Purpose The indicator can be use

DSS is similar to Stochastic except for this Indicator we use what is called double exponentially smoothing. This will give the trader a more speedy response to price changes which tends to smooth out the erratic movements of a regular Stochastic. Because its always best to know what the larger timeframes are doing. I have adopted the tactic of overlaying the larger chart of DSS over the smaller chart to gauge whats going on overall and to pint point best entry or exit points. I have left it adj
FREE

Convergence is when the higher highs and higher lows of an uptrend are also confirmed by our indicator making lower lows which helps us confirm that momentum is increasing and so the trend is likely to continue. Vice versa for a downtrend. Divergence is when we get higher highs on an uptrend but which are not supported by our indicator which makes lower highs and therefore signals the underlying momentum is failing and so a reversal might occur. Vice versa for downtrend. I have combined these me
FREE

Free parabolic SAR expert advisor is a completely free expert advisor that trades using Parabolic SAR dots. It opens and closes trades based on the first dots of a new trend. The various settings are explained below.
Parameters NOTE: The default settings are just place holders and not necessarily the best. Use the settings that best suites you or your strategy. Lots - This is the lot size of the EAs trades. 0.1 is the default setting. StopLoss - Stop loss setting. AllowBuy - Set to true to allo
FREE

xCalper Economic Calendar MT4 brings economic calendar information to your Terminal chart and Experts from online sources. Just add it to your chart to see detailed news without losing attention or automate reading of calendar information to improve trading decisions.
Main Features Support data sources: Forex Factory Filtering by day, impact or currency of news. Visual alert of upcoming news. Platform notification of upcoming news.
Parameters Filters Impact expected - Show/Hide by impact: Low,
FREE

Liti Boma Scalper is a fully automated Expert Advisor designed for Traders. Liti Boma Scalper using several indicators. The EA uses EURUSD, GBPUSD. This robot trades on any Time Frame, please use this EA on M1 or M5 timeframe. The system is ready-to-use with the setup is simple, with simple optimization on Take Profit, Stop Loss, and Trailing. Please use a good broker with low spread.
Input Parameters OrderCmt = used for comments Magic = 525 magic number to identify the order's mode for the EA.

The Expert Advisor is based on a simple strategy: open a trade if the price moves away from MovingAverage indicator to a given distance. The EA uses only market orders applying the Open level modification algorithm for opening orders at new prices that are most close to the market. All trades are closed by order baskets in the direction of trading applying multiple currencies (if allowed by Inp_Multicurrency). The EA has been adapted for four- and five-digit quotes. VPS server is recommended. Ch

The "Karina" Expert Advisor trades based on the signals of the Several Moving Average indicator and "averaging" of the open orders. The signals are filtered based on the Relative Strength Index indicator. The TakeProfit(TP) level is set when opening the first deal. If the market reverses, new orders will be opened in the direction of the first order, followed by "covering" of losing orders with profitable ones. It is recommended to have a large deposit and/or cent account in order to use this EA

The Expert Advisor uses the strategy of breakdown or rollback from the price channel drawn based on the High and Low over a selected period. The EA Only works with market orders using the modification of order opening levels at new prices, which are closer to the market, which allows opening positions at a better price. All trades are closed using baskets of orders in the trade direction using multicurrency approach (if enabled in the Inp_Multicurrency parameter). The EA is adjusted for 4-, 5-di
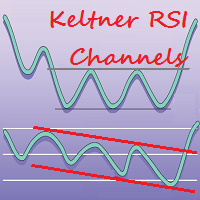
This is a color indicator of linear channel for RSI. The indicator and its calculations are based on Keltner's methodology. It is used for making trading decisions and analyzing market sentiment. Input parameters allow the user to customize the channel/channels. The indicator allows drawing two channels on a single chart of the RSI indicator. Possible options for channel drawing are shown in the screenshots.
Purpose The indicator can be used for manual or automated trading within an Expert Advi

The Expert Advisor allows to move the stop loss following the price, which gives you the ability to protect the floating profit from sudden price reversals. It is possible to use a simple trailing stop which moves the stop loss at the specified distance from the price, as well as based others based on various indicators.
Parameters Magic - unique magic number for identifying positions, if 0 - no number; Trailing - select the type of trailing stop: Simple, Fractals, ParabolicSar, ZigZag; Trailin
FREE
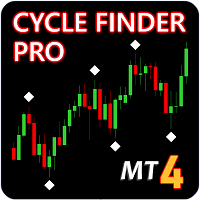
Update - Version 4.0 now includes trend change signal. Indicator will tell you the current trend on all charts. Update - Version 5.0 now includes alerts for mt4, push and email notifications.
Cycle Finder Pro is a chart reading indicator and is designed for trend and pattern traders . Chart reading is time consuming and complex and requires knowledge of price action , cyclicity, and time frame correlation . Cycle Finder Pro reads all this in one simple indicator so you can spot trend and char
This is the linear regression indicator for basic indicators included in the standard package of the MetaTrader 4 terminal. It is used for the analysis of price movements and market mood. The market mood is judged by the slope of the linear regression and price being below or above this line. Regression line breakthrough by the indicator line may serve as a market entry signal. There is possibility of setting the color for bullish and bearish sentiments of the basic indicators as well as plottin

The Hedging indicator is a trading tool, allowing to exit a floating loss that results from erroneous trades by using hedging of trade results. This tool also allows you to solve the problem of negative locking. Hedging of trade results means their simultaneous closing TakeProfit and Stop Loss calculated by the indicator. The indicator takes into account the volume of opened positions! When the number or volume of trades is increased or reduced, the TakeProfit and StopLoss levels are automatical

The HedgingScript utility is a trading tool, allowing to exit a floating loss that results from erroneous trades by using hedging of trade results. This tool also allows you to solve the problem of negative locking. Hedging of trade results means their simultaneous closing TakeProfit and Stop Loss calculated by the script. The script takes into account the volume of opened positions! However, if the number or volume of trades is increased, the script should be relaunched on the chart! The TakePr

The Open Line indicator is a simple indicator that tracks the opening levels of more time sessions. This version allows the user to check the opening levels using different time time frames. It is possible to add on the same chart different Open Lines to have more important horizontal levels. The colors and lines are fully customizable also for the label text. A simple indicator but very powerful to give you a proper orientation for your trading.
Input Values TimeFrame (to show the open price t

Eldorado MT4 is a new MetaTrader 4 indicator based on a digital filter, it has been developed by a professional trader. By purchasing this indicator, you will receive: Excellent indicator signals! Free product support. Regular updates. You can use it on any financial instrument (Forex, CFD, options) and timeframe. Simple indicator setup, minimum parameters. Signals for Position Opening: Open Buy when the channel goes up. Open Sell when the channel goes down. Recommended Usage It is recommended t
The Expert Advisor receives signals from an artificial neural network that uses the RSI indicator. Trades are closed by the opposite signals. Presence of a signal is checked at the closing of the bar. The EA also has the following functions: changing a position volume in proportion to the change in balance (function for the tester); transfer of unprofitable trades into breakeven;
Parameters Start with lot - initial position volume increased in proportion to the balance change; Lotsize by balanc
FREE

Record Session High Trader uses the concepts of within candlesticks trading to gauge when a trend might be wearing out and therefore ready for reversal or pause simply by looking at the candles. We call it a record session high when we get 8 or more previous candles that have higher closes. We call it a record session low when we get 8 or more previous candles that have lower closes. We don't rely on the typical Oscillation Indicators for recognizing overbought or oversold but more we rely on lo
FREE

Slow Pips OCO Trade Panel is an advanced trading panel for placing pending orders. Traders can use this panel to place two pending orders at once. One pending order would be of buy entry type and the other one would be of sell entry type. Both orders will have Stop Loss and Take Profit parameters. Since two pending orders are placed at the same time, the pending order for which the price hits first gets converted into a market order and the other pending order gets deleted (one order cancels the

Medium-term trading system that tries to profit during the price rollbacks after significant movements. The system automatically determines the current trading range, the price rollback levels. This is a demonstration version of the Algorithmic EA, which is optimized over the year 2016 for trading the EURUSD currency pair. It is possible to trade in manual mode using a simple on-screen panel or in fully automatic mode. Amount of trades per month is from 5 to 18 in automatic mode. The recommended
FREE

News Detector -the robot allows placing market or pending orders with a single click on the panel. The EA is a good assistant for scalping, news trading and for opening a multitude deals. The robot consists of a calendar and the News Trade Panel . The orders for the selected news can be placed either manually or automatically. The lines indicate distance for placing the order. The EA trades the pair it is attached to. The trailing stop and breakeven features will take care of the deal, in case i
The True Macd Range Expert Advisor is based on the standard MACD and ATR indicators. A market entry is performed according to indicators' aggregate signals using stop levels and trailing. The EA utilizes averaging and martingale, as well as the function of recovery from a loss.
System settings averaging included – enable averaging. averaging only on signal – average only by a signal. closing by opposite signal – close in case of an opposite signal. martingale mode – martingale type. recovery mo

The Averaging indicator is designed for traders who trade using averaging techniques or from time to time need to exit a floating loss resulting from erroneous trades by averaging trade results. Averaging of results means closing trades by TakeProfit calculated by the indicator. The indicator takes into account the volume of opened positions! When the number or volume of trades is increased or reduced, the TakeProfit level is automatically recalculated! The recommended TakeProfit level is displa

The Averaging utility is designed for one-time use and is intended for traders who trade using averaging techniques or from time to time need to exit a floating loss resulting from erroneous trades by averaging trade results. Averaging of results means closing trades by TakeProfit calculated by the script. The script takes into account the volume of opened positions! However, if the number or volume of trades is increased, the script should be relaunched on the chart! The total result of trades

HandMarket is an interactive trading robot. It works inside various market formations (descending and ascending trend channel, horizontal, narrowing or expanding flat, triangle, flag, etc.) The lines limiting these formations should be set by the user.
Strategy Features Computer algorithms cannot precisely determine trend channels and other market shapes. Only a human can do it correctly. Using this robot, a person can draw a selected shape on the chart and trade inside the selected area. When

如果产品有任何问题或者您需要在此产品上添加功能,请联系我 Contact/message me if you encounter any issue using the product or need extra feature to add on the base version.
PA Touching Alert is a tool to free you from watching price to touch certain critical price level all day alone. With this tool, you can set two price levels: upper price and lower price, which should be greater than/ less than the current price respectively. Then once price touches the upper price or lower price, alert and/or notification would be sent
FREE

Market Pressure Dashboard is a new generation utility. Its main function is to assist you and give you operational ideas optimizing your analytical work. Using this utility you could monitor a lots of financial instruments (max 28 symbols FOREX) in a very simple way. The Market Pressure indicator allows you to customize the internal list of the symbols to be monitored. The opening function and position management with this panel will be much more comfortable and navigation charts very powerful.

The Leonardo Expert Advisor is based purely on price action. It trades according to two trading algorithms using pending orders. This system doesn't use breakout, indicators, grid, martingales or hedge management, it is based solely on price action and is not overloaded with a multitude of filters. The EA has been tested on EURUSD M5, USDJPY M5 with 99.9% modeling quality. The EA does not need any kind of complicated setup and is ready to work with multiple symbols and timeframes. The EA is opti

The Carousel FX AVG is stable intraday Expert Advisor for automated Forex trading. One of the features of the Carousel FX AVG Expert Advisor is the intraday trading according to the mathematical model that calculates the movement of the quotes. It also performs hedging opposite to the open unprofitable positions within the specified channel. Channel is based on the historical data of the quote movement for the last 8 years. Market entry is are made at the opening of the Tokyo session. As a rule,

This trade panel is able to greatly simplify the work for news traders. The utility allows to place market or pending orders with a single mouse click. The trade panel is a good assistant for scalping, news trading and for opening a multitude deals. The orders are placed manually, the lines indicate distance for placing the orders. The trailing stop and breakeven features will take care of the deal, in case it is unable to reach the take profit level. The trade panel can work with both limit and

Market Hour Indicator is one the most useful indicators for the traders who trade in different markets. The indicator highlights the area in the chart during which a particular market is open. It operates on four different markets i.e. New York Stock Exchange, Australian Stock Exchange, Tokyo Stock Exchange and London Stock Exchange. The indicator is intended for use on M1, M5, M15, M30 and H1 time frames only.
Input Parameters NYSEMarket: Enable/Disable for NYSE market NYSEMarketOpeningTime: S

A universal Expert Advisor: Multi-currency, CFD, Metals. Designed for scalpers, intraday traders, and investors. The Expert Advisor works on all timeframes without losing its profitability. Entry signals are produced by the fiji_bb_alert indicator. The indicator has flexible settings. This indicator has been specifically selected. This allows any trader to configure specific trading style.
Features It provides separate buttons to start and stop the EA. You can find various new things due to dif
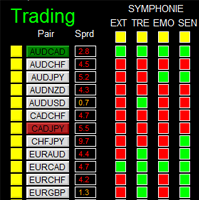
如果产品有任何问题或者您需要在此产品上添加功能,请联系我 Contact/message me if you encounter any issue using the product or need extra feature to add on the base version.
There is Demo version of this panel Dashboard Symphonie Trader System Demo in my product list, please try it out to get familiar with all functionalities free, LINK . This system basically utilizes Symphonie Indicator Set (Extreme, Emotion, Trend, and Sentiment) as the core indicators to generate trading signal mainly on time-frame M15. The signal will b
This is a colored multi-timeframe liner regression indicator. It is used for the analysis of price movements and market mood. The market mood is judged by the slope of the linear regression and price being below or above this line.
Purpose The indicator can be used for manual or automated trading within an Expert Advisor. Values of indicator buffer of the double type can be used for automated trading: Regression line of M1 period - buffer 0. Regression line of M5 period - buffer 1. Regression l

Dear friend, I'm glad you're interested in the results of my work and you want to understand how to use this tool better. Here I will try to explain in detail and clearly what works and how to do to set everything up, as well as to get pleasure and profit from the results of my labors. If you liked it, I'll be really happy to see the positive feedback on the Market:)
Currency pairs: EURUSD, GBPUSD - they are the main ones and give good profits right now! (USDJPY, USDCHF, AUDUSD, USDCAD on re

The BarKhan indicator is calculated as sum of differences of three digital moving averages. The calculation formula is as follows: the difference of digital moving averages 1 and 2 is added to the difference of digital moving averages 2 and 3 Description of the indicator settings: MA_Period1 - the period of the first digital moving average MA_Period2 - the period of the second digital moving average MA_Period3 - the period of the third digital moving average

L'indicatore Risk Reward è uno strumento molto utile che permette di osservare in tempo reale il rischio di performance di un trade.
Il suo utilizzo è molto semplice, basta trascinarlo nel grafico e vedere la percentuale di Risk Reward (es: 1:2).
Abbiamo previsto anche la possibilità di allungare/ridurre le linee al fine di rispettare i livelli di prezzo importanti.
Puoi cambiare i tuoi livelli cliccando direttamente sulle linee e trascinando il livello in una nuova posizione.
I livelli ver
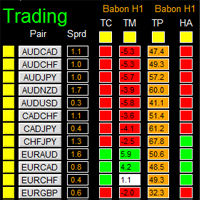
如果产品有任何问题或者您需要在此产品上添加功能,请联系我 Contact/message me if you encounter any issue using the product or need extra feature to add on the base version.
There is Demo version of this panel Dashboard Babon Scalping System Demo in my product list, please try it out to get familiar with all functionalities for free, LINK . This system basically utilizes TDI, Heiken Ashi Trend, Price Trend on H1 time-frame and TMA on H1&H4 time-frame to generate the trend (big picture). Then the system will zoom in to genera
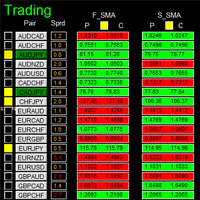
如果产品有任何问题或者您需要在此产品上添加功能,请联系我 Contact/message me if you encounter any issue using the product or need extra feature to add on the base version.
This system basically utilizes two simple moving averages (10 SMA and 197 SMA) over 2 hours before Tokyo Open to generate trading signal mainly on timeframe H1. The signal will be further filtered by 1) M15 and M5 Fractals; 2) Stochastic To facilitate you to understand and trade this system quickly and effectively, the collection of PDF manuals and tips

OCO News Order Manager in an Expert Advisor to Trading News . The usability makes this tool an excellent ally for FAST operations on NEWS Time. We recommend that you try it on demo account to understand what kind of decimals using your broker to set your input values. The EA is usable on every Markets. On news time the spread could be manage from Broker, please make attention.
Main functionalities Open STOP PENDINGS ORDER a number of seconds (in input) before News Time Floating of pending order
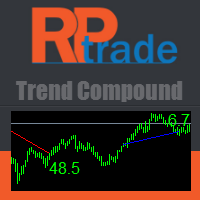
Trend Compound is a trend indicator using a mix of 3 internal other indicators. Please have a look at "how to test in the tester" at the bottom of this page before to test. It's designed to be used by anyone, even the complete newbie in trading can use it. Trend Compound does not repaint . Indications are given from close to close. Trend Compound can be used alone , no other indicators are required.
Trend Compound indicates Where to open your trades. When to close them. The potential quantity o

The indicator is based on a single Moving Average of a user-defined period. By analyzing the price movement of the price relative to this MA, and also by tracking all updates of the price Highs and Lows over the same period as the MA period, the indicator draws its own picture of the trend, avoiding the ever-breaking MA lines. Therefore, if the trend goes up, the line will also point upwards and will not change its direction even on small retracements, allowing to capture almost the entire trend
FREE

Free RSI expert advisor is a completely free expert advisor that trades using rsi level crosses. You can set which levels the Ea should use to open and close trades. The various settings are explained below. NOTE: The default settings are just place holders and not necessarily the best. Use the settings that best suites you or your strategy. Lots - This is the lot size of the EAs trades. 0.1 is the default setting. AllowBuy - Set to true to allow buy trades. This setting is true by default. Allo
FREE

This indicator shows the value of returns in the selected time frame .
They are calculated as logarithm of returns , rather than price or raw returns. For small returns, arithmetic and logarithmic returns will be similar. The benefit of using returns, versus prices, is normalization. It is possible measures all variables in a comparable metric despite originating from price series of unequal values.
Inputs You can display data both as a Histogram or a Line It's also possible to display th
FREE

This utility binds each created graphical object to the chart symbol. Binding is performed by adding a symbol prefix to a graphical object name. Later, after you change the symbol on the chart, it provides displaying only the objects binded to the current symbol and all other objects become hidden.
Parameters Ignore objects with prefix - the indicator will skip graphical objects with the specified prefix in their names. Note: demo version from the market is limited to strategy tester and cannot
FREE
Scopri come acquistare un robot di trading dal MetaTrader Market, il negozio di applicazioni per la piattaforma MetaTrader.
Il sistema di pagamento di MQL5.community supporta le transazioni tramite PayPal, carte bancarie e gli altri sistemi di pagamento più diffusi. Per essere pienamente soddisfatto, ti consigliamo vivamente di testare il robot di trading prima di acquistarlo.
Ti stai perdendo delle opportunità di trading:
- App di trading gratuite
- Oltre 8.000 segnali per il copy trading
- Notizie economiche per esplorare i mercati finanziari
Registrazione
Accedi
Se non hai un account, registrati
Consenti l'uso dei cookie per accedere al sito MQL5.com.
Abilita le impostazioni necessarie nel browser, altrimenti non sarà possibile accedere.