Guarda i video tutorial del Market su YouTube
Come acquistare un Robot di Trading o un indicatore
Esegui il tuo EA
hosting virtuale
hosting virtuale
Prova un indicatore/robot di trading prima di acquistarlo
Vuoi guadagnare nel Market?
Come presentare un prodotto per venderlo con successo
Indicatori tecnici per MetaTrader 4 - 130
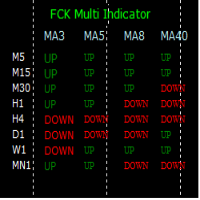
The FCK Multi Indicator for MT4 displays trend direction of multiple indicators on multiple time frames for a pair. So, forex traders can see the trend direction at a snap and trade with confluence of multiple indicators. Furthermore, it helps traders to see the trend in multiple time frames and trade in the direction of the overall market trend. Additionally, it shows the stop loss, pips to stop, pips in profit of any open position. The indicator display is very neat and is very helpful for bot

Daily supply and demand levels for breakouts or reversals. Use on 1 Hour charts No nonsense, for the confident trader who trades price action supply and demand levels with daily projections without the fluff using 1 Hour charts. MT5 Version: https://www.mql5.com/en/market/product/108522 The Bank Trader Indicator is a sophisticated tool employed by institutional traders, particularly those in banking institutions, to navigate the complex world of forex markets. Rooted in the principles of daily
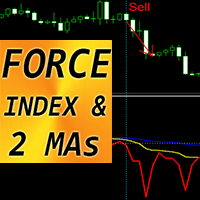
Forex Indicator "FORCE index and 2 Moving Averages" for MT4 This indicator is excellent for Momentum trading into the trend direction. " FORCE index and 2 Moving Averages" Indicator allows you to see Fast and Slow Moving Averages of Force index Force index is one of the top indicators that combines price and volume data into a single value Force index itself is powerful oscillator - that measures the amount of power used to move the price Indicator gives opportunities to see the t
STOCH ARROW is a long short arrow signal type indicator that is based on standard stochastic oscillator this indicator has 3 methods of giving long and short signal that are as follow : 1.whenever stochastic lines cross 2.when a cross happens in overbought and oversold zones (short arrow on overbought zone cross , long arrow on oversold zone cross) 3.when stochastic lines leave overbought and oversold zones (short arrow on leave from overbought zone , long arrow leave on oversold zone) this ind
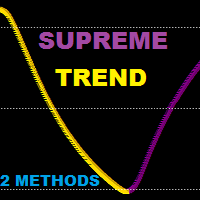
Supreme Trend is a reversal/continuation type Oscillator type indicator that is based on Moving average and stochastic indicators this indicator can be used in two methods : Reversal Method : short when golden arrow appear after arrows were above upper level (e.g 70) Reversal Method : long when Purple arrow appear after arrows were below lower level (e.g 30) Trend Method : long when arrows cross above 50 level line , short when arrows cross below 50 level line. use higher ma and stochastic peri

Introducing the South African Sniper indicator created by a small group of traders with a few years trading trading the financial market profitably . This is a plug and play indicator that provides you with BUY and SELL (SNIPER ENTRY) signals with TARGET and trail stops. The indicator Works with all MT4 trading instruments. The indicator uses previous chart data as receipt to speculate on future market moves.
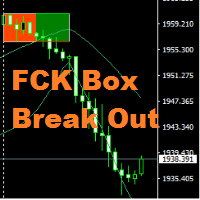
Hi All, " FCK Box Break Out " indicator is very simple indicator for new users. You can choose which indicators and timeframes you want to calculate. "FCK Box Break Out" provides the day's trend for buy/sell trades. Opposite side you the stop loss or hedging trade. NON-REPAINT Buy/Sell signals Recommendations Timeframes: Recommended - H 1 (Still, EA technically works on any Time frames ) Spread : up to 20 Recommended pairs: works on any metal, indices and currency pair

Title: "Daotradingfx - The Perfect Key for Wave Trading with 7 Years of Experience"
Forex trading is never easy, but with the daotradingfx indicator, I have found a reliable partner, unlocking the door to success in wave trading. Built on the foundation of my 7 years of trading experience, this indicator is not just a tool; it is a comprehensive canvas of market understanding and convenience in trading.
Daotradingfx stands out with its ability to use multiple timeframes, a crucial feature t
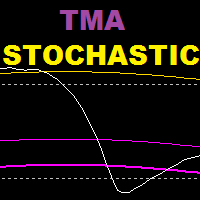
TMA Stochastic è un indicatore basato sull'oscillatore stocastico e sull'indicatore delle bande tma, questo indicatore si basa su una strategia di inversione.
Periodo di tempo consigliato: 15 e oltre
Impostazioni consigliate: valori più bassi per lo scalping, valori più alti per lo swing trading
================================================== =====================
Parametri:
Storia tma: quante barre indietro per mostrare le bande tma sullo stocastico
Periodo K (stocastico)
Peri

L'obiettivo dell'indicatore "Black Horse" è identificare le divergenze tra l'andamento dei prezzi e l'indicatore VWAP. Utilizza filtri per eliminare potenziali divergenze false e segnalare avvisi di alta qualità e precisi.
Le divergenze ribassiste sono indicate da punti rossi sopra la candela, mentre le divergenze rialziste sono rappresentate da punti verdi sotto la candela.
Il principale filtro per le divergenze si basa sull'ATR (Average True Range) e sul movimento dei prezzi nelle candele
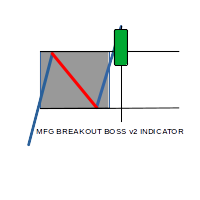
MFG breakout boss indicator is a Semi Autom ated Asian session range breakout System which seeks to identify the High and low of the asian session when the Market is ranging with no major movement, With the help of sofisticated Algorithm within the system, a breakout in either direction coupled with momentum the system gives High Accurate entries, with predefined Stop loss and 3 Take profit levels.
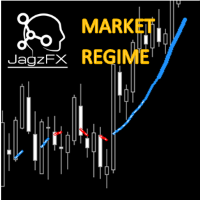
Elevate your trading with the JagzFX Market Regime Filter—adapt, optimize, succeed in navigating through smooth or volatile price movements. Gain a deeper understanding of market dynamics to refine your strategy and make informed decisions. KEY FEATURES Price Action Analysis: Distinguishes between smooth and volatile price movements. Trend Identification: Pinpoints bullish or bearish trends with precision. Strength Assessment : Evaluates the strength of identified trends—whether strong or weak M
Доброго времени суток уважаемые трейдеры и инвесторы.
Вашему вниманию предлагается индикатор, определяющий за любой промежуток времени : Максимальную цену. Минимальную цену. 50 % от от максимума до минимума. Цену закрытия периода. Кроме того, в зависимости от настроек - индикатор может добавлять 10 процентных уровней как вниз, так и вверх, эти уровни указываются, но по стандарту начинаются от 50% с шагом 50% до 500%. В обе стороны. Индикатор реализован максимально удобно, при смене тайм-фрейма

The Waddah Attar Explosion (WAE) indicator is a potent tool in Forex trading, offering buy, sell, exit buy, and exit sell signals. It assesses trends as trend power and momentum as explosion power.
Trend Direction: - Green bars indicate a bullish trend. - Red bars indicate a bearish trend.
Signal Line: - A line serves as a threshold for momentum.
Buy Trade Setup: **Entry:** Go long when a green bar crosses above the threshold. Place a stop loss below the entry candle. **Exit:** Close the
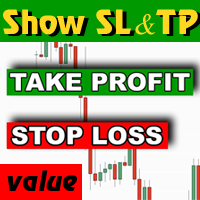
In MetaTrader, TP & SL values aren't visible when hovering over corresponding lines. Our indicator fixes this by showing values on-screen. It displays defined SL and TP values in your account currency, facilitating easy tracking of positions. Note : The indicator estimates values, excluding commissions, and allows customization of colors and distance from SL/TP lines.
SURE REVERSAL is a histogram overbought/oversold type indicator that gives key reversal points that indicates a bull or bear market movment this indicator is fusion between moving average and the rsi indicator ,this indicator is non repainter , and is not delayed . Parameters : Ma period Ma Method Ma Price Sure Period (Rsi) Sure Price (Rsi) ==============

"Trend reversal ml4" is a unique indicator designed to determine the moments of price reversal in real time. This is a ready-made trading system for Metatrader4. The indicator does not redraw its values! Based on advanced algorithms and technical analysis, this indicator provides you with clear signals about possible market entry and exit points, helping you make informed decisions.
Advantages of the indicator: high signal accuracy. the indicator itself shows the trader whether it is configur

SX Currency Strength indicator allows users to analyze currency strength through a selected period, with results resetting periodically and accumulating thereafter. It displays the historical relative strength of eight major currencies (USD, EUR, GBP, JPY, AUD, CHF, CAD and NZD) across a selected timeframe. Assessing a currency's relative strength aids in evaluating its performance against a basket of other currencies. Users can select to visualize relative strength of the currencies in the shap

Il pr ezzo aumenterà di 30 dollari dopo ogni vendita di 5 copie.
L'indicatore principale mira a individuare la tendenza generale del mercato. Il sistema di colori, con colori chiari e scuri, cerca di identificare condizioni di mercato forti e deboli.
Secondo la mia opinione, questo indicatore è insuperabile; funziona in modo eccezionale quando il mercato inizia a muoversi.
Se preferisci utilizzare l'indicatore su un periodo più lungo, come ad esempio 1 ora, 4 ore o giornaliero, per otte

TREND HARMONY MT4 – Multi Timeframe Trend and Phase and Pullback Level Visualizer indicator for Metatrader4 The TREND HARMONY indicator automates deep trend analysis and generates visualizations for you. Take control of your trades by eliminating uncertainty! Revolutionize your trading experience with precision and insight through the TREND HARMONY Multi Timeframe Trend Indicator – your ultimate MT4 trend visualization indicator. Are you tired of missing trading opportunities or consistently e

Pivot, support and resistance levels are one of the main indicators on the charts of any professional trader. The PivotPointsMT4 indicator will help you determine the current entry points on any currency pair and any timeframe. It is convenient because it shows historical pivot, support and resistance levels on all timeframes, and you always see what worked in the recent past. Taking into account the news context, most often it is not so difficult to determine the current level and right entry

This trend reversal arrow indicator has an alert signal that is a valuable tool for forex traders, providing several advantages that contribute to making more informed trading decisions and potentially increasing profits. Here are some advantages: Early Identification of Reversals: The primary advantage is the early identification of potential trend reversals. This arrow indicator can visually signal when a trend may be losing momentum or about to reverse, allowing traders to be proactive rather
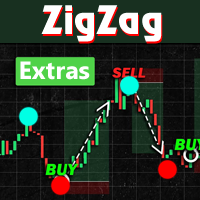
Introducing ZigZag Extras MT4, a Forex indicator that simplifies market analysis:
- Visualizes highest highs and lowest lows over a specified "Depth" period. - Highlights potential reversal points with filled blue and red dots. - Optional display of BreakOut points, indicating probable peaks and bottoms. - Helps avoid common pitfalls of mistaking repainted points for market tops or bottoms. - Designed to enhance understanding and serve as signals for various trading strategies.
Instructions
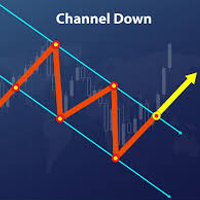
Trend channels are vital tools in technical analysis for identifying optimal buy or sell points. - Upper Line: Marks resistance. - Lower Line: Marks support. - Tops and bottoms of channels indicate potential support or resistance zones. - Bearish Channels: Negative slope (down). - Bullish Channels: Positive slope (up). Creating Channels: - Up Channel: Draw a parallel line matching the uptrend angle, touching the latest peak. - Down Channel: Draw a parallel line ma

ASR (Accurate Support Resistance) Indicator Uniqe formula behind this indicator makes it one the world's best support resistance indicator. watch the tutorial video
It is user-friendly and here are some key features : -- different calculations for swing traders and scalpers. -- the lower the accuracy number the further the lines distance is. --easily applicable on all charts. ( try to find the best accuracy number ) recommended accuracy number for Gold is 5or 6, for eurusd 6 or 7. other instru

What are Heiken Ashi Candles?
Heiken Ashi, derived from the Japanese term 'Heikin Ashi,' translates to average price bars. It's an indicator depicting price bars on a chart.
Formula for Heiken Ashi candles:
- Heiken Ashi opening price: (previous candle's opening + closing price) / 2 - Closing price Heiken Ashi: (opening + high + low + closing) / 4 - Heiken Ashi peak: Max of high, opening, or closing price - Heiken Ashi bottom price: Min of low, opening, or closing price
How to Read Heik

The MT4 Channel Standard Deviation Indicator automatically plots support and resistance channels on the price chart using price standard deviation. It indicates BULLISH and BEARISH market conditions and is suitable for both new and advanced forex traders.
This indicator offers support, resistance, entry, and exit levels, along with stop-loss and take-profit points. It accurately identifies BULLISH and BEARISH market trends, making it effective for both intraday and long-term trading across va
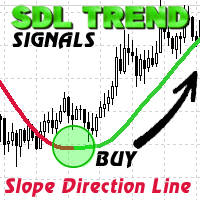
SDL Trend Signals is a custom MQL4 indicator named "Slope Direction Line" for MetaTrader 4. It employs weighted and simple moving averages to create customizable trend lines on charts.
Using two trend line buffers (Uptrend and Downtrend) and one for indicator values (ExtMapBuffer), the indicator calculates trend lines. Bullish slopes appear in BLUE, signaling an upward trend, while Bearish slopes are in RED, indicating a downward trend.
In a Bullish trend, traders can enter a BUY position w

This is a unique Gold Indicator On channel trading pullbacks and gives accurate entries on gold and major Fx Pairs on M15tf. It has the ability to pass any prop firm Challenge and get accurate entries on gold and major fx pairs.
EA FOR PROP FIRM AND CHANNEL INDICATOR IS FREE ALONG WITH THIS POWERFUL INDICATOR ALONG WITH THE BEST SET FILE FOR FIRST 25 USERS. Strategy tester report is in comment section. INDICATOR FEATURES: INDICATOR IS BEST ON M15 GIVES ACCURATE ENTRIES EA AND CHANNEL INDICAT
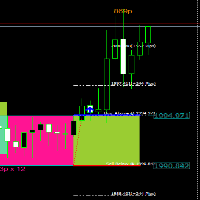
Hi All, " FCK Support Resistance BreakOut " indicator is very simple indicator for new users. You can choose which indicators and timeframes you want to calculate. " FCK Support Resistance BreakOut" that gives NON-REPAINT Buy/Sell signals "FCK Support Resistance BreakOut" provides the trend for buy/sell trades. Opposite side you the stop loss or hedging trade. * - Draws Dynamic S/R Boxes based on consolidation areas; * - consolidation areas are defined by a minimum period of time during whi

This indicator cuts right through the price, in a straight line
100% non repaint, you get a new value at the opening of each new bar
It is perfect for mean reversal strategies : open far from the line and close when the price touches the line It works really well for mean reverting pairs specially (CHF, NZD).
It has absolutely no lag when there is a sudden move up or down and follows trend exactly !
This indicator should be a must have tool in the toolbox of every trader
L'indicatore per Forex e Opzioni Binarie è scritto sulla base di 2 indicatori standard in MT4: ADX e RVI.
I segnali arrivano alle intersezioni simultanee delle linee di entrambi gli indicatori. Ma anche l'inversione dei segnali è scritta nei codici. Questo è quando i segnali vengono convertiti all'indietro. È inoltre possibile attivare e disattivare ciascuno degli indicatori. E anche in RVI, puoi usare 2 tipi di segnali: 1) solo quando una linea è sopra/sotto l'altra (questo è buono da usare

L'indicatore a quadrante per Forex e Opzioni Binarie è stato creato sulla base dei volumi di tick. A differenza di molti indicatori di volume, l'indicatore "Super volumes" calcola i volumi rialzisti e ribassisti e fornisce segnali sulla predominanza di uno di essi. Se diciamo che al momento in questo intervallo c'era un vantaggio dei volumi rialzisti, allora il segnale sarà su Buy. O se la prevalenza era di volumi ribassisti, quindi, di conseguenza, il segnale sarà su Sell.
Nelle impostazioni

About testing Mode: 1.To get the best usage experience please use the tick data to test and adjust the test speed to proper speed (tick price jump quickly but K bars scroll slowly)!!! 2.Click "Indicator Properties"-> Click "Reset" before testing the indicator to restore the default parameters of the indicator.
1. Compound Drawings (1) Line segment with arrow (2) Continuous line segment (broken line) (3) Parallelogram (4) Polygon (5) Profit and loss ratio measurement tools
2. Backtracking

An Implied Fair Value Gap (IFVG) is a three candles imbalance formation conceptualized by ICT that is based on detecting a larger candle body & then measuring the average between the two adjacent candle shadows.
This indicator automatically detects this imbalance formation on your charts and can be extended by a user set number of bars.
The IFVG average can also be extended until a new respective IFVG is detected, serving as a support/resistance line.
Alerts for the detection of bull

L'Indicatore a quadrante "Anaconda LD" è un indicatore di inversione per il mercato Forex e principalmente per le Opzioni Binarie. L'algoritmo è scritto sulla base di modelli di inversione. È meglio usarlo insieme ad altri indicatori per filtrare i segnali. Anche con quelli standard in MT4, anche altri personalizzati. Particolarmente adatti sono gli indicatori di canale o di livello...
Per diversi beni è necessario selezionare il tempo di scadenza. Che su coppie diverse compongono 1-5 barre.
L'indicatore a quadrante per opzioni binarie e Forex è un indicatore di inversione. Creato e scritto sulla base di modelli di inversione. Si consiglia per le opzioni binarie di metterlo sul grafico M5. Entra nelle offerte per 1-3 bar. Su una risorsa diversa, a seconda delle sessioni di trading, è necessario selezionare il tempo di scadenza.
È possibile modificare le impostazioni nelle variabili esterne. Pertanto, è possibile aumentare e diminuire la frequenza dei segnali. Le frecce dell'indi

How to trade with a scalping indicator: blue arrow - buy, red arrow - sell. Everything is very simple. The strategy works on all currency pairs. Recommended timeframes: M5, M15, H1, H4. No other indicators are needed for trading. The entire trading strategy is built exclusively on one trading indicator "Click Scalper". This is the latest development of scalping indicators for Metatrader4. Simply place the indicator on the chart of the currency pair and then follow the arrow directions. If a red

Are you searching for a tool that can uncover hidden market imbalances and guide your trading decisions? Look no further than the Fair Value Gap Indicator. This powerful tool acts as a magnet, pulling the price back to its starting point before making a move. By identifying these gaps on charts, you can take advantage of bearish bias trades and predict potential future price movements with greater accuracy. Created by a three-candle sequence, the Fair Value Gap Indicator is suitable for both bul

An integrated analysis system that moves the trader from the random trading stage to professional trading And seeing and understanding the market with one glance instead of moving between different charts and currencies, even in times of high liquidity
It will be easy for you to read the market with our excellent Price Action Expert signals and confirm entry opportunities With accurate analysis tools integrated into our analysis system, which we can work with on a daily basis One of the most

Consolidation is when price is moving inside a clear trading range. When prices are consolidated it shows the market maker placing orders on both sides of the market. This is mainly due to manipulate the un informed money. This indicator automatically identifies consolidation zones and plots them on the chart. The method of determining consolidation zones is based on pivot points and ATR, ensuring precise identification. The indicator also sends alert notifications to users when a new consolida
L'indicatore a quadrante "crea un segnale freddo" per il mercato delle opzioni binarie e Forex è una sorta di costruttore dei suoi segnali! In cui tu stesso Puoi scegliere le tue condizioni di segnale in base a 10 indicatori standard in MT4 e oltre a un altro indicatore buffer di terze parti, che puoi aggiungere alla variabile "buffer indicators".
È fatto semplicemente! Prescrivi il nome del tuo indicatore e prescrivi i suoi numeri (li troverai nella sezione dei colori in cui sono indicati i

Scalping and Binary Signal Detector - Indicatore di scalping che fornisce segnali direzionali per l'apertura di posizioni lungo il trend.
L'indicatore è un sistema di trading completo che può essere utilizzato per Forex e opzioni binarie.
Il sistema di algoritmi consente di riconoscere movimenti intensi di prezzo in più barre consecutive.
L'indicatore fornisce diversi tipi di avvisi per le frecce.
Funziona su qualsiasi strumento di trading e intervallo di tempo (consigliato M5 o superiore).

FireArrow is an arrow signal based indicator that give buy and sell signals with tp and sl levels , the indicator gives buy/sell signals with alert on candle close along side tp and sl levels on chart for each signal
this indicator does not repaint/back-paint and signal is not delayed.
Strategy : Open buy same moment buy arrow appear and open sell same moment a sell arrow appear , set tp as drawn on chart along side sl.
Recommended Time frame : 15 and above
this arrow is good as ? : add
Всем добрый день, Это Вадим Сергеевич Лепехо. Выложил на общее обозрение очередной свой продукт(индикатор). Индикатор прост. В этом индикаторе я добавил формулу расчета точек входа. Сам индикатор я скачал в бесплатных индикаторах в mql mt4: arrows_template(шаблон стрелок). В свойствах, описании индикатора я указал имя автора. Суть индикатора рисует стрелки, знаки куда ходить, что делать и т.д...... Стратегия входа построена на пересечении двух 'машек' (MA) с разными периодами + обьемы. Данный ин
Всем добрый день, Это Вадим Сергеевич Лепехо. Выложил на общее обозрение очередной свой продукт(индикатор). Индикатор прост. В этом индикаторе я добавил формулу расчета точек входа. Сам индикатор я скачал в бесплатных индикаторах в mql mt4: arrows_template(шаблон стрелок). В свойствах, описании индикатора я указал имя автора. Суть индикатора рисует стрелки, знаки куда ходить, что делать и т.д...... Стратегия входа построена на пересечении двух 'машек' (MA) с разными периодами, объемы, parabolic
Всем добрый день, Это Вадим Сергеевич Лепехо. Выложил на общее обозрение очередной свой продукт(индикатор). Индикатор прост. В этом индикаторе я добавил формулу расчета точек входа. Сам индикатор я скачал в бесплатных индикаторах в mql mt4: arrows_template(шаблон стрелок). В свойствах, описании индикатора я указал имя автора. Суть индикатора рисует стрелки, знаки куда ходить, что делать и т.д...... Стратегия входа построена на пересечении двух 'машек' (MA) с разными периодами? объемы, parabolic
Всем добрый день, Это Вадим Сергеевич Лепехо. Выложил на общее обозрение очередной свой продукт(индикатор). Индикатор прост. В этом индикаторе я добавил формулу расчета точек входа. Сам индикатор я скачал в бесплатных индикаторах в mql mt4: arrows_template(шаблон стрелок). В свойствах, описании индикатора я указал имя автора. Суть индикатора рисует стрелки, знаки куда ходить, что делать и т.д...... Стратегия входа построена на пересечении двух 'машек' (MA) с разными периодами, объем, parabolic s

CycleView è un indicatore che evidenzia possibili fasi di espansione e contrazione nei diversi time frame, aiuta ad evidenziare il timing corretto per effettuare l'entrata.
Il ciclo, tramite impostazioni esterne, può essere modificato.
Dopo aver installato l'indicatore, potete contattarmi per messaggio per le impostazioni e time frame migliori da utilizzare. Quando l'indicatore viene scaricato bisogna spostare il file EX4 da "Market-Expert" a "Market-indicator".

Indicator Statistics MultiPairs for MT4 1. Current Openning Ords - Symbols Openning + Buy Orders + Buy Volume + Sell Orders +Sell Volume - DrawDown by Symbols - Floating by Symbols 2. Closed Orders - Statistics by Today, Week, Month, YTD and Volume - Sum of Closed Orders by Symbol 3. Statistics by Day - Statistics by Say and Volume 4. DrawDown by Day - Each day DrawDown in Week - Percent of DrawDown Contact me at Telegram @MaiMew68

Introducing ISIS SCALPER for MetaTrader 4: Innovation Beyond the Traditional! Discover the future of trading strategies with our innovative indicator, carefully designed to transcend the limitations of conventional products. This is not just another indicator, but a flexible and powerful tool that empowers traders to explore the full potential of the market. Exceptional Features: Unlimited Versatility: Designed to adapt to any asset and time frame, our indicator allows you to create custom strat

questo codice è stato originariamente pubblicato da LuxAlgo in un altro linguaggio di programmazione.
Ha un'accettabile capacità di previsione del trend che può essere utilizzata per molti scopi di trading. ecco una descrizione del generatore di codice:
Questo indicatore si basa sugli smoothers Nadaraya-Watson pubblicati in precedenza. Abbiamo creato un indicatore di inviluppo basato sul Kernel Smoothing con avvisi integrati dagli incroci tra le estremità del prezzo e dell'inviluppo. A dif

Разворотный индикатор высчитывает все диапазоны цен за определенный период на основе исторических данных и выводит информацию ввиде уровней с цифрами,которые показывают вероятность разворота цены в процентах. Очень хорошая отработка на дневных и недельных графиках. Может применяться как отдельно для торговли,так и в связке с индикаторами уровней,разворотных паттернов,осцилляторов и скользящих средних.Работает абсолютно на всех инструментах Форекс,индексах,сырьевых товаров и акциях.

Arrow signal indicator for scalping Has three sensitivity levels
Quickly detects changes in price direction and provides signals to open positions Equipped with built-in audio and visual alerts about trend changes. Can send notifications to a smartphone or email. Works on all timeframes, all currency pairs, metals, indices and cryptocurrencies. Can be used when working with binary options.
Distinctive features Does not redraw; Three sensitivity options; Three types of alerts; Simple and cl

MR BEAST INDICATOR ATR SUPLIED AND DEMAND ¡Descubre la herramienta definitiva para la toma de decisiones financieras con nuestro asesor experto! Diseñado para operar en la vanguardia de los mercados globales, este asesor se destaca por su capacidad única para analizar tendencias en tiempo real utilizando el indicador Average True Range (ATR) y el equilibrio de oferta y demanda. Al aprovechar el ATR, nuestro asesor experto evalúa la volatilidad actual del mercado, proporcionándote una visión clar
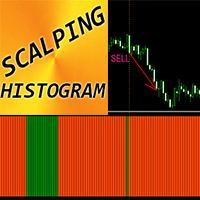
Forex Indicator "Scalping Histogram" for MT4 Scalping Histogram indicator can be used for search of entry signals into the main direction price momentum after minor price correction Scalping Histogram can be in 2 colors: orange for bearish momentum and green for bullish one . Once you see at least 10 consecutive histogram bars of the same color it means strong momentum takes place Entry signal is 1 column with opposite color in histogram and next column with initial momentu

L'indicatore per le opzioni binarie e Forex "Highway profits" si basa sul principio di trovare il prezzo dietro le linee del canale. Dopo che il prezzo supera il canale e inizia gradualmente a tornare ad esso, è allora che appariranno i segnali. Il trading di un tale indicatore è molto facile e conveniente. E possono essere scambiati anche da un trader alle prime armi o da un trader con molti anni di esperienza.
Per ogni risorsa è necessario selezionare le proprie impostazioni. Ad esempio, il

Pivots Indicator Traders have been using this indicator for a long time, but the main difference or might better call it betterment applied to well known pivots indicator is that you can change how the pivot can be illustrated. There are two ways to get the pivots on the chart. you can use either number of candles or the movement of the market using points of retracement. you can find out more on the video. furthermore pivots lines can be drawn to see the possible support and resistance prices w
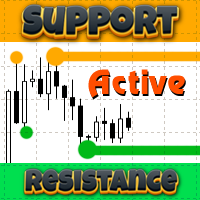
The Support Resistance Active indicator for MT4 identifies highs and lows across various timeframes, displaying support and resistance lines. Notably, previously tested highs and lows are eliminated to avoid clutter on the chart.
This indicator focuses on weekly and daily levels, termed as sell zones and buy zones. It draws support or resistance lines (fractal lines) for these zones. Tested areas are visually connected with a line, enhancing clarity on the chart.
The indicator is Multi-Time

Introducing the advanced trading tools of 2023. MTF PPAAF Model S. This is sub window version of my best trading tool : MTF Precise Price Action Arrow Filtered. Click here to learn more about MTF PPAAF . This trading tool is equipped with various powerful features : MTF = Multi Time Frame = Time Frame can be changed. On/off button. Non Repaint Arrows. Customizable parameter, color etc. Can show all time frame (ATF) crossover arrows of fast stochastic main line & fast stochastic signal line (

L'indicatore viene tradotto da un altro linguaggio di programmazione a MQL. RTI è un potente pedaggio per identificare la tendenza del grafico in modo oscillatorio.
Ecco alcune note del programmatore originale:
Panoramica Il Relative Trend Index (RTI) sviluppato da Zeiierman è un innovativo strumento di analisi tecnica progettato per misurare la forza e la direzione della tendenza del mercato. A differenza di alcuni indicatori tradizionali, l'RTI vanta una capacità distintiva di adattarsi e

L’IRDeS (Indicatore di Rilevamento Distanza e Spike) è un indicatore di forza e distanza dal livello zero, che consente di entrare nel mercato con timing quasi perfetto. È composto da una linea continua di colore blu che rileva la distanza e la volatilità dal livello zero e da un istogramma, di colore rosso sopra il livello zero e verde sotto il livello zero, che misura l’intensità e la forza della contrattazione in una determinata candela, generando una forte spinta, una "spike", in un punto sp

Martingale Arrow è un indicatore mt4 di tipo freccia progettato per il trading di opzioni binarie martingala, questa freccia viene stampata sulla barra aperta/intra bar e fornisce un avviso. COME USARE: apri l'operazione nel momento in cui appare la freccia, se l'operazione è andata a buon fine, attendi il segnale successivo e scambia lo stesso lotto. Se l'operazione perde il doppio del lotto al segnale successivo e continua a farlo fino alla vittoria del segnale, reimposta e scambia con il pri
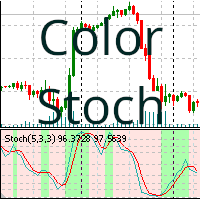
Oscillatore stocastico con colorazione
Questo indicatore colora lo sfondo in base alla tendenza dell'indicatore. L'indicatore colora lo sfondo in base al valore dell'oscillatore stocastico, indipendentemente dal fatto che si tratti di una tendenza rialzista o ribassista. Il colore dello sfondo è determinato dai parametri dell'oscillatore stocastico, eseguendo solo le ultime 400 barre (vedi note). Parametri modificabili:
%K Period : periodo %K %D Period: periodo %D Slowing: periodo di rallentam
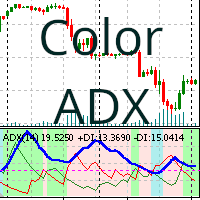
L'indicatore Average Directional Movement Index (ADX) colora lo sfondo in base alla tendenza di acquisto o vendita.
L'indicatore ADXColor è un indicatore tecnico utilizzato per misurare la forza di una tendenza. Il colore di sfondo dell'indicatore è determinato dai suoi parametri e colora solo le ultime 400 barre. I parametri che è possibile modificare sono i seguenti: Period: il periodo di tempo dell'indicatore ADX. Trend Level: il livello minimo che l'indicatore ADX deve raggiungere per esse
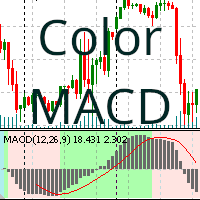
Indicatore MACD con sfondo colorato in base alla tendenza di acquisto o vendita
Questo indicatore colora lo sfondo del grafico in base al valore dell'indicatore MACD (Moving Average Convergence Divergence), a seconda della sua tendenza di acquisto o vendita. Il colore dello sfondo è determinato in base ai parametri dell'oscillatore stocastico e colora solo le ultime 400 barre (vedi note), servendo a misurare la forza di una tendenza e la probabilità di un'inversione.
I parametri che è poss

Indicator Waiting Volatility - un indicatore per determinare le zone di volatilità e le condizioni piatte.
Nel corso del tempo, il prezzo sul grafico segue trend diversi, scende, sale o rimane lo stesso. L'indicatore aiuta il trader a determinare in quale tendenza si trova il prezzo.
Nel suo lavoro utilizza diversi strumenti per l'analisi tecnica; in primo luogo, viene determinata la direzione del trend, quindi, in questa direzione, l'indicatore monitora i cambiamenti nella volatilità.
Se il

Just an excellent arrow indicator with 96 percent accuracy. It uses trend moving averages to detect trend direction change and alert with corresponding arrow. It does not repaint and the alert is optional on the basis of current bar or previous bar. Please this indicator is not responsible for every of your trading position and it must be used in conjunction with other indicators to make trading.

تمكين الصفقات الخاصة بك مع مؤشر الأمل الجيد تحقيق التكامل لنقاط دخول قوية إذا كنت تبحث عن طريقة لتحسين تداولك في الفوركس، فإن مؤشر الأمل الجيد موجود هنا لإرشادك. يتميز هذا المؤشر بقدرته على الدمج الفعال لمختلف المؤشرات المعروفة، مما يؤدي إلى نقاط دخول قوية وتحليل شامل للسوق. ما الذي يميز الأمل الجيد؟ <أ ط=0>1. تكامل المؤشر: تتفوق شركة Hope Good في استخدام مجموعة متنوعة من المؤشرات المعروفة ودمجها بشكل فعال، مما يوفر لك تحليلًا شاملاً للسوق. <أ ط=0>2. نقاط الدخول القوية: يعمل المؤشر على توليد نق

(first and original) MOLFAR – a new price rebound indicator algorithm .
NON-REPAINTING - it has appeared and will remain! NON-LAGGING - appears on time!
We really worked on the algorithm of this indicator for a long time.
It is unique, you can make sure of it both in the free version on the tester and in the full-fledged version on your account.
Description, settings and other interesting things about the MOLFAR indicator can be found here .
MOLFAR uses technical analysis, calcul
MetaTrader Market - i robot di trading e gli indicatori tecnici per trader sono disponibili nel tuo terminale di trading.
Il sistema di pagamento MQL5.community è disponibile per tutti gli utenti registrati sul sito MQL5.com che effettuano transazioni su MetaTrader Services. Puoi depositare e prelevare denaro usando WebMoney, PayPal o una carta di credito.
Ti stai perdendo delle opportunità di trading:
- App di trading gratuite
- Oltre 8.000 segnali per il copy trading
- Notizie economiche per esplorare i mercati finanziari
Registrazione
Accedi
Se non hai un account, registrati
Consenti l'uso dei cookie per accedere al sito MQL5.com.
Abilita le impostazioni necessarie nel browser, altrimenti non sarà possibile accedere.