Guarda i video tutorial del Market su YouTube
Come acquistare un Robot di Trading o un indicatore
Esegui il tuo EA
hosting virtuale
hosting virtuale
Prova un indicatore/robot di trading prima di acquistarlo
Vuoi guadagnare nel Market?
Come presentare un prodotto per venderlo con successo
Nuovi indicatori tecnici per MetaTrader 4 - 79

The indicator displays two Moving Average lines on the chart with parameters specified in the settings. It issues a signal in the form of arrows and a sound at the intersection of these Moving Average. In the indicator settings, you can set the period of fast Moving Average ( Fast MA Period ) and slow Moving Average ( Slow MA Period ). And also Shift, Applied Price, Method and Timeframe for two Moving Averages separately. Important:
The main difference from oth
FREE

Squat bar.
One of the signals of the "Trade Chaos" system of Bill Williams.
It is calculated based on the difference in price changes and tick volume.
Strengthens the signal of the "Bearish/Bullish Divergent Bar (First Wiseman)" if it coincides with it or is nearby.
Tested in comparison with the original program "Investor's Dream".
For more effective development of the system, read and see the materials of Bill Williams.
In the settings you can choose the color and width of bar. (Widt

The indicator is the advanced form of the MetaTrader 4 standard Fibonacci tool. It is unique and very reasonable for serious Fibonacci traders. Key Features Drawing of Fibonacci retracement and expansion levels in a few seconds by using hotkeys. Auto adjusting of retracement levels once the market makes new highs/lows. Ability to edit/remove any retracement & expansion levels on chart. Auto snap to exact high and low of bars while plotting on chart. Getting very clear charts even though many ret

Very special indicator of Joe Dinapoli which is a derivative from traditional MACD indicator. It shows the precise price, at which MACD will show line crossing and trend shifting. Also, this level is known one period ahead of time.You can constantly reassess your current position by looking at this studying a variety of timeframes. When you are in a trade, you have a feel for how much time you have for the trade to go your way by looking at the distance between the MACD Predictor line and the

Very special indicator of Joe Dinapoli which is a derivative of a Detrended Oscillator. Through a set of parametric equations, a predicting oscillator is created that forecasts, one period ahead of time, overbought and oversold conditions. The resulting predictor values are expressed as bands on the bar chart, both above and below the market. It may be mistaken as a Bollinger Band but has no resemblance to it whatsoever. The Predictor bands may be used in a variety of ways to aid in entering an

What you can do with CandleStick CandleStick is a useful indicator for doing MTF analysis. This indicator displays the CandleStick of another time frame on the chart . By understanding the information in multiple time charts at the same time, it is easier to understand the overall market view. It is also a useful tool for validating and studying past quotes and trades. There are similar products made by others, but I designed and developed it so that it is easy for me to use.
Features of Candl

Displays the appearance of a gap on the chart (when the closing price of the previous bar differs from the opening price of the new bar). My #1 Utility: includes 65+ functions | Contact me if you have any questions In the initial settings you can configure: The size of the gap (in points): only gaps that exceed this value will be displayed. Arrow color : separate for up and down gaps. When you hover the mouse over the gap arrows on the chart, their size will be displayed ; I recommend ch

The Knowledge of which Geometry aims is the knowledge of the Eternal - Plato Quant Stress Scanner is a Scientifically developed Stress detection algorithm along the geometrical lines on the price data which are quantified into Stress repulsion, fractures and clusters in a easily understandable signal form. Each signal are displayed in well-arranged with currency pairs in row-wise and timeframes in column-wise manner. Explanation of signal and plotting stress levels with trendlines are shown in

Draws Daily, Weekly and Monthly pivots and the respective supports and resistances levels (S1, S2, S3, R1, R2, R3). Ideal for placing stop losses and/or using as a break-out strategy. Features Unlike other pivot indicators in market you get very clean charts. Pivot levels are plotted irrespective of timeframe, on which you trade, i.e. M1, M5, M15, M30, H1,H4 or Daily timeframes. Pivot levels do not change when you change timeframe. Fully customizable options. If you are looking at Fibonacci
FREE

All in One package includes the Oscillator Predictor , MACD Predictor , Thrust Scanner and Advanced Fibonacci indicators which are mandatory for applying Dinapoli trade plans.
Please visit below links for detailed explanations of indicators. Advanced Fibonacci Indicator => https://www.mql5.com/en/market/product/52834 Thrust Scanner Indicator => https://www.mql5.com/en/market/product/52830 Overbought /Oversold Predictor indicator => https://www.mql5.com/en/market/product/52621
Macd

The indicator determines a special pattern of Joe Dinapoli. It gives very high probability buy and sell signals. Indicator does not repaint. Indicator Usage Buy Signal ''B'' Entry : Market buy order at signal bar close Stop : Low of signal bar Take Profit : First swing high Sell Signal ''S'' Entry : Market sell order at signal bar close Stop : High of signal bar Take Profit : First swing low Indicator Parameters Fast EMA : External Parameter (should be kept as default) Slow EMA: External Param

The indicator scans for Dinapoli thrust pattern in multiple timeframes for a specific market. Key Features Indicator can be used for all markets It can scan for thrust pattern on W1, D1, H4, H1, M30, M15 and M5 timeframes Ability to choose number of bars required above/below displaced moving average to define thrust Able to move display label on chart by single click Parameters Minimum Bars: Least amount of bars to account for Thrust DMA Period: Moving average period DMA Shift: Number or bars re

We know for sure that The Fibonacci sequence is a science used to calculate or estimate target distances.
How does this indicator work? 1. Tell the spread status 2. Tell me the current price 3. Indicate whether the candlestick status is bullish or bearish on each time frame. 4. Indicates the status of the past 2 candles 5. Tell Pivot Point 6. Tell the Fibonacci sequence. 7.The Fibonacci measurement can be set. 8. Pivot can be set backward. 9. Look at support and resistance.
Suitable for 1.

Non-proprietary study of Joe Dinapoli used for trend analysis. The indicator gives trend signals when the fast line penetrates the slow line. These signals remain intact until another penetration occurs. The signal is confirmed at the close of the period. It is applicable for all timeframes. Parameters Fast EMA: period of the fast moving average. Slow EMA: period of the slow moving average. Signal EMA: period of the signal line. ************************************
FREE

Non-proprietary study of Joe Dinapoli used for trend analysis. The indicator gives trend signals when the fast line penetrates the slow line. These signals remain intact until another penetration occurs. The signal is confirmed at the close of the period. It is applicable for all timeframes. Inputs lnpPeriod: Period of moving average. lnpSmoothK: %K period. lnpSmoothD: %D period. *****************************************************************************
FREE

Non-proprietary study of Joe Dinapoli used for overbought/oversold evaluation. Uses of Detrended Oscillator indicator Profit taking. Filter for market entry technics. Stop placement. Part of volatility breakout pattern. Determining major trend changes. Part of Dinapoli Stretch pattern. Inputs lnpPeriod: Perid of moving average Method: Calculation method ********************************************************************************* If you want to know market Overb
FREE

The indicator scans for stop grabber (special pattern of Joe Dinapoli which gives very high probability buy / sell signals and does not repaint ) signals in multiple timeframes for the all markets filtered and shows the results on Dashboard.
Key Features Dashboard can be used for all markets It can scan for stop grabber pattern on MN1, W1, D1, H4, H1, M30, M15 ,M5, M1 timeframes Parameters UseMarketWatch: Set true to copy all symbols available in market watch MarketWatchCount : Set the numbe

The Squat is a function of the range of a given price bar and the volume, or TIC volume, that occurs while that range is being created. The basic idea is that high volume and little price movement indicate substantial support or resistance. The idea behind the approach to this indicator is to first look for likely Fibonacci support and resistance and then see if Squat manifests when that point is reached. The indicator determines one of the high probability patterns of DiNapoli. It does not re

The indicator monitors the MACD trend in multiple timeframes for a specific market. No more shifting in between charts to check the trend direction while trading.
Key Features Indicator can be used for all markets Monitors every timeframe, from M1 to MN Able to move display label on chart by single click
Indicator Usage The dashboard appears to the left and upper part of the chart when attached. The shell encapsulating a timeframe goes red on a down trend, green on an up trend. If the defaul

The indicator monitors the Dinapoli MACD trend in multiple timeframes for the all markets filtered and shows the results on Dashboard.
Key Features Indicator can be used for all markets Monitors every timeframe, from 1 Min to Monthly
Parameters
UseMarketWatch: Set true to copy all symbols available in market watch MarketWatchCount : Set the number of symbols that you want to copy from the market watch list. CustomSymbols: Enter the custom symbols that you want to be available in dashboard.

The indicator scans for Dinapoli thrust pattern in multiple timeframes for the all markets filtered and shows the results on Dashboard. Key Features Dashboard can be used for all markets It can scan for thrust pattern on MN1, W1, D1, H4, H1, M30, M15 ,M5, M1 timeframes Ability to choose number of bars required above/below displaced moving average to define thrust Parameters
UseMarketWatch: Set true to copy all symbols available in market watch MarketWatchCount : Set the number of symbols that

Indicator with the function of catching trees should Engulfing Pattern of all time frames 1. Engulfing identification indicator for multi timeframe. 2. Function backtest of Engulfing candlestick patterns 3. Announcements on MT4 and on mobile phones Please watch my movie on youtube for instructions. Subscribe my channel for free indicator. Thanks for your https://youtu.be/_Dg99o6I_m4

the indicator will show signal arrows on the graph at the crossing of a given level it has push and audible alerts. By crossing from low to high level 0.3, a blue arrow will come out for the purchase, at the same time an audible signal will sound. By crossing from low to high level 0.7, a red arrow will come out for the sale, at the same time an audible signal will sound. Possibility to deactivate push and audible alerts.
MT5 version : https://www.mql5.com/en/market/product/51968

The indicator allows you to trade binary options. The recommended time frame is М5 and the expiration time is 5 minutes. The indicator suitable for auto and manual trading. A possible signal is specified as a arrows above/under a candle. You should wait until the candle closes and entry the trade at new candle Arrows are not re-painted Trade sessions: Any Currency pairs: ( recommended) EUR/CAD Working time frame: M5 Expiration time: 5,10,15 minute Up buffer: 1, down buffer: 0 *** Use with brok

Mr Pip Trend indicator combines powerful price action analysis and sophisticated algorithmic data analysis to provide traders with high-accuracy chart analysis and support the decision-making process. You can use Mr Pip Trend Indicator to trade all the markets (all Forex pairs, all CFDs and Cryptocurrencies) on all timeframes! Mr Pip Trend Indicator provides chart analysis that is effective at detecting new trends but finds the exact sweet-spot between early and late entries. What is different
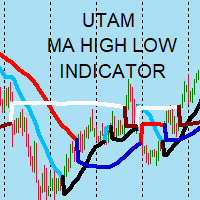
Nice Day! - A moving average candle indicates a high and low turn trend.
- MA_vonal_vastagsaga: MA_line_thickness. - MA_vonal_szine: MA_line_color. - MA_vonal_szine_long: MA_line_color_long. - MA_vonal_szine_short: MA_line_color_short. - mql5.com can also be used for my robots. Szép Napot! - Mozgó átlag gyertyájának magas (High) és alacsony (Low) fordulos trend jelzése. - mql5.com robotjaimhoz is használható.

Indicator developed with precision algorithm that seeks moments of strong trend in the markets. Reconciled with an algorithm that seeks high volume moments in the market. I recommend using timeframes M15 to H1. I also recommend an optimization to your liking for your best currency pairs. Any questions, do not hesitate to ask. Buy EA based on this indicator CLICKING HERE This is an excellent trigger indicator for your trading system. If you already operate a trend and want an indicator to show y

The indicator allows you to trade binary options. The recommended time frame is М5 and the expiration time is 5 minutes. The indicator suitable for auto and manual trading. A possible signal is specified as a arrows above/under a candle. You should wait until the candle closes and entry the trade at new candle Arrows are not re-painted Trade sessions: Any Currency pairs: ( recommended) EUR/NZD Working time frame: M5 Expiration time: 5,10,15 minute Up buffer: 1, down buffer: 0 *** Use with b

This type of arrow indicator works without redrawing signals. The signal on the indicator is shown as arrows (in the direction of movement). It is very simple and effective to use in the Forex market. Type of trading: "Scalping" It is applicable and performs well in intraday trading, as well as long-term trading. Сигнал на индикаторе показан в виде стрелок ( по направлению движения).
Очень прост и эффективен в применении на рынке Форекс.
Вид торговли: " Скальпинг"
Применим и хорошо себя

TorN ( Trend or Not ) has been made from ADX problem on fixed level. Only fixed level is hard to find trending or not. Now I find the better method to analyze ADX with MA . You can use this signal to confirm your trending strategy. (Or use it to find Sideway)
The best signal is signal line get higher than MA line and fixed level. ( Recommend to use level value same as ADX period or higher ) If signal line lower than MA line on Any level is mean weakening trend.
Please be aware that t

MACD Dashboard Panel This indicator helps you to scan symbols which are in the Market Watch window and filter out a trend according to MACD.
Moving Average Convergence Divergence (MACD) is a trend-following momentum indicator that shows the relationship between two moving averages of a security’s price. The MACD is calculated by subtracting the 26-period Exponential Moving Average (EMA) from the 12-period EMA.
The result of that calculation is the MACD line. A nine-day EMA of the MACD call
FREE
It is a judgment tool that judges trends in 1 minute and supports discretionary trading.
Various usages 1. It is used to recognize the environmental advantage of buying or selling with the color of the line. If the line is red, it is advantageous to buy. If it is blue, it is advantageous to sell. Neither if there is no line. 2. Used as a guide for entry by signing the entry. Red arrow long Blue arrow short 3.Used as a guide for closing (Even if there is no entry sign, the close point will be

EnkiSoft TrendWatch Indicator with Pips counter
Product blog page
Last version 1.63 (2021.06.27) With TrendWatch Indicator you will be able to identify trends on any symbol and any timeframe. Choose the easy way, use TrendWatch indicator, and find your settings on your favourite chart. The embedded pips counter helps you to find the best settings, that differ almost on every pair and timeframe. I will provide you some settings, so you can begin profitable trading. With many setting, y

This indicator is intended for professionals assessing fundamental market trends. This indicator calculates the index of any instrument and analyzes it. The index of the state currency shows the real purchasing power of this currency, and the dynamics of this index shows the dynamics of the economic state of the corresponding state. An analysis of the indices of both currencies included in a currency pair makes it much more reliable to identify the trend of this cur
Bearish/Bullish divergent bar . One of the signals of the "Trade Chaos" system of Bill Williams. (First wiseman)
When bar moving away from the "Alligator" indicator and there is divergence on the Awesome Oscillator indicator, it shows a potential point of movement change.
It is based on the opening/closing of the bar, the position relative to the previous ones, the Alligator and AO.
When trading, the entrance is at the breakthrough of the bar(short trade - low of bar, long trade high of bar)

The strategy works on the ECN account (5min and more)
Inside bar : with the direction of movement average 200 (you can change 200 it if you want). when the price is on the MA the indicator only gives the buy sign, and the opposite if the price is below the MA 1 Buy: The indicator draws a blue line, when a candle closes above that line and the price reverses towards the line, Buy from that blue line. Put the stop on the red line and the take profit on the yellow line TP1, or green line TP2
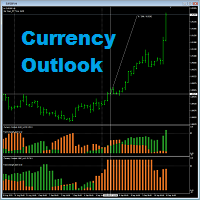
Currency Outlook is an indicator that can help us "Trade the right pair in the right direction and at the right time". This indicator analyzes prices of all cross currency pairs of the selected currency and report the result to us in form of double colours histogram diagram. The maximum height of the histogram diagram of the indicator is 100. The indicator is exclusively programming for AUD, CAD, CHF, EUR, GBP, JPY, NZD and USD. A feature for calculating trade lot size has been added to th
FREE

Indicator with the function of catching trees should pinbar of all time frames 1. PinBar identification indicator for multi timeframe. 2. Function backtest of PinBar candlestick patterns 3. Announcements on MT4 / MT5 and on mobile phones Please watch my movie on youtube for instructions. S ubscribe my channel for free indicator. https://youtu.be/gIONGgBMqW8
#KIDsEA #indicator #Pinbar #priceaction #mt4 #mt5
FREE
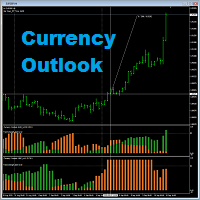
Currency Outlook is an indicator that can help us "Trade the right pair in the right direction and at the right time". This indicator analyzes prices of all cross currency pairs of the selected currency and report the result to us in form of double colours histogram diagram. The maximum height of the histogram diagram of the indicator is 100. The indicator is exclusively programming for AUD, CAD, CHF, EUR, GBP, JPY, NZD and USD. It can work in any timeframe in MT4. A feature for calculating trad

The indicator allows you to trade binary options. The recommended time frame is М5 and the expiration time is 5 minutes. The indicator suitable for auto and manual trading. A possible signal is specified as a arrows above/under a candle. You should wait until the candle closes and entry the trade at new candle Arrows are not re-painted Trade sessions: Any Currency pairs: ( recommended) AUD/CAD Working time frame: M5 Expiration time: 5,10,15 minute Up buffer: 1, down buffer: 0 *** Use with bro

The indicator allows you to trade binary options. The recommended time frame is М5 and the expiration time is 5 minutes. The indicator suitable for auto and manual trading. A possible signal is specified as a arrows above/under a candle. You should wait until the candle closes and entry the trade at new candle Arrows are not re-painted Trade sessions: Any Currency pairs: ( recommended) EUR/AUD Working time frame: M5 Expiration time: 5,10,15 minute Up buffer: 1, down buffer: 0 *** Use with brok

The indicator allows you to trade binary options. The recommended time frame is М5 and the expiration time is 5 minutes. The indicator suitable for auto and manual trading. A possible signal is specified as a arrows above/under a candle. You should wait until the candle closes and entry the trade at new candle Arrows are not re-painted Trade sessions: Any Currency pairs: ( recommended) AUD/NZD Working time frame: M5 Expiration time: 5,10,15 minute Up buffer: 1, down buffer: 0 *** Use with brok
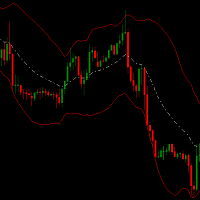
Channel hero indicator is a special channel which helps you to detect oversold/ overbought areas. It can be a complementary indicator for your strategy.
It can be combined with bollinger bands . When price breaks above bollinger bands and upper channel hero band is above bollinger band and also
the white line (middle channel hero line) is above middle BB then this point has big possibility to go up. A good closing point can be when middle channel hero line cross below middle bollinger band
FREE

This is simple profitable system I have been using to trade for over 10 years.
You do not need many indicators on your charts to be successful as a trader. Just find the right strategy that has been proven over time and stick to it. You are not only buying trading system when you buy my product but also mentorship. You will become one of the members of my close trading group on Telegram where you will learn how to manage your trading career and become a discipline trader who makes consistent
ATR on Chart has been made for anyone wants to easily analyze ATR from Price Chart. It will show ATR rang and you can apply with each bar or MA .
When price touches the line it means it is trending to that side .
Please be aware that this indicator DOES NOT point out the momentum of trending. I r ecommend to use this indicator to find : https://www.mql5.com/en/market/product/55009
Input d escription : ATRperiod = Setting of ATR period. ATRmulti = Multiply value from ATRperiod . Mode =

The indicator allows you to instantly determine the current trend by color and FIBO levels. Higher Timeframe the panel shows the current trend of higher periods, helping to determine the strength of the trend Trade according to the trend when changing the color of candles or trade against the trend when the price hit the extreme levels of the FIBO Trend PRO indicator Advantages of the FIBO Trend PRO
Indicator never repaint and does not change their values Very easy to use and intuitive
FREE

Scalper trend giornaliero (DTS)
DTS è un indicatore di tendenza giornaliero che utilizza Price Action, Dynamic Support e Resistances. È progettato per essere utilizzato da chiunque, anche il principiante assoluto nel trading può usarlo. NON ridipinge MAI. Le indicazioni sono date da vicino a vicino. Progettato per essere utilizzato da solo, non sono necessari altri indicatori. Ti dà la tendenza e il potenziale Take Profit all'inizio della giornata.
Come funziona DTS utilizza una strategia d

Display your Local Time on your charts
Display your local time instead of (or along with) MT4 server time.
Display crosshair which highlights current candle time.
Automatically adjusts based on chart zoom (zooming in or out).
Displays on every timeframe (M1 – Month), and auto-adjusts as chart timeframe is changed.
Handles special ½ hour time zones , such as India.
Renders fast (no lag) as you scroll charts.
Customize the font family, font size, background color, and crossh

Это стрелочный индикатор. Он выбирает данные от 23-х стандартных индикаторов и расчитывает уровень сигнала который показывает предполагаемое движение цены инструмента торговли. Минимальный уровень сигнала индикатора установлен в пределах -100 до +100%. Используйте усреднение для формирования сигнала.
Как работать с индикаторам.
Следим за сигналом и принимаем решения. Индикатор перерисовывается только на нулевой свечи, поэтому решения принимаются после закрытия свечи с новым сигналом, и сигн
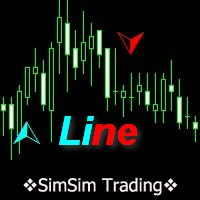
Это линейный индикатор. Он выбирает данные от 23-х стандартных индикаторов и рассчитывает уровень сигнала, который показывает предполагаемое движение цены инструмента торговли. Минимальный уровень сигнала индикатора установлен в пределах -100 до +100%. Используйте усреднение для формирования сигнала.
Как работать с индикаторам.
Следим за сигналом и принимаем решения. При пересечении нулевого уровня индикатора снизу вверх можно рассматривать покупки. При пересечении нулевого уровня сверху
Это индикатор гистограмма. Он выбирает данные от 23-х стандартных индикаторов и расчитывает уровень сигнала который показывает предполагаемое движение цены инструмента торговли. Минимальный уровень сигнала индикатора установлен в пределах -100 до +100%. Используйте усреднение для формирования сигнала.
Как работать с индикаторам.
Следим за сигналом и принимаем решения, цвета гистограммы показывают когда возможны покупки а когда продажи, или нейтральный цвет - сделать паузу. Индикатор перерис

This is a trend indicator.
Timeframe: any Symbol: any Color meaning: blue: long trend, up trend red: short trend, down trend yellow: market trend is changing Feature: 1, very easy to use, obvious signal, profitable 2, suitable to work on charts of any timeframe 2, all type of alerts 3, standard data buffers, can be easily implanted into any EA program. 4, all color customizable.
wish you like it :)
FREE

It is an indicator that analyzes the high and low prices in real time by Dow theory, draws a trend line, and draws the predicted arrival point in the Box format after breaking the low price and the high return price. The high and low prices are determined by the nBars parameter (initial value = 5), but displaying the corresponding moving averages (SMA and EMA 4 to 5 times nBars) at the same time makes it easier to understand the trend change. (D ownload the demo version of the free GreenBox and
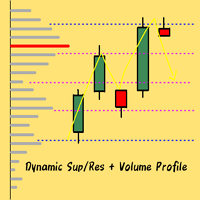
!!!REVISION 3 OF THE INDICATOR HAS BEEN RELEASED! IF YOU WANT TO TRY THE INDICATOR FOR 1 MONTH FOR FREE JUST WRITE ME NOW!!!
DYNAMIC LEVELS + VOLUME PROFILE + REGRESSION CHANNEL Hello Guys! Revision 3 of the indicator has been released! The indicator plots SUPPORTS AND RESISTANCES DYNAMICALLY on the chart, identifying different levels of interest based on the price action. Every trader knows that indicators are important, but they often provide the signal "with a candle of delay", therefore wh

VWAP and Moving Average A combination of Supertrend and Moving Average to create a converging trade setup Input parameters: signal mode: set it to true if you want to plug it into STAT (Signal Tester and Trader) arrow shift: distance between fast EMA line to arrow on chart turn on moving average signal for converging setup VWAP period MA period MA averaging method MA pricing method upper level limit ( VWAP ) lower level limit ( VWAP ) You can find the best setting for 4 hour EURUSD on this v
FREE

Aroon and Moving Average A combination of Supertrend and Moving Average to create a converging trade setup Input parameters: signal mode: set it to true if you want to plug it into STAT (Signal Tester and Trader) arrow shift: distance between fast EMA line to arrow on chart turn on price line filter turn on moving average signal for converging setup aroon period MA period MA averaging method MA pricing method upper level limit (Aroon) lower level limit (A roon ) You can find the best setting
FREE

KDJ指标,从国内代码中转译而来,带有J线 -------------------------------------------------------------------------------------------------------------- 你可以在这里联系我 https://www.mql5.com/zh/users/chaoping0326 可以承接MT4,MT5的指标,EA定制 长期从事编程项目(MT4从2012年,MT5从2016年), 有很好的编程能力,参数设置合理,能很好地理解客户的要求。 请联系我,根据你的要求进行报价。 我对程序的逻辑负责,如果程序有问题,我可以免费修复,如果我不能修复,我可以全额退款。 增加和调整逻辑需要额外收费。 免费提供全英文或中文源代码。

双线MACD -------------------------------------------------------------------------------------------------------------- 你可以在这里联系我 https://www.mql5.com/zh/users/chaoping0326 可以承接MT4,MT5的指标,EA定制 长期从事编程项目(MT4从2012年,MT5从2016年), 有很好的编程能力,参数设置合理,能很好地理解客户的要求。 请联系我,根据你的要求进行报价。 我对程序的逻辑负责,如果程序有问题,我可以免费修复,如果我不能修复,我可以全额退款。 增加和调整逻辑需要额外收费。 免费提供全英文或中文源代码。

Stochastic force is an advanced version of the stochastic oscillator. Instead of using the regular price a more efficient price data is provided as an input for the oscillator which takes into account the price efficiency, volume and market noise. Also price is pre-filtered with the selected average type and then post-filtered by a hull moving average which provides a smooth transition of the oscillator. It eliminates maximum false signals and has the potential to become an integral part of any

VertexFilter - это индикатор соединивший в себе классический zig zag и осциллятор. Принцип действия следующий: когда регистрируется новый максимум или минимум, это делается с помощью индикатора zig zag, индикатор ждет смены направления движения цены, это делается с помощью осциллятора, в такие моменты появляются сигналы на покупку и продажу. Таким образом индикатор подает сигналы когда цена меняет направление движения вблизи экстремумов. Это позволяет отфильтровать ложные сигналы. Индикатор имее
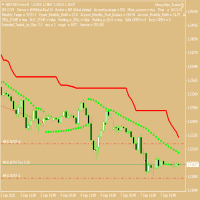
ATR Stops Attach to chart of any timescale Length = 10 ATR period = 9 kv = 6 I use this set up on a one hour chart, basically the blue line indicates an upward trend while the red line indicates a downward trend All setting can be used on any chart period, If you don't like the settings I use then just play around with the settings on any chosen time period until you find a setup which suites your trading style
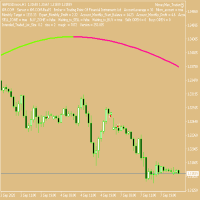
MA with Trend colour Attach to chart of any timescale MA period = 200 buffer = 1 I use this set up on a one hour chart, basically the green line indicates an upward trend while the red line indicates a downward trend All setting can be used on any chart period, If you don't like the settings I use, then just play around with the settings on any chosen time period until you find a setup which suites your trading style

Trend Harvester is yet another trend indicator with flat detection. It uses price series and Moving Average for detecting market trend.
For better result I would recomend to play with parameters.
Lower periods will force to react to short trends.
Higher periods will try to show longer trands.
You can set the same period for Price Series and Moving Average for quick test.
You can also choose Moving Average type between "Regular" and "Zero Lag".
"Zero Lag" type improves reaction to trend ch

Here are several indicators that work together. It basically works with moving averages and various levels of ATR creating a dynamic channel through which the price is drained. As I always recommend, you should try it before using it in live so that you understand how it works. The market entry signal is similar to other MA indicators, but with this one you also have a graphical analysis of the moment when the trend is found and dynamic levels to adjust your stop loss and take profit depending
FREE

The Dragon Trend indicator displays information in a visual form. The intelligent algorithm of the Dragon Trend indicator determines the trend with sufficient accuracy, filters out market noise and generates input signals.
One of the most beloved trends in price chart analysis is the use of chart analysis. The state of the market, the phase of its movement largely determines the success of the trader and the strategy he has chosen. The indicator uses color signaling: blue - when changing from

Victory Price Direction I'm glad to present you my new indicator. This indicator includes all the best strategies that I have researched. When developing and optimizing, I used ML algorithms. The indicator is very easy to use.
Now the indicator has 3 basic strategies and the ability to customize your own strategy. I am constantly looking for better strategies.
You get: A simple and effective indicator of reversals. The indicator will help you place Take Profit correctly.

FBO Impact is a professional yet simple to use trend following system. It detects the prevailing trend and gives entry points after pullbacks to significant price levels. To determine the trend it uses a unique filtering algorithm. Suitable for defining entry points for scalping as well as for intra-day trading. Features Works with the prevailing market trend. Suitable for all currency pairs. Ideal for all time frames but higher time frames are recommended. Does not redraw/repaint the arrows on

The indicator displays the most important Price Action Patterns that indicate a potential reversal / continuation of the trend. My #1 Utility : includes 65+ functions | Contact me if you have any questions Avaliable Patterns: Pin bar; Engulfing; Inside bar (Harami); Morning star; Evening star; Dark Cloud Cover; Piercing Line; Features: You can select patterns to display and disable unnecessary patterns; Notifications : alerts in the terminal, Email and Push-notifications (to the mobil

The indicator displays the levels that are extremes for the specified time frames. Resistance level is the maximum price of the last closed bar; Support level is the minimum price of the last closed bar; My #1 Utility : includes 65+ functions | Contact me if you have any questions 2 operating modes: Real bodies: Open and Close prices will be used; Extremes: High and Low prices will be used;
This indicator: Helps to see potential reversal levels; Patterns formed near the levels have mo
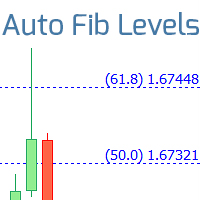
Automatically draws Fibonacci levels, basen on the last closed bar of the specified time frame. My #1 Utility : includes 65+ functions | Contact me if you have any questions helps to see potential reversal levels; patterns formed near the levels have more potential; significantly saves time spent on manual level plotting; Adjustable parameters:
The time frame used to plot the levels; Personalization of Fibonacci levels: main correction levels + extension levels; Line color, line width an
Sai perché MetaTrader Market è il posto migliore per vendere strategie di trading e indicatori tecnici? Non c'è bisogno di pubblicità o di protezione del software, nessun problema di pagamento. Tutto ciò è fornito da MetaTrader Market.
Ti stai perdendo delle opportunità di trading:
- App di trading gratuite
- Oltre 8.000 segnali per il copy trading
- Notizie economiche per esplorare i mercati finanziari
Registrazione
Accedi
Se non hai un account, registrati
Consenti l'uso dei cookie per accedere al sito MQL5.com.
Abilita le impostazioni necessarie nel browser, altrimenti non sarà possibile accedere.