Guarda i video tutorial del Market su YouTube
Come acquistare un Robot di Trading o un indicatore
Esegui il tuo EA
hosting virtuale
hosting virtuale
Prova un indicatore/robot di trading prima di acquistarlo
Vuoi guadagnare nel Market?
Come presentare un prodotto per venderlo con successo
Expert Advisors e indicatori gratuiti per MetaTrader 4 - 42

Nombre del Indicador: Two Lines Color II Descripción: El indicador "Two Lines Color II", desarrollado por 13 Crow Trading Club, es una versión más rápida de su predecesor, el "Two Lines Color 1". Este indicador ha sido diseñado para brindar señales aún más tempranas sobre posibles cambios de tendencia en el mercado financiero. Características Principales: Mayor Velocidad de Señales: Two Lines Color II ofrece señales más rápidas en comparación con su versión anterior. La rápida velocidad de las s
FREE

This Dashboard is free to download but is dependent on you owning the Flag Trend Pro MT4 indicator. Down load the indicator: Flag Trend Pro
The Dashboard will show you on a single chart all the timeframes (M1 to Monthly) with their own status for the indicator: Gold Pro MT4
all time frame and all symbol: smart algorithm detects the trend, filters out market noise and gives entry signals!!!
How to understand the status: symbol - Fill All the Pair what you want. M1, M5, M1
FREE
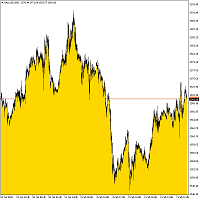
Bottom Background 4 The indicator sets the lower background of a certain color to the current price, depending on the settings. Description of indicator settings: MODE - three display options for the indicator: Low - display to the minimum price, Open / Close - display to the open or close price, whichever is lower, MA - display to the moving average. PeriodMA - moving average period.
FREE
StatBar 1.6 Indicator showing balance, earnings for today, yesterday and the day before yesterday. The indicator also shows: - Server; - GMT; - Server time; - Shoulder; - Spread.
Description of variables: extern int Magic = "-1"; // Magic for statistics -1 = all 0 = manual extern string Symboll = "-1"; // Symbol for statistics -1 = all 0 = current EURUSD = for EURUSD
FREE

I decided to list it for free. Combined Informer of DeMarker with RSI MTF. Each parameter can be change values in menu. it is good for scalping or for weekly trading and looks as universal fx-toy. Now I use it for BTC, ETH, BNB. In menu you can turn on daily percentage gain info, weekly and monthly gains also included as informers. Short ATR helps to determine when price was slow/stopped and entry for pulse pump/dump. The filter of numbers of RSI can be tuned for overbought/oversold values w
FREE

Questo Expert Advisor è un professionale EA il quale sarà sempre aperto. Userà diversi indicatori, tra cui il parabolic Sar. Attualmente è possibile fissare il numero di lotti (0.20 di defoult); Non usa Martingala, non usa grid o altri sistemi rischiosi. Provalo in demo. Ottimi risultati su tante coppie di scambi. Consiglio di non usarlo su leva altissima.
FREE
Your attention is invited to the indicator Price Action Indicators. It doesn't need settings. And also it is not tied to more than one indicator, which makes it not vulnerable to different accounts or brokers.
Add one setting PERIOD
Regards, Mikhail
Вашему вниманию предлагается индикатор Price Action Indicators. Ему не нужны настройки. А также он не привязан не к одному индикатору, что делает его не уязвимым перед разными счетами или брокерами.
С Уважением Михаил
FREE

Calendar File Converter
This script adapts the csv economic calendar file downloaded from the myfxbook.com portal for use by the Economic Calendar Viewer indicator. This indicator displays on the MT4 chart data about the upcoming current economic event and displays its data. It also notifies you with a sound before the upcoming event time. The read file should be named: - calendar_statement.csv The temporary intermediate file is named: - calendar_statement2.csv The output file is named: - Cal
FREE
This indicator displays RVI indicator signals on the chart. The main point of Relative Vigor Index Technical Indicator (RVI) is that on the bull market the closing price is, as a rule, higher, than the opening price. It is the other way round on the bear market. So the idea behind Relative Vigor Index is that the vigor, or energy, of the move is thus established by where the prices end up at the close. To normalize the index to the daily trading range, divide the change of price by the maximum r
FREE

A simple risk management tool that closes all open orders if equity drops by a specified percentage. This tool is useful if you are running multiple EAs and multiple charts and pairs in order to control your risk. All orders will close accordingly. Once it hits specified percentage drawdown the closing of all orders cannot be stopped. The EA will reset once all orders are closed, until account equity drops again relative to account balance. Use at your own risk. This is only for MT4. There is on
FREE
This indicator displays DSS Bressert AM signals on the price chart. The calculation of DSS Bressert values is similar to the stochastic indicator. The confirmation of the indicator's signal is the overcoming by the price of the high/low of the bar on which the signal was given by the indicator. Settings: Price - the price at which the indicator is calculated; EMA_Period - smoothing period; Stoch_Period - oscillator period;
OB_Level - overbought level; OS_Level - oversold level;
Show_Move -
FREE
Double Smoothed Stochastics – DSS Bressert is an oscillator introduced by William Blau and Walter Bressert. The calculation of DSS Bressert values is similar to the stochastic indicator. The confirmation of the indicator's signal is the overcoming by the price of the high/low of the bar on which the signal was given by the indicator.
Settings: Price - the price at which the indicator is calculated; EMA_Period - smoothing period; Stoch_Period - oscillator period;
OB_Level - overbought level;
FREE

Индикатор сглаженного Stochastic Oscillator (xStoh)
Входные параметры: xK Period - K период xD Period - D период xSlowing - замедление xMethod - метод усреднения (0-SMA | 1-EMA | 2-SMMA | 3 - LWMA) xPrice field - тип цены (0 - Low/High | 1 - Close/Close) Принцип работы
Индикатор перерассчитывает стандартный технический индикатор Stochastic Oscillator (дважды усредняет получаемые значения iStochastic).
FREE

Deals Utility is designed to manage any opened and pending order. It can handle orders by adding SL/TP, Trailing or Breakeven.
How to use Apply this Utility to any chart and set input parameters at your discretion. When you open any Market or Pending order, this utility adds SL/TP immediately. It will not process any order with magic number, so other EA's can work with this. It will manage Forex, Metal and Energy symbols. Other EA's can work with this because it will not handle any order with
FREE
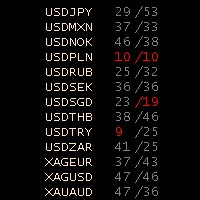
Stochastic Oscillator Panel Introducing the Stochastic Oscillator Panel, a comprehensive representation of the stochastic oscillator for all currencies (up to 75 pairs). This powerful tool operates within the current time frame, utilizing the simple moving average and relying on the Low/High prices. The panel consists of three columns: Name of the currency MODE_MAIN (main line) MODE_SIGNAL (signal line) The Stochastic Oscillator Panel provides visual cues through color coding: Green color (overb
FREE
NearONE displays the average value of the price deviation in points for a specified period in a subwindow of a selected trading instrument.
Inputs : DRAWs - number of bars to display the indicator; NearPeriod - indicator period.
If NearPeriod is 0 , recommended periods are used for each chart timeframe.
If NearPeriod = 0: M1 timeframe - period = 60 ; M5 timeframe - period = 48 ; M15 timeframe - period = 96 ; M30 timeframe - period = 192 ; H1 timeframe - period = 96 ; H4 timeframe - period
FREE

CUSTOM Currency strength indicator
-CHOOSE ANY CURENCIES that you want to calculate strength for, indicator will automatically compare all symbols /pairs from 8 selected currencies based on KU-chart calculations.
-8 major currencies are used by default
-add indicator to any chart
-made for 15min timeframe= last 1 day change calculated, 30min = last 2 days and so on
-clear currency distinguish by color and name on chart
-if you chose non-standard currency, make sure all of inputted val
FREE
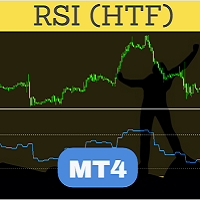
Perfected RSI (Relative Strength Index) HTF (Higher Time Frame) is perhaps the most advanced and reliable HTF indicator. Highly optimized in terms of execution, the indicator comes with standard settings of the RSI indicator which is supplied with the MT4 platform. Place the indicator on the chart, any timeframe. You may select a higher time frame in indicator inputs. The same indicator can be used on a chart multiple times to draw RSI from multiple timeframes or for different RSI period values
FREE

The indicator measures volumes on different charts and instruments. Its main advantage is the ability to compare separate brokers. The less Middle Volume and Tick / Second , the more reliable is the broker. There is a comment in the upper left corner Comment data: Tick/Second — number of ticks per second for a selected instrument Middle Volume — average volumes in the penultimate bar This indicator allows tracking a relative market activity for different timeframes. If the volumes are lower than
FREE
This indicator is an implementation of the "One shot - one hit" principle. In the course of work on the creation of this product, an attempt was made to achieve the maximum balance between the sensitivity of the indicator and the effectiveness of its signals. This tool is as reliable and effective as a 45 caliber revolver, but in the same way it requires discipline and understanding of the conditions and purpose of use from its user. The indicator has only one adjustable parameter that determine
FREE

Forex Robot BOBOB
This EA forex robot concept is based on Market range value.
EA check the certain range (highest and lowest price) price and if the price break that level,
then EA will place the order in reversal.
Also the entry is judged based on Market trend directions.
EA can be run in any pairs but most of time, the major pair is desired.
Time frame is longer is better but short time frame such as M15 is possible.
EA default set is already optimized , so you can ju
FREE
This utility keeps a watchful eye on your trading terminals and ensures that you are notified if any of them are disconnected. Simply attach the utility to a chart and connect to a monitoring service who can notify you.
We use UptimeRobot for both VPS and terminal monitoring; however, any service supporting heartbeat monitoring can be employed.
Many such services offer free plans and various notification methods, such as Cronitor.io
FREE

This classic "old school" MAGIC MACD indicator gives you the cross of the parameters you set. Standart setting is (12,26,9) . The arrows give you a possible change of trend. Be careful and do not use this indicator as a single signal source.
FREE version Please feel free to check out our other REX indicator series. We do have other free indicators.
"OLD BUT GOLD"
FREE
DStochastic is an improved version of the classic Stochastic oscillator with an added moving average. The indicator dampens the market noise, determines the direction of the market and reduces the number of false signals. We have also added a function of multicolor signal line display of increase and decrease by means of dots. The blue dots indicate the development of an ascending trend, the red dots - descending. Similar to all standard oscillators, DStochastic can be combined with all trend in
FREE
StrxInfoPanel is an essential tool for every trader It gives you an immediate idea about your account and realtime informations about the current symbol and timeframe you are analyzing Every information line can be hidden and shown via parameters, even panel position can be changed via input parameters Parameters list: Corner : the screen corner where you want the panel to be shown Left, Top, and Width : customizable position and panel dimensions BgColor : background color Show XXX : every infor
FREE

Strategy creation : Create lines of stop loss, entry and take profit. Live parameters such as lot size, gap in pip from SL to TP, Risk/Reward ratio are update whenever lines of SL and Entry move. This function allows traders to clarify their strategy before making any orders. Risk management - The risk calculation function calculates the volume for a new order taking into account the set risk and the distance from the Stoptloss to Entry Line. In addition, maximum risk (%), RR value are
FREE
The oscillator indicator " JAngleR " is one of a series of three calculators of the angular deviation of the price chart of a trading instrument.
INPUT PARAMETER: DRAWs =128 - Number of bars to display the indicator in the chart history; Period_IND =14 - calculation period of the indicator in the number of bars; ma_period =1 - Moving Average Period; ma_method =MODE_SMA - moving Method; applied_price =PRICE_CLOSE - applied Moving Average Price. The values of the indicator indicators are degree
FREE

Unlock the power of precision in your trading strategy with Std Dev Channel, the innovative indicator designed to revolutionize your approach to market analysis. Crafted as an advanced version of the standard deviation indicator, Std Dev Channel empowers traders with enhanced insights into market trends and volatility patterns. With Std Dev Channel, harness the synergy of statistical analysis and technical charting to make informed trading decisions. This cutting-edge tool meticulously calculate
FREE
The indicator identifies the strength of the trend based on the points where the MFII indicator exceeds the overbought and oversold levels. The indicator does not redraw. This indicator:
Suitable for all markets; Not redrawn; Intuitive and simple; It can be useful for both beginners and experienced traders; Allows you to identify market entry points where there is a high probability of a significant price movement sufficient for a successful transaction; Settings: Ind_Period (>1) - period o
FREE
This indicator displays the signals of a highly effective oscillator - Laguerre Osc 3 AM - on the price chart. The indicator displays the difference between the current price and the price for the previous period. A similar method of market analysis is used in the classic Momentum indicator. At the same time, the presented indicator uses the primary data smoothing by the Laguerre filter, which allows maintaining the sensitivity of the indicator and minimizing the "noise". The indicator signals
FREE

It is a very simple and useful micro indicator. Shows the current ask price, and the maximum relative ask price up to the current moment, on the chart, in the first N candles. It facilitates quick decision making by offering a visual reference. Likewise, when we position ourselves with the cursor over it, it shows us the maximum spread since the indicator is applied, until the current moment. It is perfect for scalping . By default, the parameter N has the value 4.
Especially recommended ind
FREE

The Currency Strength Breakout indicator monitors eight currencies across M1, M5, M15, M30 & H1 time frames all in the same window.
Trade the strongest currency against the weakest with alerts for pullbacks giving you the opertunity to enter the trend. Please note: I have made the decision to give this Indicator away and many more for free with limited support so that I can concentrate on Custom EA.
View More Products - https://www.mql5.com/en/users/robots4forex/seller#!category=1
Monitoring
FREE

The indicator generates signals for opening positions. The principle of operation is to compare the current average price with a range of average prices over a longer period. The signals are confirmed when the price exceeds the High/Low of the bar where the indicator generated the signal. Maintenance of an open position is carried out on a smaller TF. Indicator signals to open an opposite position on a smaller TF are a signal to close the deal. This indicator does not repaint or not recalculat
FREE
This script permits to delete the pending orders or close the market positions on platform. Very simple to use. Upload the script on the chart and the script will done the work for you following the input values.
An utility to manage very quickly your trading.
Input Values TypeOrders Only BUY (delete or close only BUY) Only SELL (delete or close only SELL) BUY and SELL (delete or close ALL) Type Positions (close only market orders) Only STOP (delete STOP pending orders) Only LIMIT (delete LI
FREE

The EA places orders at the specified terminal time with an accuracy of 1 minute.
Types of orders are selected, the default is pending.
Set stop loss, take profit, the time after which pending orders are deleted, if until that moment they were not opened(time can not be less than 11 minutes from the time of opening, the EA will not work). Check for magic number is at the beginning. If there are orders with the same magic and on the same instrument (the same symbols), the orders will not be
FREE
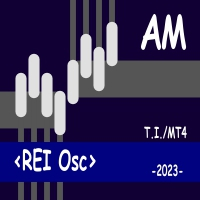
REI Osc is an indicator that measures the rate of price change and signals overbought/oversold conditions if the price shows weakness or strength. The indicator was developed by Tom DeMark and described in the book Technical Analysis - The New Science. The indicator value changes from -100 to +100. REI is an improved oscillator as it attempts to remain neutral in a sideways trend and only shows signals when a significant top or bottom has been reached. Tom DeMark suggests using a default period
FREE
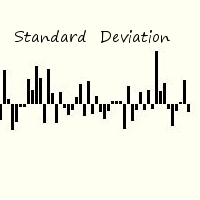
Standard deviation of returns is a popular way to view how the return of one bar relates to history. By knowing that you can better understand the magnitude of any return. The signal is calculated by taking the prior periods returns, adjusting for volatility of the returns of the last twenty periods, and dividing by the standard deviation. It is displayed in a separate panel as a histogram.
FREE
Hello, Every one The EA is used to close buy or sell market positions and all pending orders when the RSI reaches a certain value. It is also used to close positions in the market when the profit reaches a certain value. All setting 1. RSI Period : 14 ( or as you want ) 2. RSI Close Buy Value : 70 (The EA will close all long positions and Pending Buy Orders when the RSI is above 70) 3. RSI Close Sell Value : 30 (The EA will close all short positions and Pending Sell Orders when the RSI is
FREE

FXO PRICE ACTION LEVEL NOTIFICATIONS
Notes:
1. .ex4 must be loaded in EA folder (not indicator folder).
2. Activate MT4 application notifications by Tools/options/enable push notification.
3. Drag Overlapped Horizontal lines to desired levels at start.
This is an Indicator file, it will not take trades by itself.
For any query Support: admin@forexmarket.one
Copyright: www.forexmarket.one
FREE

Introduction This Indicator Is Based On Average Price/Maximum Price Moves, And Using Moving Bollinger Bands And Moving Averages.
The Advantage Of Using It With YOUR own Analysis Will Confirm Potential Supports And Resistances While it Compliments With Your Analysis
The Indicator Is Non-Repainting
AND Along With Our Special Trend METRE that Changes With The Conditions OF A Bullish Or Bearish Trend....
Recommend Time-Frames: H1 H4 M15
Usage: The Indicator Is Very Profitable I
FREE
Objective: To automatically show the Fibonacci entries from last candle. Inputs: 1. Show/Hide the Fibonacci entries 2. Set where the Fibonacci will draw, 0 = current, 1 = last bar … (Default = 1) 3. Set the Fibonacci color 4. Set the line style 5. Set the minimum candle size automatically/manually in which the fib levels will appear 6. Set the candle size based on ADR/X Fibonacci levels: 23.6, 38.2, 50 Other Tools: https://www.mql5.com/en/market/product
FREE
The indicator displays the signals of the RSX oscillator on the price chart. (To display these signals in a separate window, along with the oscillator, another indicator is used - RSX Osc 4 AM ). It is optimal to use the indicator signals as signals to open a trade when the price overcomes the maximum or minimum of the bar at which the signal was given. An opposite signal cancels the previous signal.
Settings: Data period for indicator calculation - data period for indicator calculation; Dat
FREE
The product is based on J.F. Ehlers' Center of Gravity indicator. Center of Gravity actually has a zero lag and allows to define turning points precisely. The indicator is a result of Ehlers' research of adaptive filters. It identifies main pivot points almost without any lag. The indicator displays the COG oscillator in a separate window.
Parameters: Length - indicator calculation period. MaPrice - price used to calculate the indicator. Signal - indicator display options. The indicator does
FREE
DF Osc AM - this is an indicator that marks the moments when the price direction changes. The indicator uses adaptive digital filters for analysis. Digital filters are (simplified) a way to smooth data. Unlike traditional moving averages, a digital filter will be more effective in most cases. The indicator does not redraw, the signal is generated after the candle is completed. It is optimal to use the indicator signals as signals to open a trade when the price overcomes the maximum or minimum o
FREE
Digital filters are (simplified) a way to smooth data. Unlike traditional moving averages, a digital filter will be more effective in most cases. The presented indicator displays in a separate window in the form of a line the data of several (optional) digital filters built at different (optional) prices. The presented indicator is a simplified version of the Digital Filters AM indicator. The indicator does not redraw on fully formed bars. The indicator allows you to effectively follow the trend
FREE

This indicator helps the trader to make the final decision. When you have already decided in which direction the price will unfold, it remains as accurate as possible to determine the reversal itself. This is the task performed by the Konkov indicator. The indicator is installed on M1 and M5 charts. Indicator parameters: for M1 chart time_frame1 5 time_frame2
FREE
Индикатор отображает размер бара и его направление. ---------------------------------------- Цвета гистограммы: * Красный - Медвежий бар.
* Зелёный - Бычий бар.
* Серый - Цена открытия и цена закрытия равны. * Синяя линия - скользящая средняя.
---------------------------------------- Параметры: - Type of Calculation - Тип расчёта ( Low to High, Open to Close ) - Moving Avarage - Период скользящей средней
FREE
Buy a Coffee for Yuniesky Carralero Cuellar
This indicator draws:
TX - The max price since the last cross down, between M20 and M200, and the previous up cross
BX - The min price since the last up crossover, between M20 and M200, and the previous down crossover
You will need to use the A4_D template that shows
1. Simple Moving Average 20
2. Simple Moving Average 200
3. Period Separators
4. ASK line
Support
I will be happy to hear your recommendations to improve this product.
FREE
Features This EA uses Moving Average technical. This EA specializes in GBPJPY, so we recommend you apply it to that chart. Please apply this EA to the 15 minute chart. This EA is easy to manage because it has a maximum of 1 position. The maximum profit is set at 0 pips(Unlimited). The maximum loss cut is set at 80pips. You can add an EA position by pressing the add button. This EA is highly reliable because it is optimized using TICKDATA.
Parameters -----Basic parameter----- magic - Please set
FREE

Just INDY is a simple, and easy to use trend and reversal indicator. It will continuously monitor the movement of the price actions searching for new trends establishing or strong reversals at extreme overbought, and oversold levels.
Parameters Signal Perios
Sent Notification Please Test it with Strategy Tester and see how it work.
Happy Trading...
FREE

Delete All Pending Orders for MT4 script - closes absolutely all orders, whether pending or market ones.
Orders are closed at the current profit/loss indicators at the time of closing.
The script is suitable for moments when you need to quickly close all orders at the current indicators.
The script is very easy to use, just drag the script onto the chart and it will do its job.
Add me as a friend, I have many other useful products.
FREE

The Week7D indicator helps traders identify the day of the week on a price chart. It simply marks each period or each candle as the day of the week at the start of a new trading day. This allows traders to watch how prices move on any given day.
The Week7D indicator has several customization options that traders can use to change the visual representation of the indicator.
The variable "BarCount" changes the number of days during which the indicator will indicate the day of the week in each
FREE

The indicator is based on the elements of Bill Williams' trading system. Sell signals are formed when MACD and OsMA values are falling simultaneously (Bill Williams calls these indicators АО and АС in his book), while buy signals appear when both indicators are rising. Thick and thin colored histograms match MACD and OsMA values. If the histogram is greater than 0, the indicator value is rising. Otherwise, it is falling. Positions should be opened when the price exceeds the bar's high or low, at
FREE

Time to Trade Trading timing indicator is based on market volatility through 2 ATR indicators to determine the timing of a transaction. The indicator determines the times when the market has strong volatility in trend. When histogram is greater than 0 (blue) is a strong market, when histogram is less than 0 (yellow) is a weak market. Should only trade within histograms greater than 0. Based on the histogram chart, the first histogram value is greater than 0 and the second histogram appears, this
FREE

Supporting file (2 of 2) for T3 Cloud MA
Trend indicator derived from T3 moving averages. The cloud is bounded by a fast T3 and slow T3 lines. Buying/Selling opportunities above/below cloud. The fast and slow T3 MA lines can also be used as dynamic support/resistance for more aggressive entries. Use default values for best settings. The number of look back bars is user defined. This indicator can be used in combination with other strategies such as price action. Suitable for all time frames. P
FREE
This indicator displays the Laguerre Osc AM indicator signals on the price chart. The presented indicator uses the Laguerre filter to build a classical type oscillator, similar in its appearance and method of application to the regular MACD. At the same time, this tool is much more flexible in settings compared to the usual MACD and, thanks to the Laguerre filter, is more sensitive to price movements. Laguerre Osc allows you to choose the parameters in such a way as to be effective for almost an
FREE
The presented indicator uses the Laguerre filter to build a classical type oscillator, similar in its appearance and method of application to the regular MACD. At the same time, this tool is much more flexible in settings compared to the usual MACD and, thanks to the Laguerre filter, is more sensitive to price movements. Laguerre Osc allows you to choose the parameters in such a way as to be effective for almost any market or time period. Both the crossing of its zero value by the oscillator and
FREE

The purpose of this new version of the MT4 standard indicator provided in your platform is to display in a sub-window multiple timeframes of the same indicator. See the example shown in the picture below. But the display isn’t like a simple MTF indicator. This is the real display of the indicator on its timeframe. Here's the options available in the FFx indicator: Select the timeframes to be displayed (M1 to Monthly) Define the width (number of bars) for each timeframe box Alert pop up/sound/ema
FREE

The CandleStick Scanner is a tool that allow you to perform a market scan and search any candlestick pattern that you already created in the current chart, You can perform a quick search in the current chart (500 bars will be scanned), This is a lite version of CandleStick Factory for MT4 . The full version video can be found here : https://www.youtube.com/watch?v=fq7pLXqVO94 The full version can be purchased here: https://www.mql5.com/en/market/product/75628
How it works Y
FREE
The indicator allows you to simplify the interpretation of signals produced by the classical ADX indicator. The position of the thick bars of the histogram relative to zero and the histogram coloring indicate the direction of price movement determined by the intersection of DI+ / DI-. The position of the thin bars of the histogram relative to zero and the color indicate the strength of the price movement. A buy signal is generated when the price moves above the high of the last fully formed bar
FREE

The indicator uses the Chester W. Keltner's channel calculation method, modified by the well-known trader Linda Raschke. Due to the modification, the calculated channel contains a much more complete overview of the price movements, which allows increasing the probability of an accurate prediction of the upcoming price movement. Unlike the classic Keltner method, the base line of the channel is plotted based on the Exponential Moving Average, and the Average True Range is used to calculate the up
FREE

I make this indicator to help you for setting effective stoploss and getting more signals from following trends. This indicator helps to tell the trends and sideway, when 2 lines stand above of blue cloud, it means uptrend. When 2 lines stand above red cloud, it means down trend, the other else, it means sideway market. For taking order, you have to wait the arrows. You also need to see the cloud position, if the cloud's res, you have to wait the yellow arrow for selling order. If the cloud's bl
FREE
Minimalist and fully customizable info panel. It works on any chart and timeframe, with 2 - 4 digits brokers and with 3 - 5 digits ones. It can show: Current Spread in pips (1 decimal digit if you are on a 3 - 5 digits broker) ATR (Average True Range) in pips Current Server Time Current GMT Time Important Account Info: Current Leverage and Stop-out Level (%) Time left for the current bar. Very useful on 4 h charts All info labels have a tooltip with the same data Available customizations : Enabl
FREE

My notes is a simple indicator that will help you put any notes on your price chart. W ith one click you get as many notes as you choose from the menu. All blanks for your entries are lined up in one column. You only need to move the records to the right place on the graph and click on the record. The menu consists of four items: My_sum_Note number of entries , default 5 ; MyMessage Font font name, default "Arial"; MyMessage FontSize font size, default 10; MyMessageColor is the font color, Black
FREE
The technical indicator is a more advanced version of the relative strength index (RSI) that applies moving average convergence-divergence (MACD) principles to a double-smoothed RSI (DS RSI) indicator. The indicator is derived by computing the difference between a double-smoothed RSI and a simple moving average (SMA) of the DS RSI. The indicator's intent is to provide more accurate buy and sell signals than the standard RSI calculation.
The MACD is derived by subtracting the 12-period expone
FREE

Dieser Expert Advisor ist ein Trendfolge Roboter. Der Expert Advisor hat sehr viele Einstellungen und sollte im H1 EURUSD eingesetzt werden.
Es ist auch möglich diesen Roboter GBP zu verwenden, auch sind andere Timeframes möglich.
Nachdem sehr viele Einstellungen möglich sind, kann sehr viel getestet werden.
Ziehl ist es mit diesem Roboter langfristig erfolgreich zu sein.
FREE

Tool to send alerts to the phone when the account is in a negative balance.
- Push Noti to phone: Enable Push notifications to phone - Percents Equity/Balance, %: Percents loss - Loss amount, -$: Money loss Note: You need to Enable Push notifications on MT4 and enter your MetaQuotes ID The tool only serves the function of sending notifications to your phone when the account is in a negative balance
FREE

Order management can become difficult, especially when many orders are open at the same time, long and short. With the standard tools from Metatrader, only one order can be changed at the time.
In case you want to change the stop loss level or the take profit level of all your open orders this tool is for you. This tool allows to change easily the Take Profit level of ALL the open orders with a simple "Drag and Drop" on the chart.
All the orders with the same chart symbol will be modified. Add
FREE

The purpose of this new version of the MT4 standard indicator provided in your platform is to display in a sub-window multiple timeframes of the same indicator. See the example shown in the picture below. But the display isn’t like a simple MTF indicator. This is the real display of the indicator on its timeframe. Here's the options available in the FFx indicator: Select the timeframes to be displayed (M1 to Monthly) Define the width (number of bars) for each timeframe box Alert pop up/sound/ema
FREE

This indicator draws on the chart high and low prices of different periods . And If you want, Indicator can alert you when the current price arrive these levels. Alert Options: Send Mobil Message, Send E-mail, Show Message, Sound Alert Time Periods: M1, M5, M15, M30, H1, H4, D1, W1, MN Inputs: TimeShift: You can set start hour for calculating. And that way you can see levels independently from broker server's time-zone. PipDeviation: You can set price sensibility for alert (Default: 3) Lines
FREE
Il MetaTrader Market è il posto migliore per vendere robot di trading e indicatori tecnici.
Basta solo sviluppare un'applicazione per la piattaforma MetaTrader con un design accattivante e una buona descrizione. Ti spiegheremo come pubblicare il tuo prodotto sul Market per metterlo a disposizione di milioni di utenti MetaTrader.
Ti stai perdendo delle opportunità di trading:
- App di trading gratuite
- Oltre 8.000 segnali per il copy trading
- Notizie economiche per esplorare i mercati finanziari
Registrazione
Accedi
Se non hai un account, registrati
Consenti l'uso dei cookie per accedere al sito MQL5.com.
Abilita le impostazioni necessarie nel browser, altrimenti non sarà possibile accedere.