Multiple Timeframe Trendline and Horizontal
Support/Resistance Drawing Indicator
Overview:
Requiring an indicator that will draw both trendlines and
horizontal support/resistance on multiple timeframes and will display all on
current timeframe.
Rules for Trendlines
Trendline drawing will be based on zigzag peaks.
For resistance trendlines: : the most recent completed
zigzag peak (to the left) that is higher than current price will be connected to
the next most recent peak (to the left of previous peak) which is also higher
than the first identified peak. A ray will join the peaks an project the line forward (to the right)
For support trendlines: : the most recent completed zigzag low
(to the left) that is Lower than current price will be connected to the
next most recent low (to the left of previous peak) which is also lower than first
identified peak. A ray will join the peaks an project the line forward (to the right)

Rules for Horizontal Support and Resistance
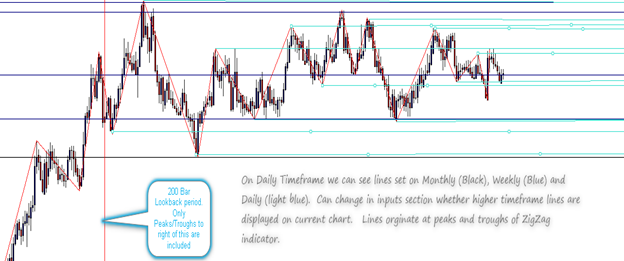
Horizontal Support and Resistance will be all Zigzag peaks
and troughs (highs/lows) during a “lookback” period. Lookback period will be 200 bars of the chart
the lines are being drawn on. A ray is draw from the origin of each
peak/trough and projected forward (to the right)
Similar to trendline rules – horizontal support and
resistance will be drawn on each timeframe, coloured different (same colour as
trendlines) and visible on the current timeframe (can be changed in inputs
settings).
Additional Requirements:
·
Can display all higher trendlines on current
chart.(options in inputs to disable or customize)
·
As zoom in and out on a chart, should be able to
see all relevant lines.
·
Will use standard zigzag with MT4 package – code
must be internalized. If coder can
recommend another version of zigzag that is more efficient/responsive would be happy
to hear recommendations.
·
Extensive comments are required in source code.
This will be used in another indicator and needs to be easily understood by
future coders to be modified later. Every aspect of the Indicator must be documented with comments.
·
Timeframes to be included are: Monthly, Weekly,
Daily, 4Hr, 1Hr, 15min, 5min, 1min
·
**If a trendline happens to use the exact same
two zigzag peaks which were used on a higher timeframe trendline, the trendline on the current
timeframe will not be drawn. This is
important. Only the higher timeframe
trendline that uses those zigzag peaks or troughs will be included. Please ask for clarification if this in
unclear. Horizontal Support and Resistance lines don't require this rule.
Inputs
-
ZigZag Inputs can be set:
Depth/Deviation/Backstep
Lines drawn on different timeframes will have
different colours. Ex lines drawn on all
monthly will be same colour. All drawn on weekly are different colour than monthly etc.. –
Colours for each can be set in inputs. Colours are the same for trendlines and
horizontal lines of same timeframe.
-
Can chose timeframes to display.
o Display Current and all Higher Timeframes (true/false) (DEFAULT)
o
Display Only Higher Timeframes (true/false)
o
Display x timeframes (can customize which
timeframes to display ex: Daily, Weekly, Monthly)
- Horizontal Support and Resistance Lookback
Period. Default will be 200 Bars
Have options to chose to display Trendlines, Horizontal
Support and Resistance, or Both. Display BOTH is default.
Ordini simili
Hello i am seeking a skilled MetaTrader 5 (MQL5) developer to modify an existing Telegram signal copier. The goal is to enhance the copier's functionality, reliability, and user experience. kindly bid this job to get started immediately
Hello, I’m looking for assistance with creating or customizing a TradingView indicator to suit my trading needs. If you have experience in this area, please reach out. Your help would be greatly appreciated. Thanks
Where are my developers colleagues . i want you to support me on existing work i just need a little addon on it. Am still a student kindly support me. You will be get paid at the end of the work. If you want more details maybe the worth of the project or any other thing let me know. THNAKS FOR THE SUPPORT
** Entry Condition **: - ** For Long**: The trade is entered **after BB + ** is confirmed. - ** For Short *: The trade is entered **after BB -* is confirmed. ### 2nd **Stop Loss **: - ** For long Entries *: stop loss is triggered on a ** candle close above the high* of the breaker block shown by the indicator. - ** For Short Entries **: stop loss is triggered on a ** candle close below the low ** of the breaker block
Hello, am in need of a developer that can help in developing a trading bot that can effectively navigate the foreign exchange (Forex) market or other financial markets to generate passive income. My objective is to create a sophisticated algorithmic trading system that can consistently produce profitable trades with minimal manual intervention. I am seeking a reliable and efficient solution that can be tailored to my
am looking for who help me convert tradingview indicator to mt5 car trading strategy and make sure you are an expert before u apply to this and also my budget for this is 30$ so the name of the indicator is Breaker Blocks with Signals (LuxAlgo) ### 1. ** Entry Condition **: - ** For Long**: The trade is entered **after BB + ** is confirmed. - ** For Short *: The trade is entered **after BB -* is confirmed. ### 2nd
I have a custom MT4 indicator that I need converted to MT5. I'll share the source code with the applicants. Please only apply if you have vast experience in converting complex indicators successfully to MT5, and making sure that the MT5 version functions exactly the same as the MT4 version
I need an expert to help me convert chopzone traingview pinescript to mt4, I need an expert to get it done for me on between 1 to 2 days i hope this will be done by then, i will attach the file and my budget is $30 as of minimum here
Looking for someone to edit/optimize and existing NN (neural network) in my EA so it is more compatible/profitable with the multiple strategies. The expert advisor is a portfolio expert advisor consisting of 33 separate advisors/strategies compiled into one. A NN has been added to the EA but it does not compliment or help the EA's performance. I've attached the original EA (without NN) as well as the EA with the NN
Procuro programador que consiga modificar essas estratégias, com a mesma capacidade de alteração das suas funcionalidades. Reitero, não consegui contato com o programador da fonte, nem mesmo mandando diversas mensagens no telegram! br.tradingview.com/script/PfpFNXyI-Braid-Filter/ br.tradingview.com/script/kv8N05R7-AlphaTrend-Screener/ Ambos os indicadores precisam agir em conjunto, tanto para as funcionalidades em