Lavoro terminato
Specifiche
Hello, I need an EA / Button on chart that trades automatic or semi-manual for me.
* Trade opening
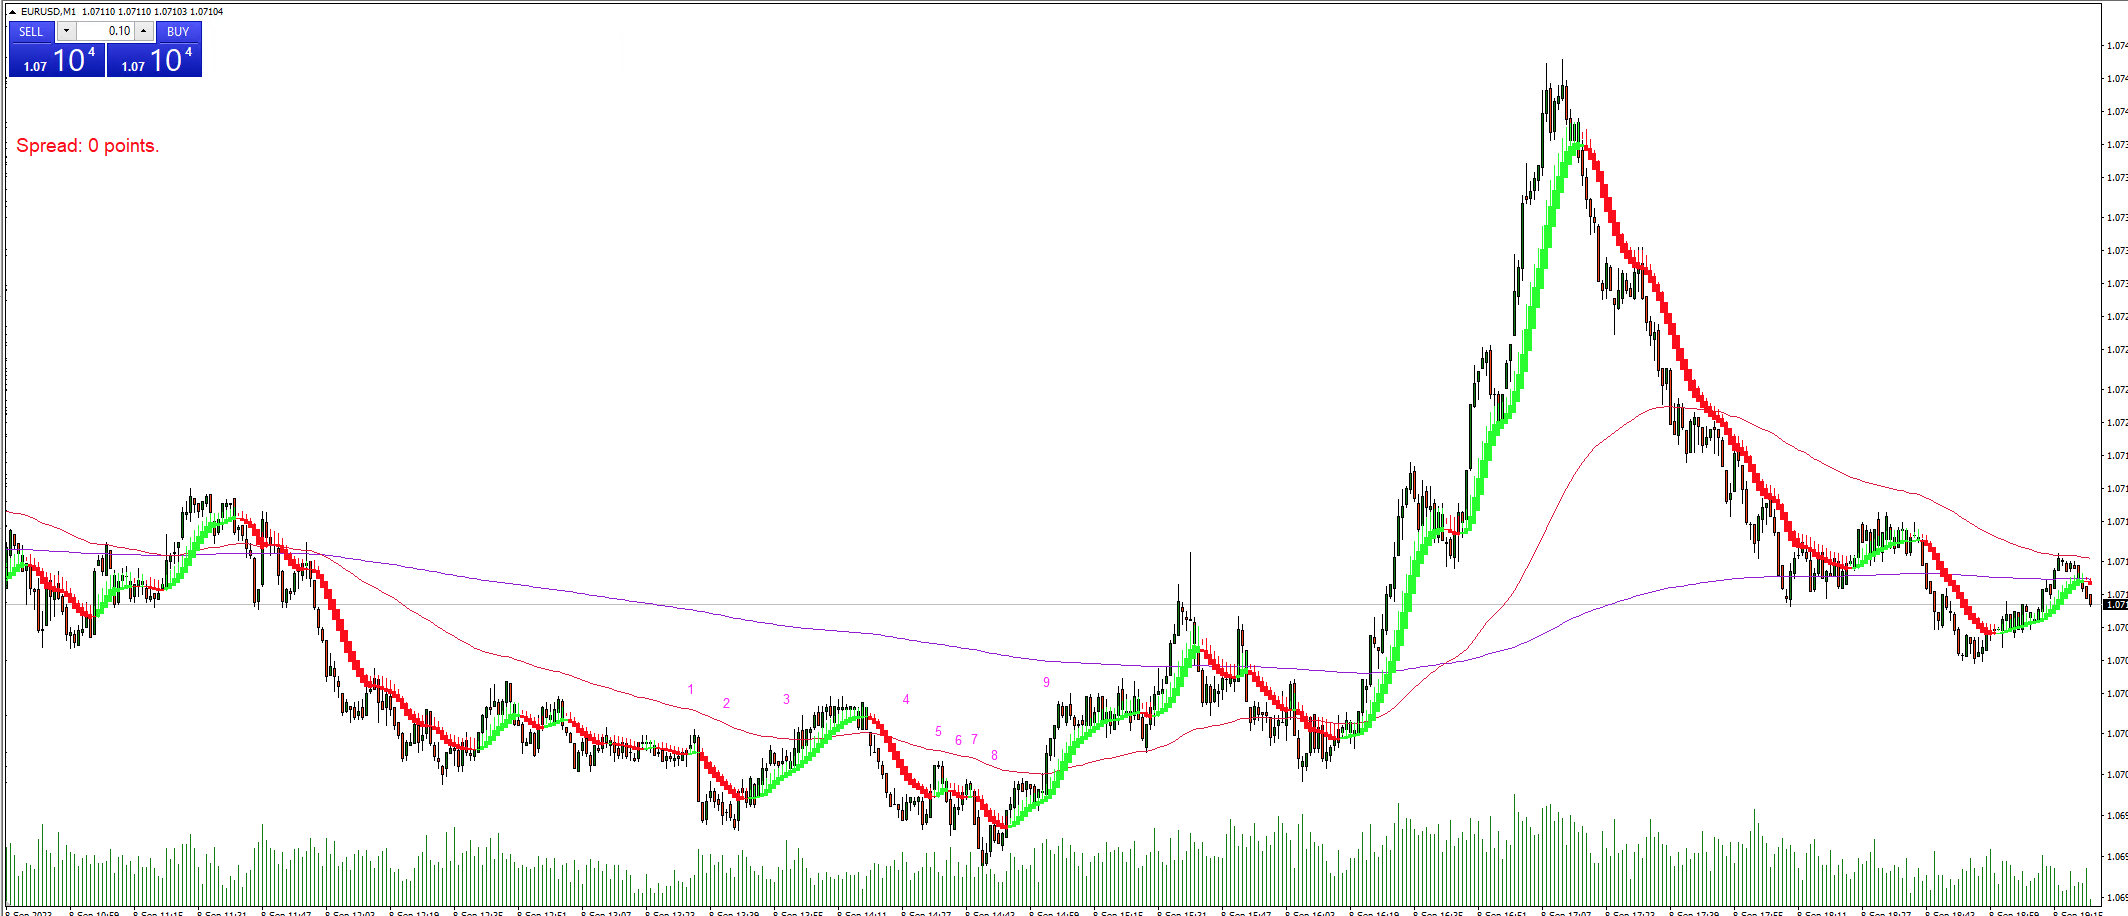
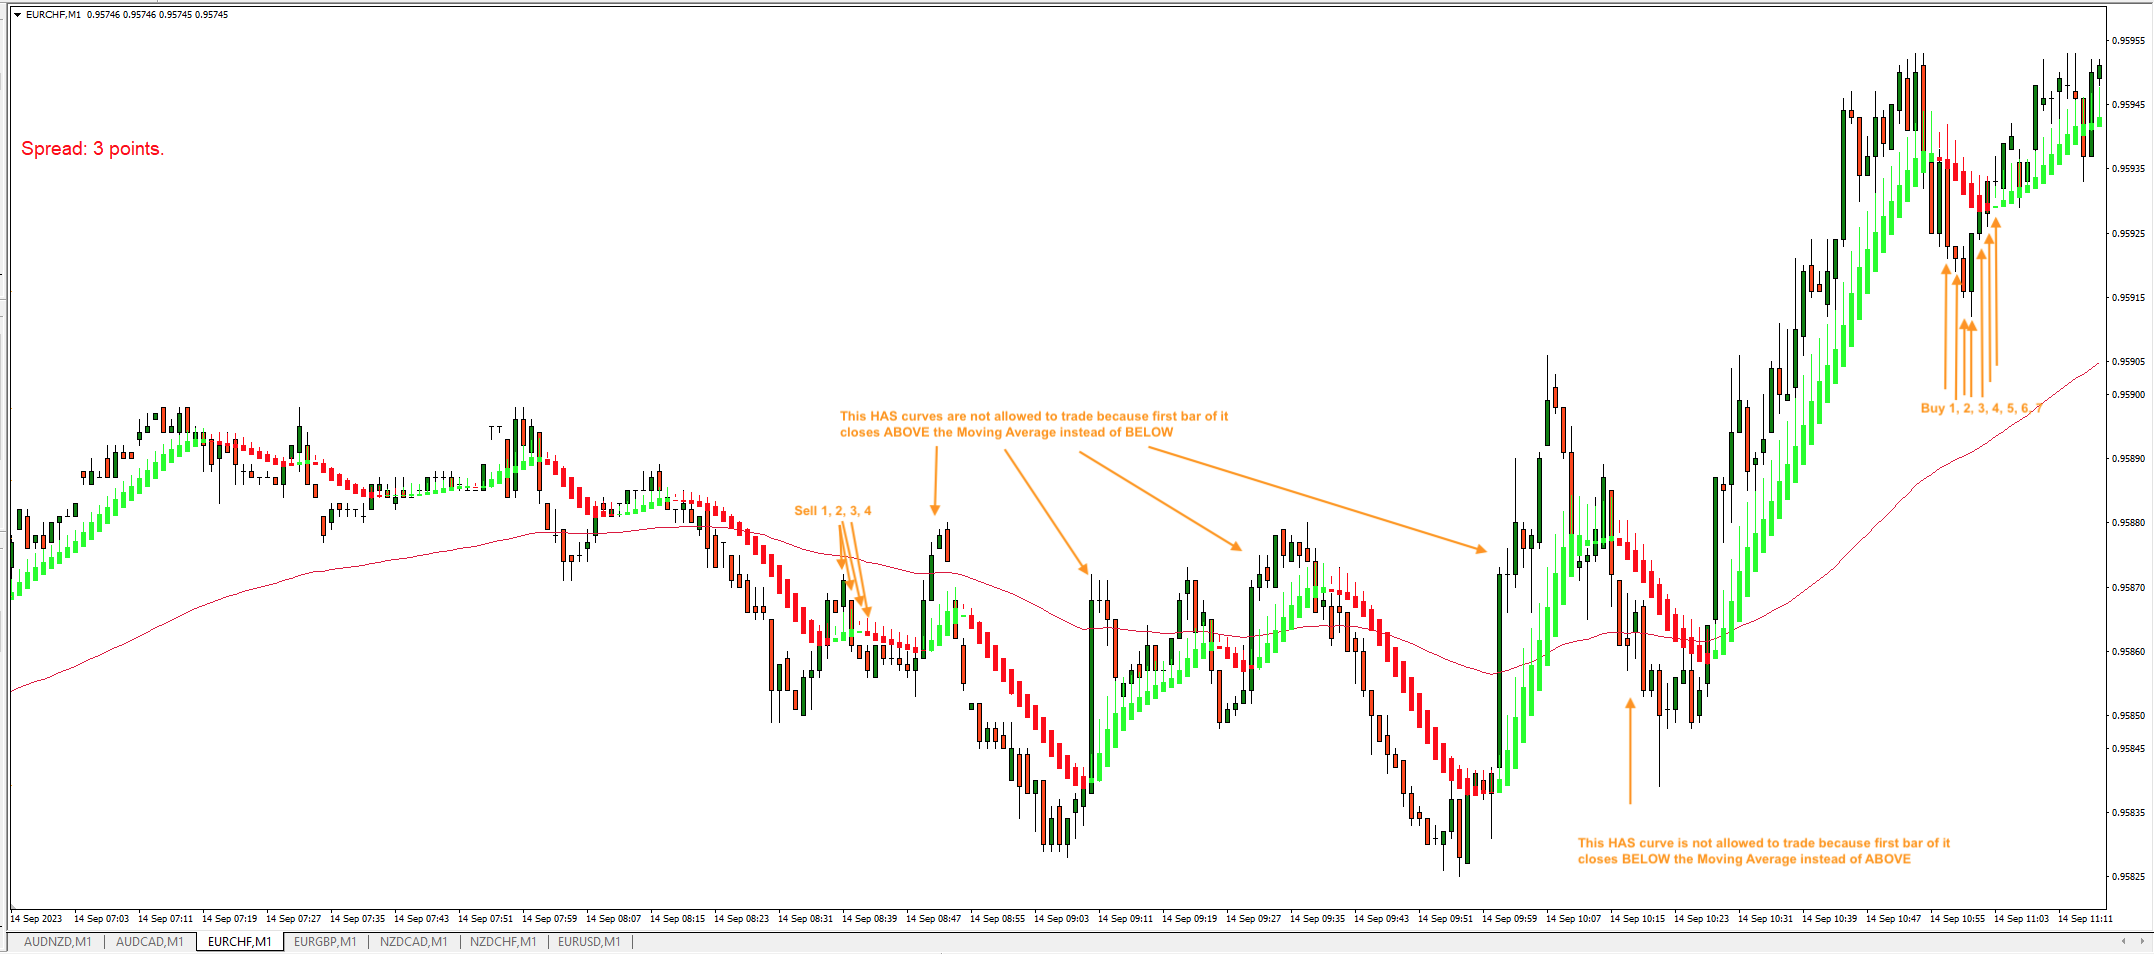
-When bar closed above Moving Average and Heiken Ashi Smoothed reversed (red color) towards Moving Average: Take one BUY trade every bar of the selected timeframe. Until HAS reverses again.
-When bar closed below Moving Average and Heiken Ashi Smoothed reversed (green color) towards Moving Average: Take one SELL trade every bar of the selected timeframe. Until HAS reverses again.
See example 1*
Note: Only start trading after HAS colorchange is confirmed (which means: closed bar). You only stop trading after HAS colorchange is confirmed (which means: closed bar).
Heiken Ashi Smoothed indicator to use:
link https://www.mql5.com/en/code/7930
Setup:
a) 1 (E)MA (moving average)
b) 1 HAS (Heiken Ashi Smoothed)
c) 1 Trade/Pause Button on chart (When clicked it starts directly the trading according the trading rules, when clicked again it stops directly the trading BUT it handles the still open trades according to the TP and SL rules of that curve)
d) A separate Live Profit/Loss button on chart for every traded HAS curve (When clicked it closes all trades of that HAS curve)
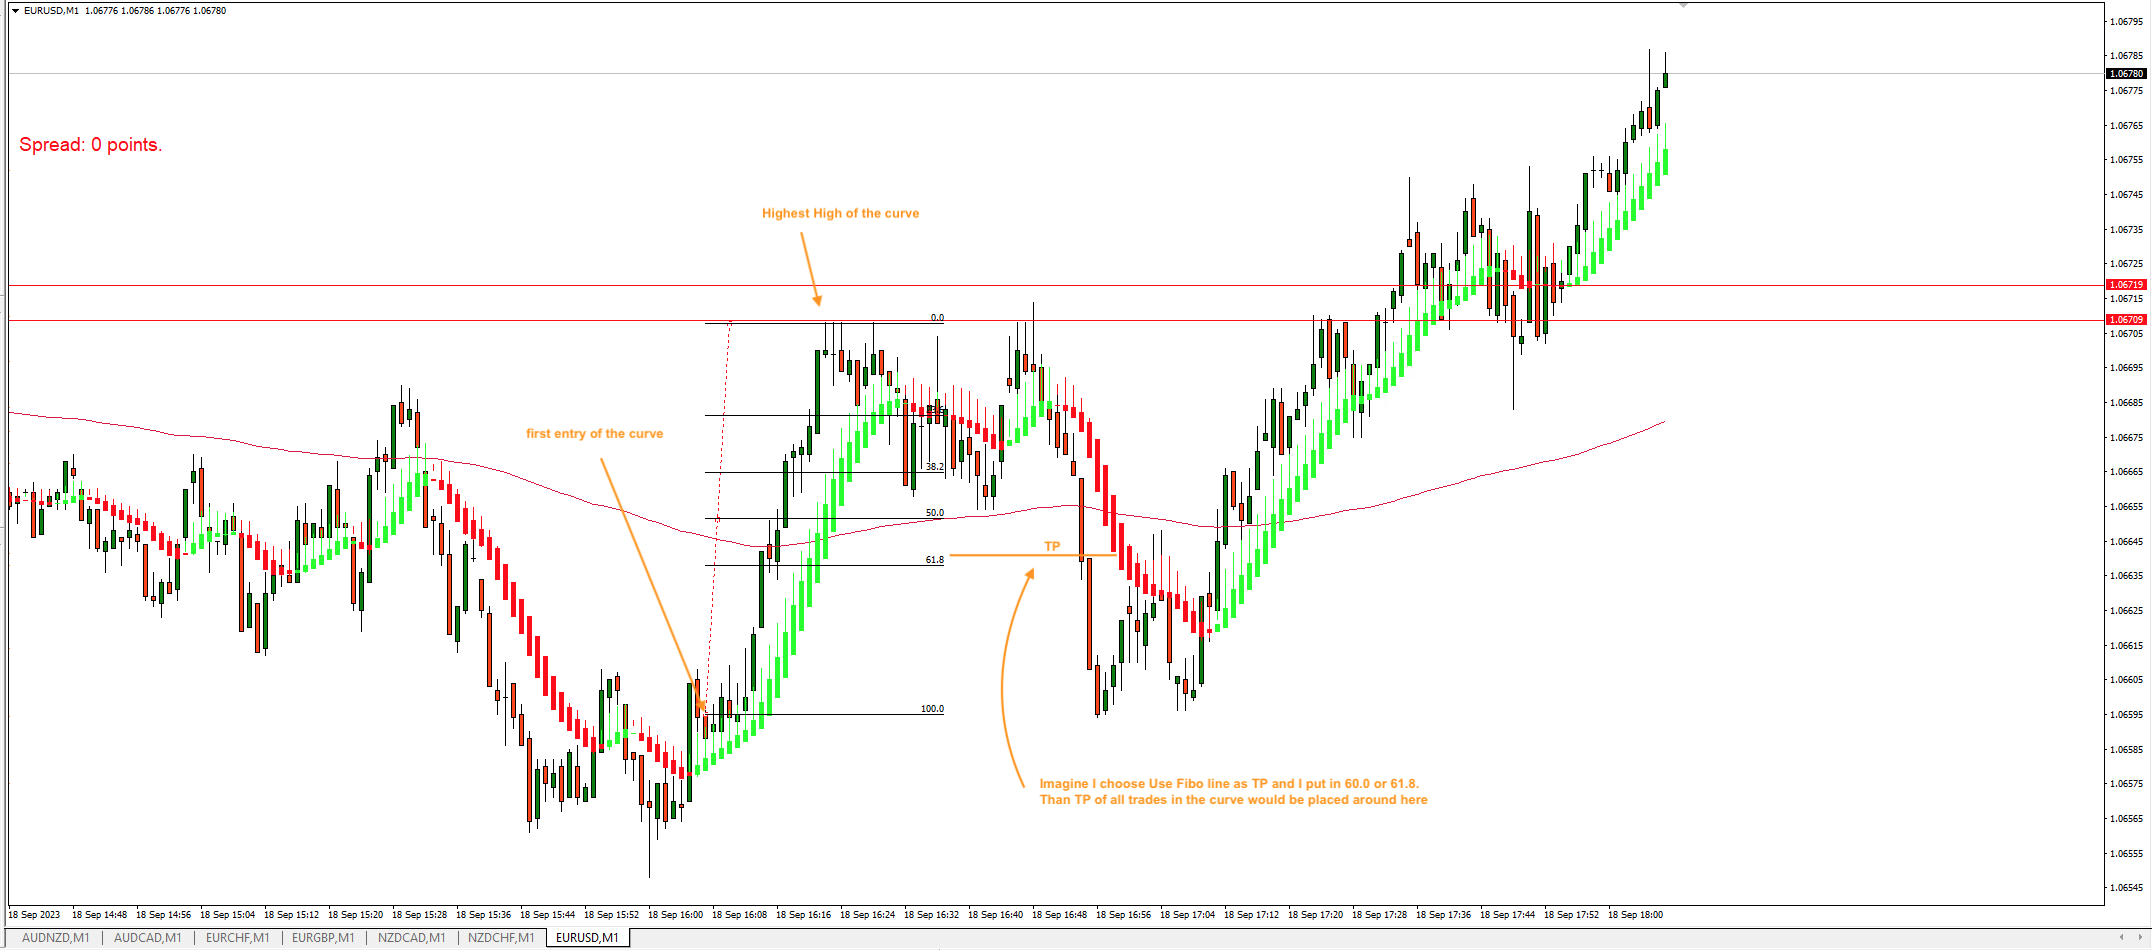
e) Fibonacci lines after a HAS curve is finished (when color of HAS changes)
f) Use Fibo line as TP (0 = disable)
Explanation: when a Fibo value is put in (let’s say 61.8), all trades of the corresponding HAS curve get a serverside TP at the Fibo value, after the curve is finished
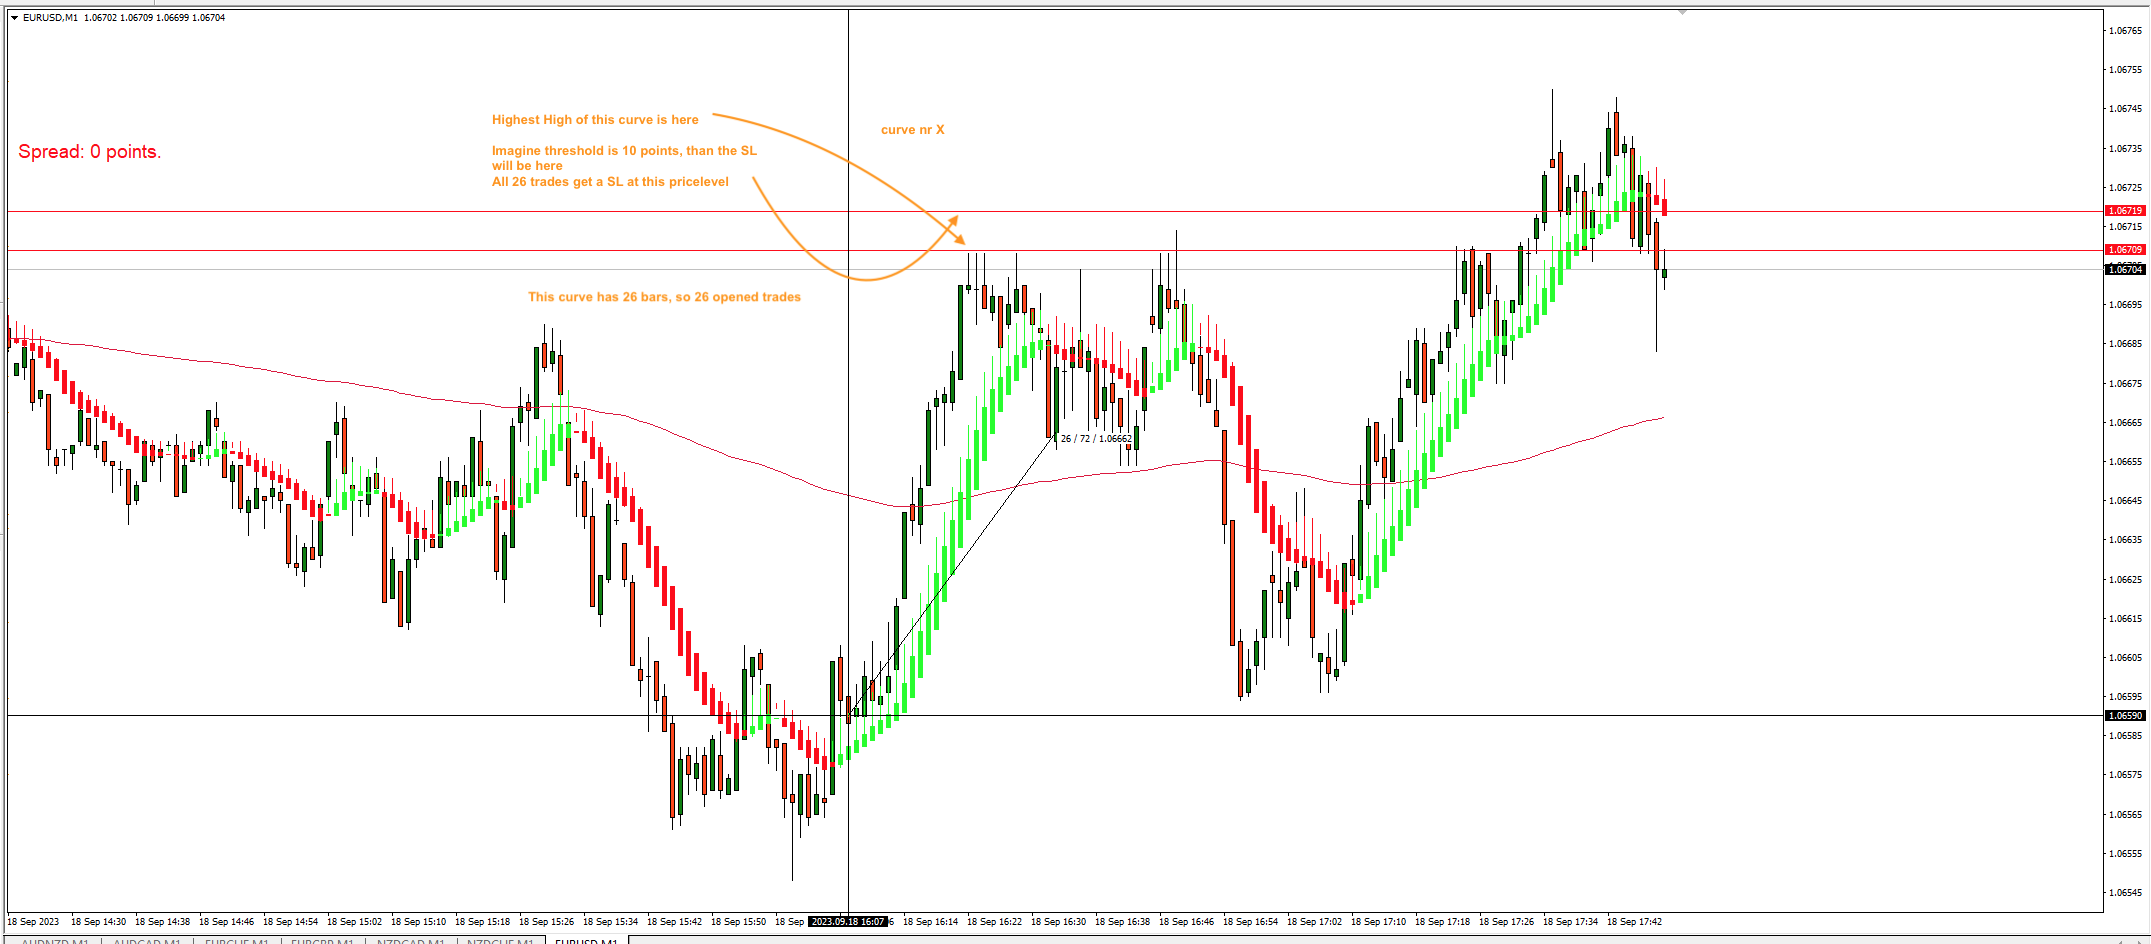
g) Stop Loss onder Highest High or Lowest Low of finished HAS curve: false/true. With threshold in points under HH or LL.
Explanation: when true, the EA places a serverside SL under LL or HH, at LL+threshold or HH+threshold
Step 0
The EA / Button is loaded. Trading starts (default the button is Active, when I click the Trade/Pause button, trading is Paused)
Step 1
Every traded HAS curve gets a number, please make it visible on chart too.
(If it is complicated to give only the traded HAS curves a number, you can give a number to every HAS curve instead)
See example 2*
Step 2
Give every trade a Comment when opened: <curve nr>.<trade nr>
If curve 3 has 10 bars, the comments will be: 3.1 for first trade, 3.2 for second trade, 3.3 for third trade, etcetera.
Step 3
Create the separate Live P/L button for the curve, showing the live P/L of that curve. When I click that button: all trades of that curve are closed and the button disappears (as long as no new trades on that curve are opened).
Give this button the following text information in it: curve number + Live P/L of that curve
Step 4a
When HAS curve is finished (color changes) and if SL is selected true: place serverside stop losses for every trade in that curve, at LL+threshold or HH+threshold.
See example 3*
Step 4b
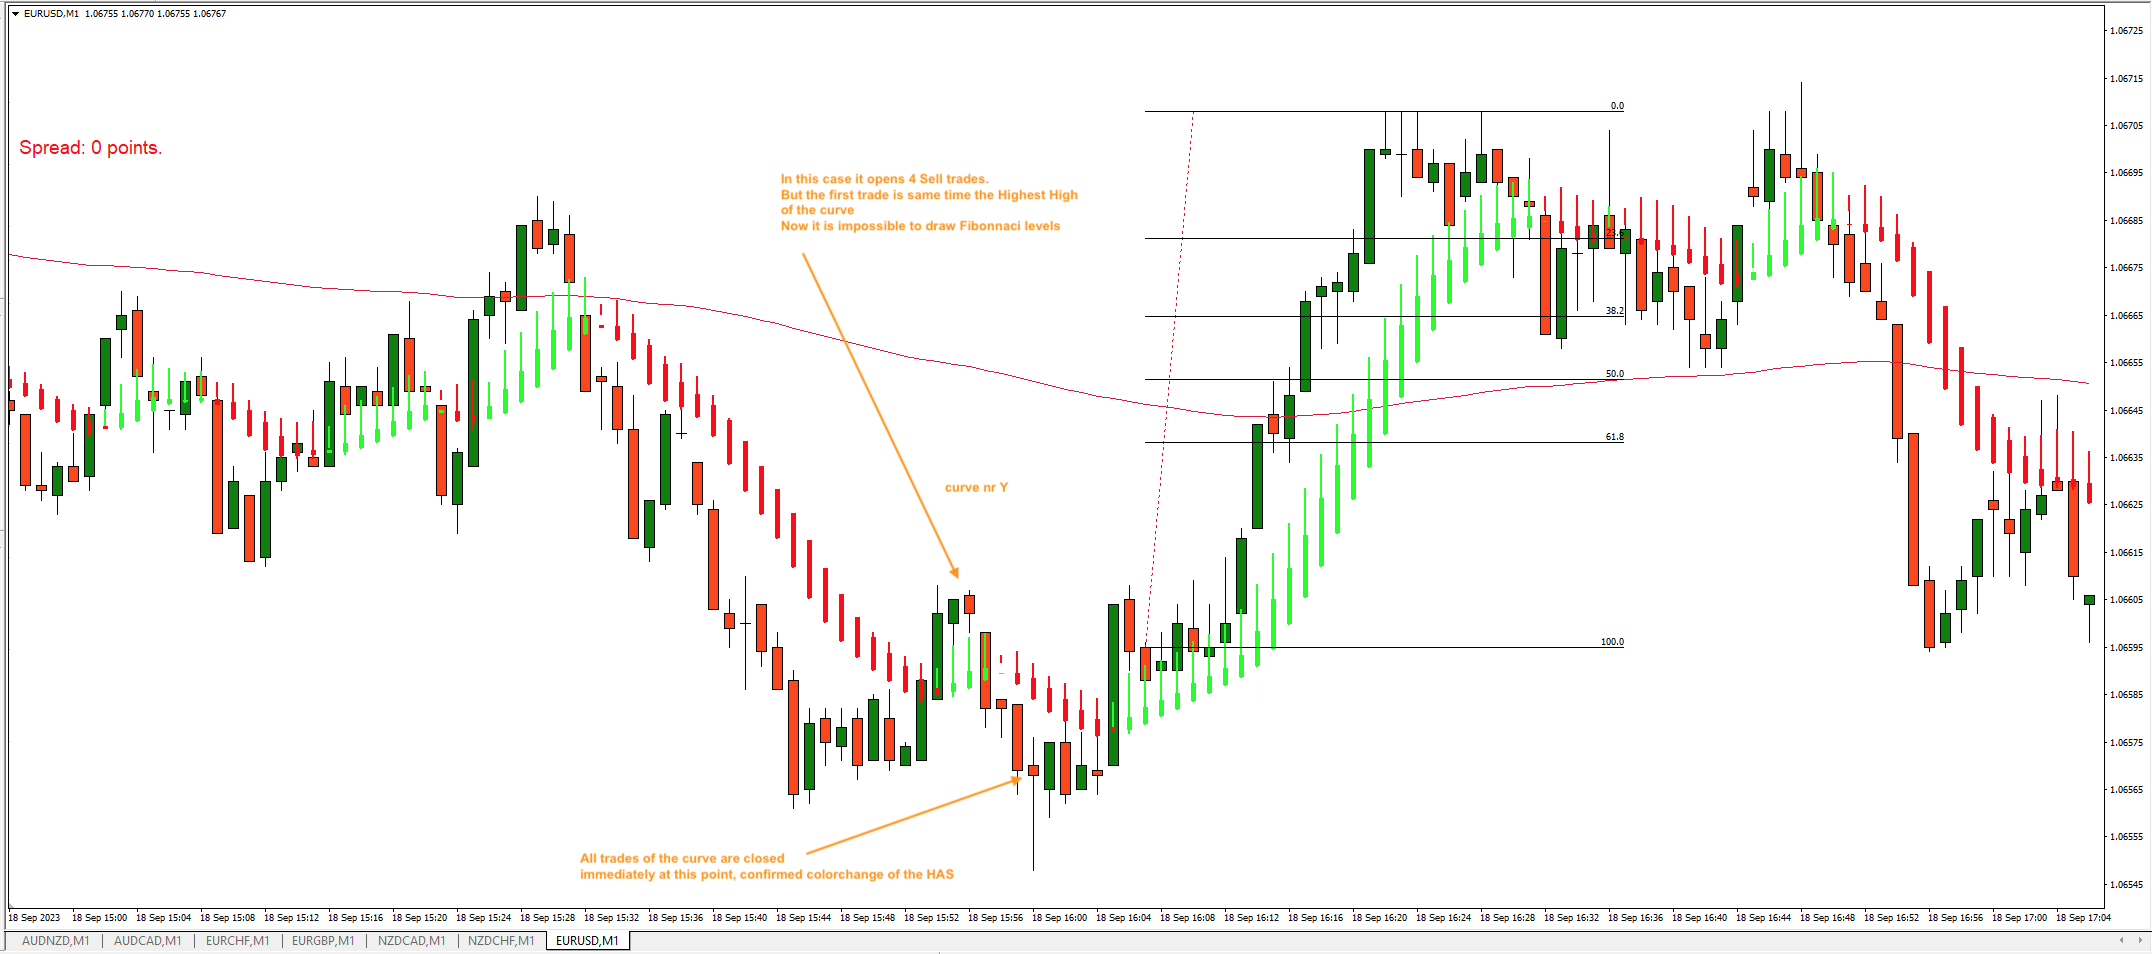
When HAS curve is finished (color changes): draw Fibonacci lines.
To start with the level of the first trade of that curve, until Lowest Low or Highest High, depending on directions.
See example 4 how to draw them*
Exception:
In some circumstances it is not possible to draw the Fibonacci lines (see example 5*).
In that case: all trades of that curve are directly closed at color change (and separate Live button of that curve is removed as well)
Step 5
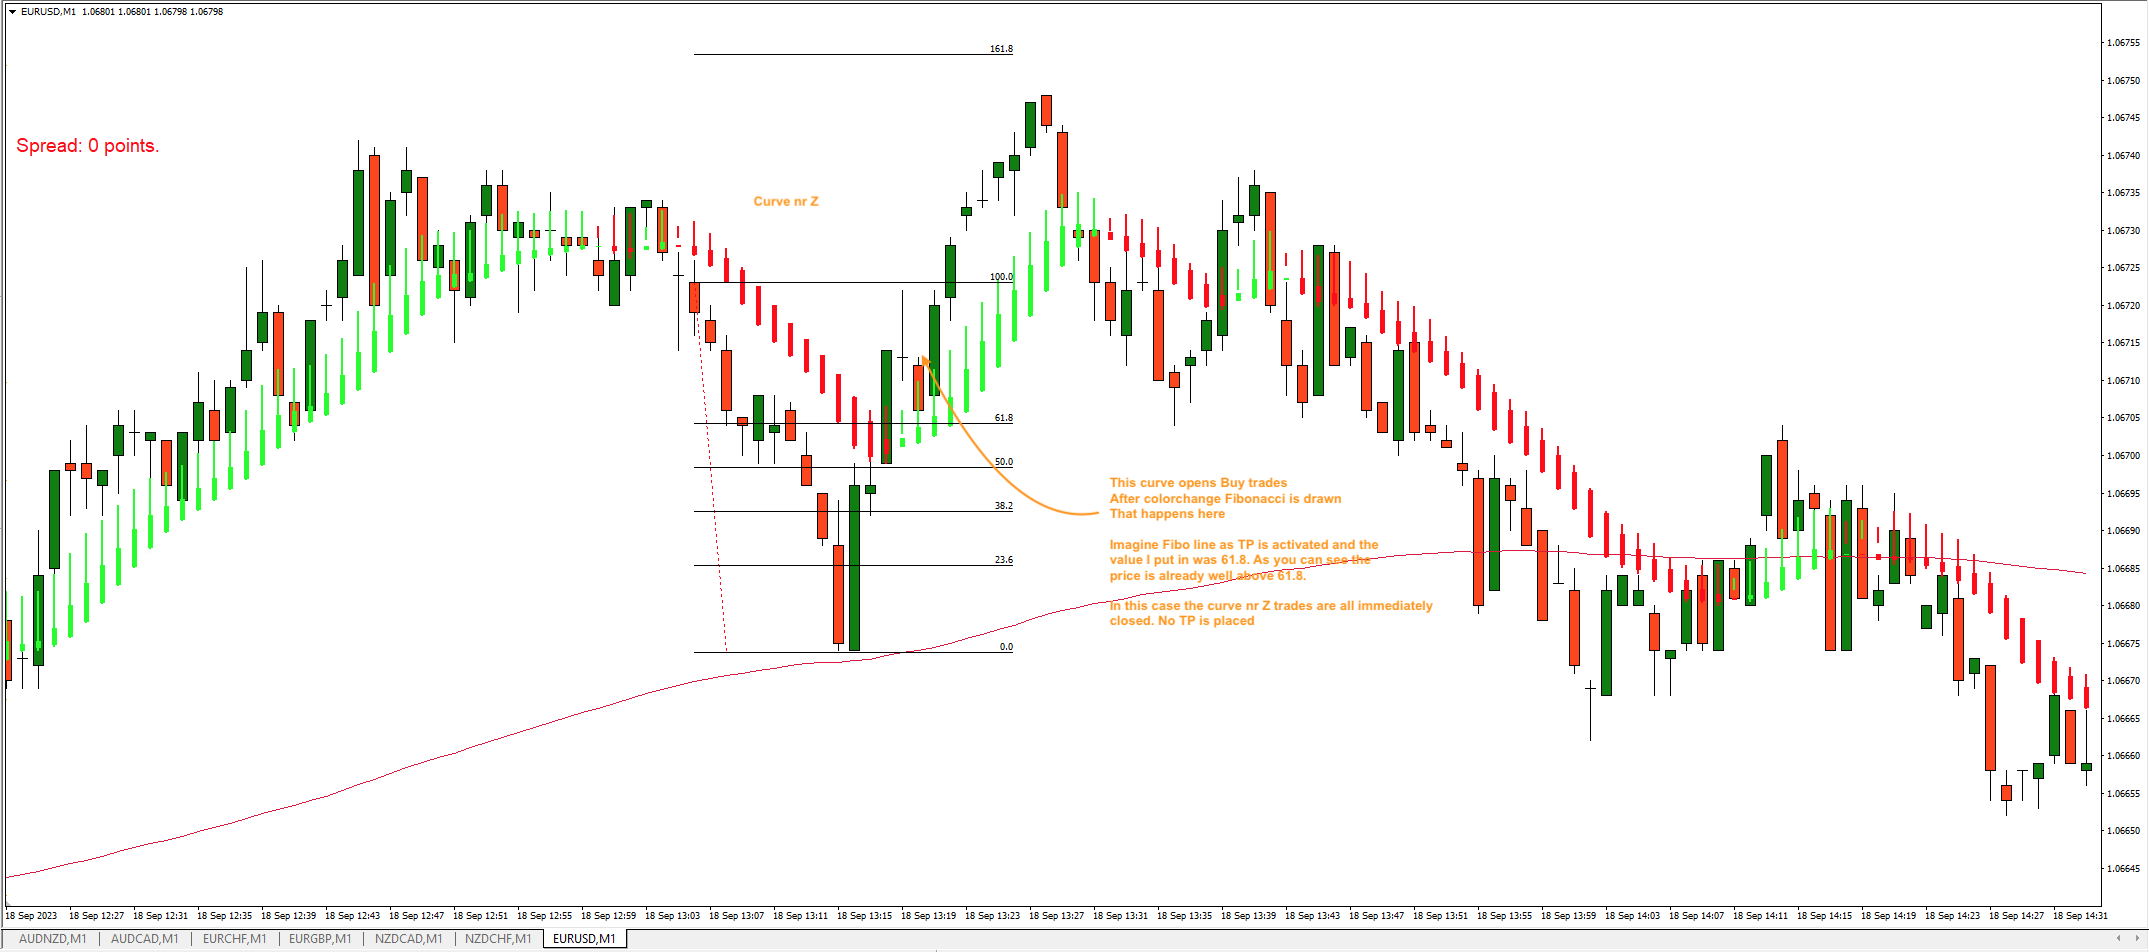
IF Use Fibo line as TP is selected: Put serverside TP levels at the Fibo value for every trade in the curve
Pay attention here: IF that TP level is reached, the separate Live P/L button of step 3 is removed as well. The curve is finished.
Exception:
Sometimes at the moment of drawing the Fibo, the current price is already above the selected Fibo value for TP (see example 6*).
If Fibo value of TP is already passed: No serverside TP is placed but all trades of that curve are directly closed (and separate Live button of that curve is removed as well)
Other settings:
-lotsize
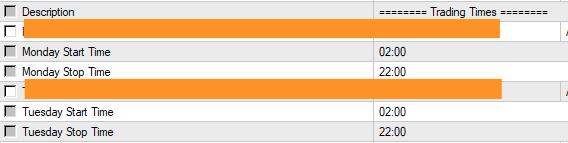
-trading times (see screenshot 7)
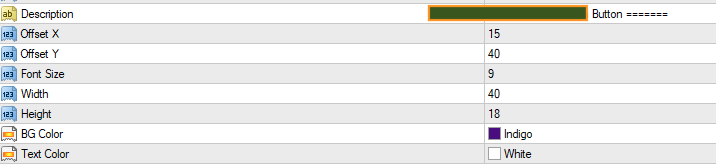
-size and text of buttons must be editable (see screenshot 8)
Outside trading times the Trade/Pause button is ‘dead’. It can not activate trading.