Lavoro terminato
Specifiche
We would like to create an EA doing the following functions.
The EA needs to be based on MACD and RSI.
Major view should be in M3 view but should also be available in all other timeframes.
The EA shall execute 3 strategies however there are some concerns in terms of their implementation as the timeframes of the strategies are overlapping. Strategy A start from 2:00 am until 9:00, Strategy B from 6:00 am until 13:00 pm and Strategy C from 9:00 am to 15:00 pm.
The EA shall also include a parameter where we will be able to change the start and stop timeframe of each strategy.
For example:
Between 2:00 to 6:00 am if we get a signal for strategy A and trade will open.
Then at 6:00 am when strategy B overlaps with strategy A we get a signal with an opposite direction of the last signal then the existing trade shall close and a new trade shall open based on the new signals of strategy B.
However, if strategy B generates signal with the same direction of the last signal we received from strategy A, then no new transactions shall be executed but continue with the existing one.
In case we don’t get any signal from strategy A, but we get a signal from strategy B then the EA shall open a transaction based on strategy B.
This example applies to all three strategies, between strategy A to strategy B and strategy B to strategy C
Strategy A
Strategy implementation interval 2:00 to 9:00am platform time. It shall also include an adjustable parameter in the EA.
Combination of RSI & MACD
Strategy shall also include a disable/enable parameter.
BUY Condition
RSI: = < 30*
MACD: Previous BAR > current BAR
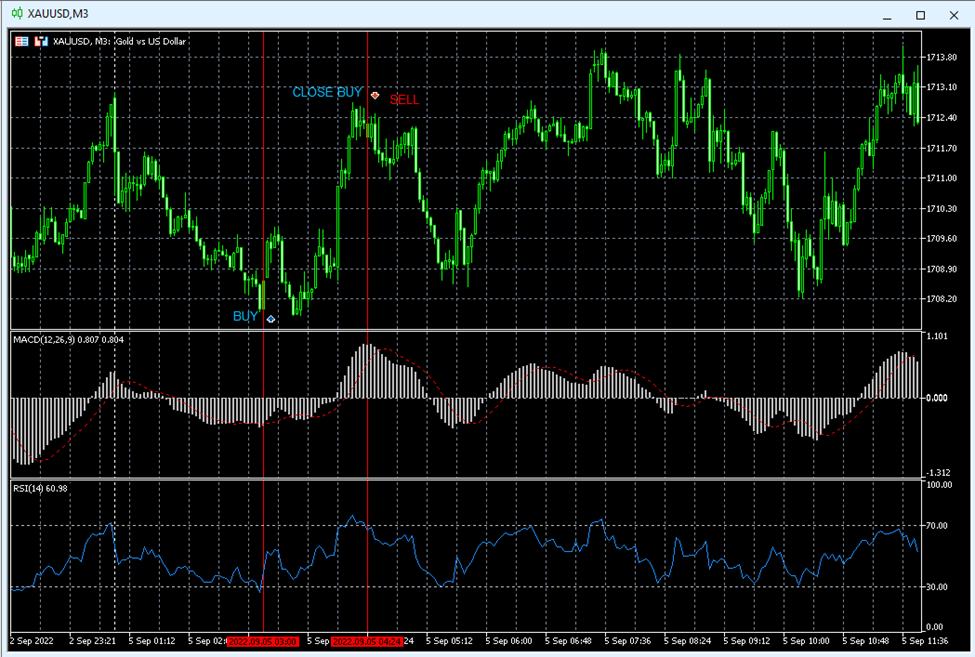
SELL Condition
RSI: > = 70 *
MACD: Previous BAR > current BAR
All the above positions should be closed when opposite signal appears and open a new position based on the new conditions of the signal.
***** The number of the RSI limits * (30 and 70) shall also include an adjustable parameter in the EA in case we wish to change the limits.
Strategy B
Strategy implementation interval 6:00am to 13:00pm platform time.
It shall also include an adjustable parameter in the EA.
Combination of RSI & MACD
Strategy shall also include a disable/enable parameter.
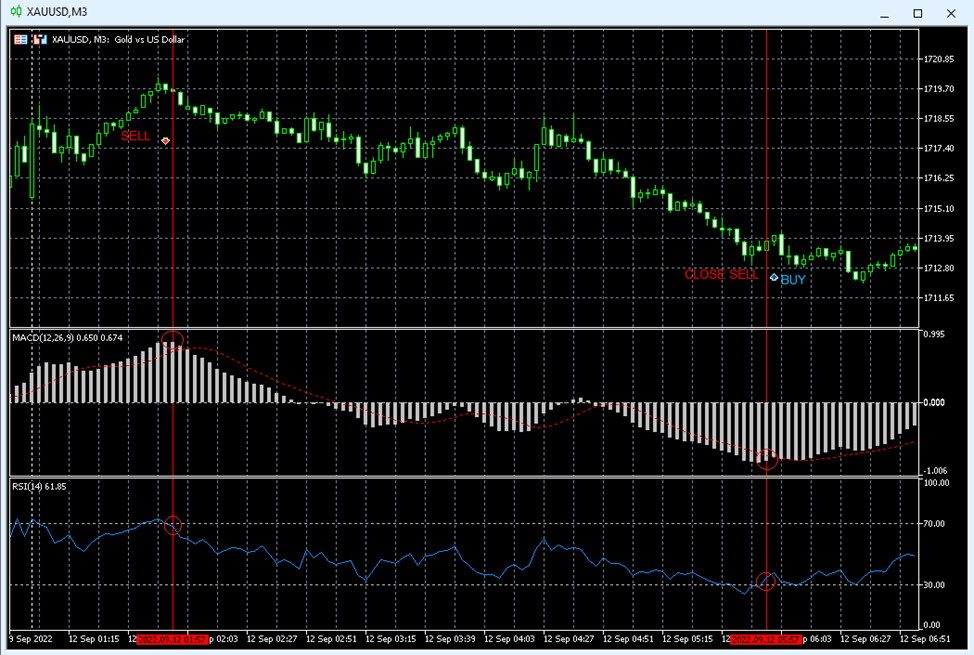
BUY Condition
RSI line cross upwards 30*
MACD: Previous BAR > current BAR
The above indication shall execute a trade only when it appears in two consecutive times. Therefore, when the above indication appears for the first time the EA shall ignore it and don’t execute any trade but count its occurrence. So, concluding, in case the above indication appears for the first time this will count its occurrence and not execute.
Execution will happen when we have the second signal as above.
SELL Condition
RSI line cross downwards 30*
MACD: Previous BAR > current BAR
The above indication shall execute a trade only when it appears in two consecutive times. Therefore, when the above indication appears for the first time the EA shall ignore it and don’t execute any trade but count its occurrence. So, concluding, in case the above indication appears for the first time this will count its occurrence and not execute.
Execution will happen when we have the second signal as above.
All the above positions should be closed when opposite signal appears and open a new position based on the new conditions of the signal.
***** The number of the RSI limits * (30 and 70) shall also include an adjustable parameter in the EA in case we wish to change the limits.
Strategy C
Strategy implementation interval 9:00am to 15:00pm platform time.
It shall also include an adjustable parameter in the EA.
Based in MACD and Price on Graph
Strategy shall also include a disable/enable parameter.
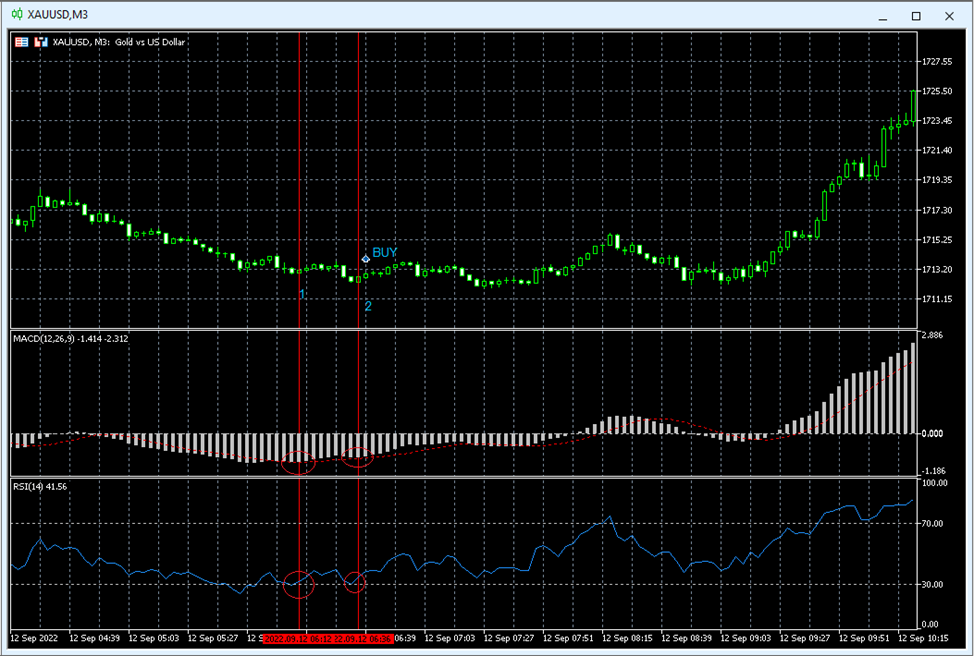
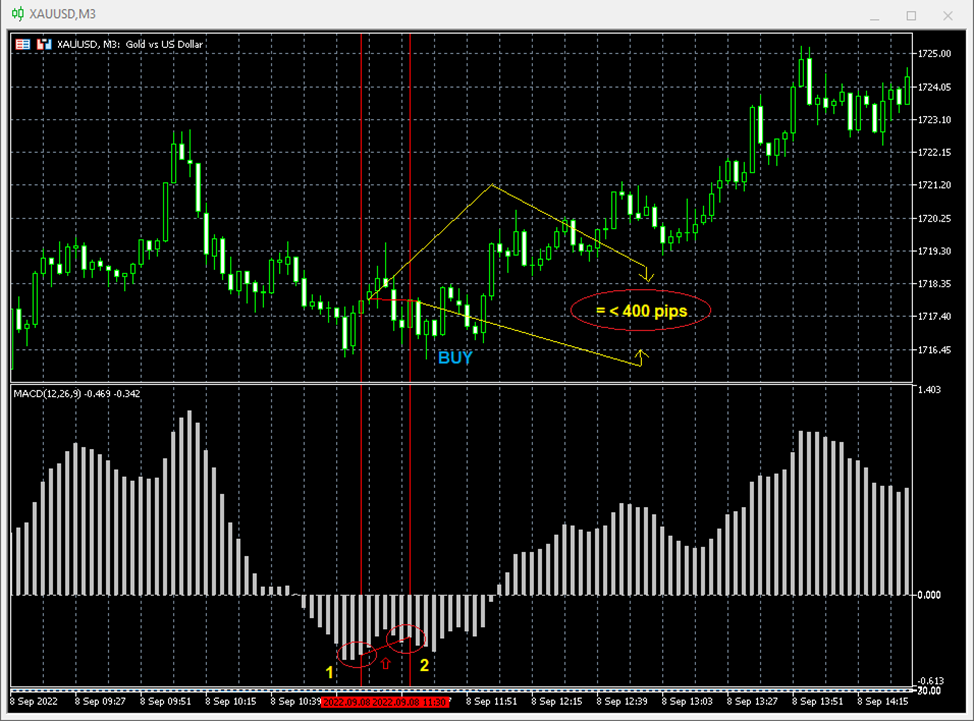
BUY Condition
MACD bars fell – 0 limit and we have a bar which shortens from previous one towards 0 then is considered as signal 1 but do not execute. In the second time we execute but the price should be (= < 400 pips). For example, as in the below screenshot, signal 2 must be closer to 0 limit of MACD in comparison to signal 1. Also, the price of the instrument shall not be higher than *400pips.
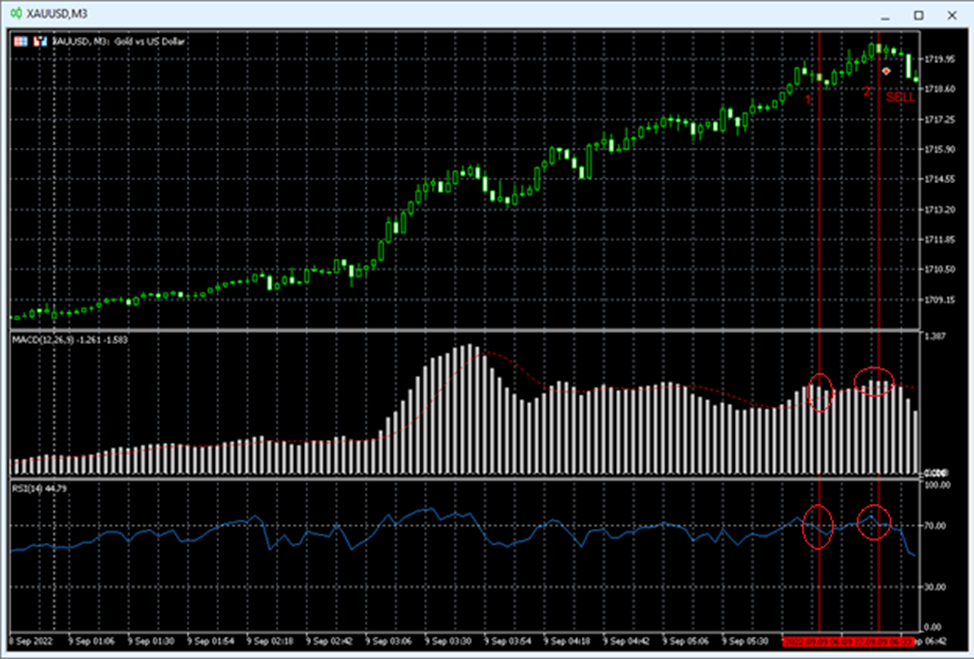
SELL Condition
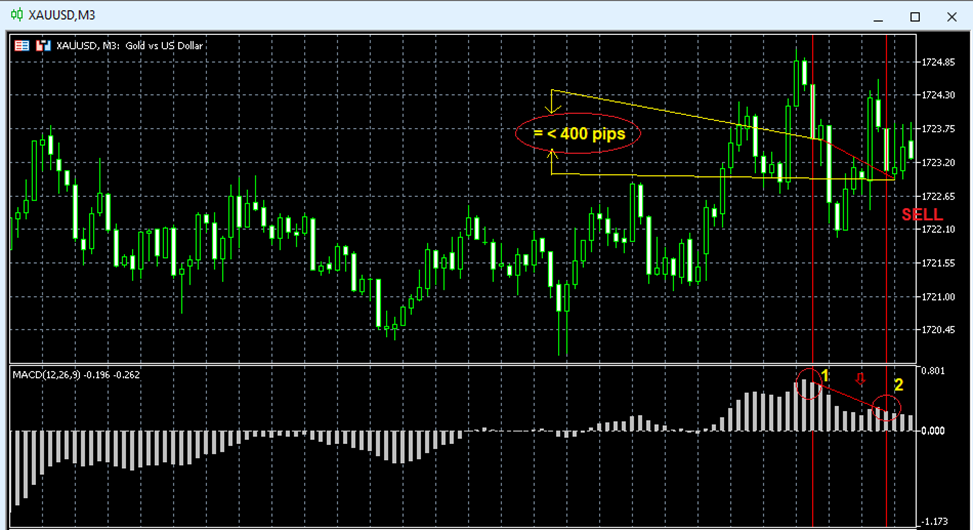
MACD bars goes + 0 and we have a bar which shortens from previous one towards 0 then is consider as signal 1 but do not execute. In the second time we execute but the price should be (= < 400 pips).
MACD bars goes above +0 limit and we have a bar which goes long from previous one above 0 then it shall be considered as signal 1 but it should not be executed. In the second consecutive time the signal occurs then it shall execute but the price should be (= < 400 pips). For example, as in the below screenshot, signal 2 must be closer to 0 limit of MACD in comparison to signal 1. Also, the price of the instrument shall not be higher than *400pips.
***The EA shall also contain a function where we can manually change the price set up of 400 pips.
Positions should be closed when the opposite signal appears and shall open on the opposite direction.
We do acknowledge that these strategies are three different ones and the one mixes with other, but we look into a combine strategy. These strategies do not overwrite the other but are combined at the moment which another strategy starts run.
IMPORTANT NOTICE
In general, the EA needs to have a parameter where we can add or reduce the number of transactions which can occur at the same time.
Other basic functions
Money management with fixed lots and % of balance and % of equity
Take profit – Stop loss
Trailing stop
All timeframe periods
Timeframe of activation of EA as an example to change anytime the timeframe periods
All symbols