Specifiche
Hello good Morning
I would like two indicators and dashboard
The first one would be a Multi Time Frame fractal indicator with some different specifications.
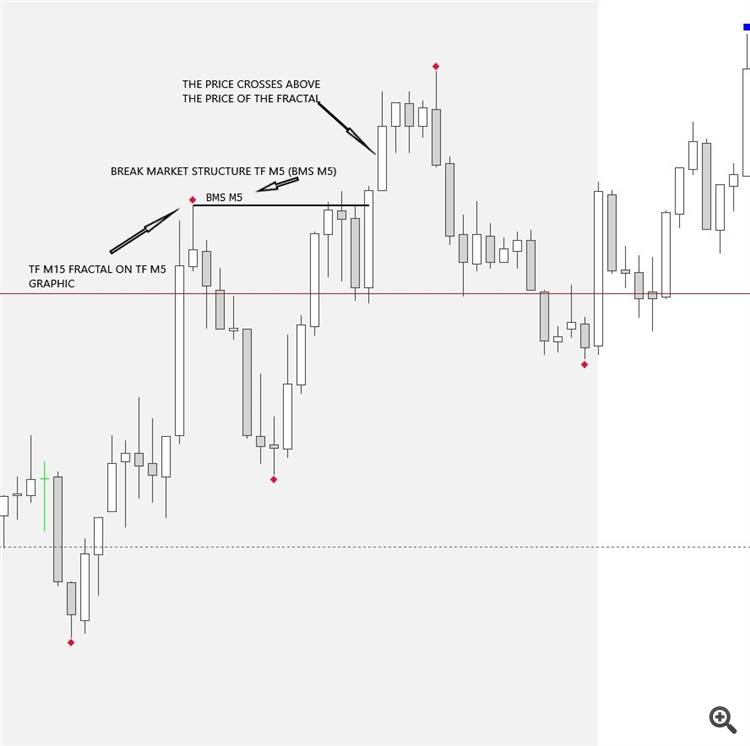
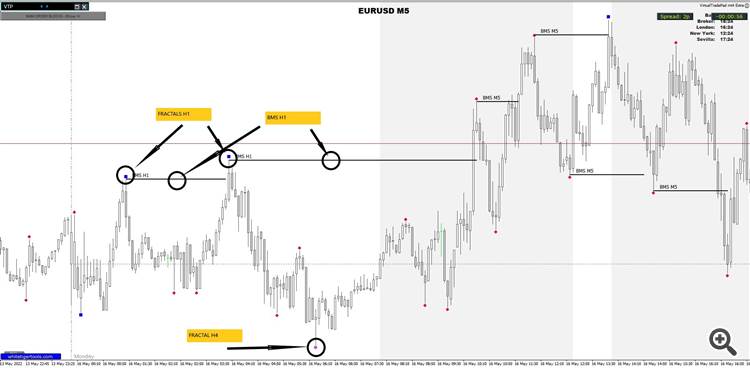
As can be seen in the M5 chart below, I use fractals belonging to the TF of 15min and above, H1, H4 with the aim of eliminating many fractals that would occur in M5, in this way I obtain movements with lower lows or higher highs. With much more cleanliness and with better signs
1º Once the price goes above or below the fractal position... I paint a price breakout line.
Ej.: ONCE THE PRICE CROSSES ABOVE OR BELOW THE PRICE OF THE FRACTAL, A LINE MUST BE PAINTED FROM THE HIGH OR LOW OF THE CANDLE TO THE CANDLE THAT CROSSES THE PRICE LEVEL AND PLACE A TEXT ABOVE THE LINE SPECIFYING THE BMS OF THE CORRESPONDING TIME FRAME
2º the fractal must coincide with the highest high or lowest low of the closest candle.
3rd Should be able to limit the number of fractals on the chart.
4th It should allow to change the color and the size of the fractal
5th As in the example below, the indicator should place the fractals of different TFs on a chart of a specific TF
To help in the possible development of the indicator, I sent you the address of the tool that I use, which is totally free, as well as its explanation in a YouTube video
https://www.whitetigertools.com/herramientas-metatrader-4
https://www.youtube.com/watch?v=zfIM9GX73hQ
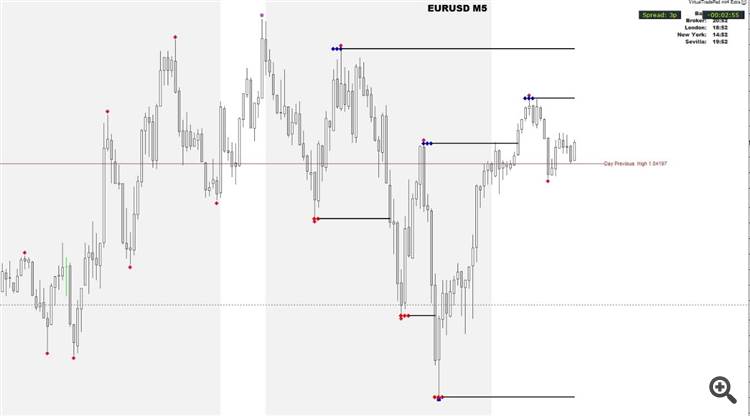
I also sent you the address of an indicator on the mql5 page, which has many of the concepts that I want for mine. This indicator practically has it all, it would only be necessary to place the name of the structure break above the line. I place an image as I have it on my graph. The dots above the fractals correspond to the fractal of the TF that we want to appear.
https://www.mql5.com/en/code/11145
we would only need to remove this detail and place the name at the top of the lines
SECOND INDICATOR
I need an Order Block indicator.
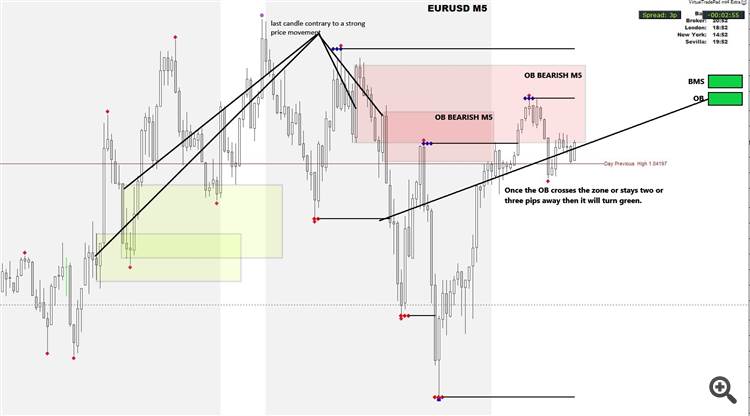
A Block of orders is defined as the last candle contrary to a strong price movement, it means that the orders of the large institutions have entered the market. And it happens on many occasions the price returns to this zone to continue the direction of the movement. strong.
I need an indicator that marks these areas for me, for the different TF.
Conditions for order blocks.
It is important to have the possibility of placing the name of the command block of the TF that we are working on.
Also, and it is very important that only those OBs that cross or are due 2 or 3 pips to cross the fractal and create a BMS appear drawn on the screen.
You should also have the possibility to change the color of the OB as well as to draw a line that marks the middle of the OB.
The order block should disappear once the price has visited the zone twice.
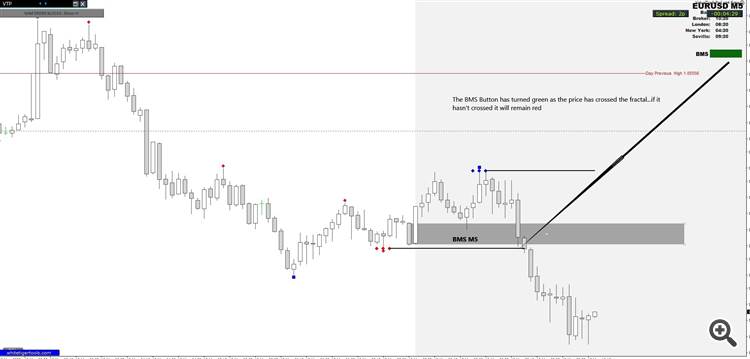
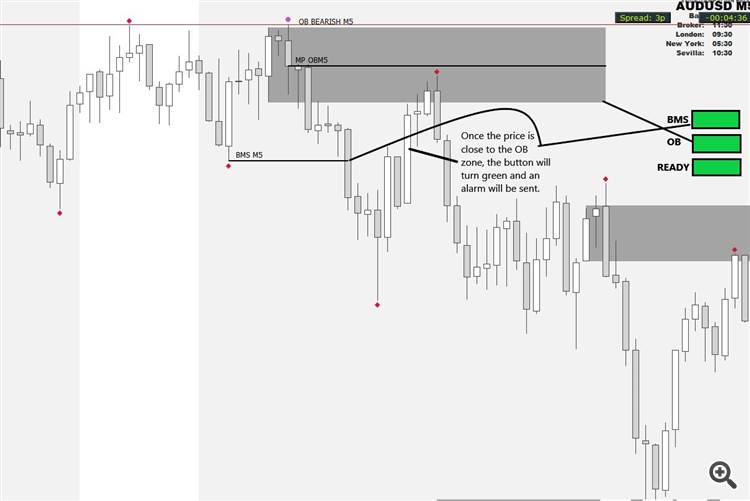
Once the OB is created, you must place an alarm that the OB has been created and it will turn green. Importantly, I do not need alarms to the mobile or email... only for the moment the color change.
It is important to keep in mind that the OB will disappear if the price exceeds the zone, so it will invalidate it and therefore it will turn red again.
Lastly, we will need a third button apart from the two previously created that will notify us when the price approaches the OB zone at X number of pips. then we will be prepared to continue the operation.
In this case and only in this case it will send an alarm signal to the mobile phone and to the platform and of course the button will be colored green
DASH BOARD
We need a dashboard in which I reflect the signals of the indicators that we have previously created for the different assets that we want to be placed in it.
In addition, the DB must enter the schedule or the work session. as well as the spread
I put an example

As we know the market is fractal, therefore the indications to create the previously explained indicators will occur in all the TFs, I mean we will have OB, BMS in all the TFs, only the fractals to be placed will change. Once we have this clear... we can make the table mentioned above with two TFs, one that tells you what happens in a higher time frame and the other in a lower time frame.
Of course, once this is created, the only thing missing is when the conditions of proximity to the ob are met. the panel sends us a signal of the corresponding asset to see what happens.
We should click on the asset and it will launch a graph with a previously created template
