Indicatore
"Jordan Correlation Inverse"
sfondo
L'indicatore mira a identificare due intervalli divergenti su due mercati correlati che sono collegati tra loro tramite l'indicatore OverlayChart.
Le due gamme devono avere direzioni opposte con la stessa dimensione in termini di Pip, con una percentuale di tolleranza da stabilire nell'indicatore (20-30%). Il range sarà definito in base al numero di candele chiuse previste dall'indicatore (indicativamente 10). Le due variabili le considero necessarie per stimare statisticamente in quali condizioni le operazioni siano più performanti.
Sempre a fini statistici sarebbe opportuno evidenziare l'entità del range in Pip.
Il segnale long / sell che l'indicatore fornirà, sarà costituito dalle ultime due candele che si sono formate sui due mercati con direzioni opposte.
Le ultime due candele possono formare 3 situazioni distinte sui due mercati correlati:
- 2 candele rialziste - 2 candele ribassiste;
- 1 candela alta e 1 candela bassa - 1 candela bassa e 1 candela alta;
- 1 candela giù e 1 candela su - 1 candela su e 1 candela giù;
Rappresentazione grafica
Quando l'indicatore identifica i due intervalli opposti, forma due rettangoli sui due grafici. La base è costituita dal minimo e dal massimo della gamma mentre i lati sono costituiti dalle ultime 10 candele chiuse, esclusa quella attuale. A destra è necessario aggiungere uno spazio maggiore per evitare che la barra laterale del rettangolo renda illeggibili il massimo e il minimo della candela in corso.
Ad ogni nuova candela chiusa il rettangolo si aggiorna in base ai nuovi livelli di prezzo.
Il rettangolo scompare se le dimensioni dei due rettangoli non sono le stesse inclusa la tolleranza.
Rettangolo in alto
Sopra il rettangolo formato sugli alti, sul lato sinistro, è necessario indicare: "Divergent Range" - il mercato relativo e l'altezza del range in Pip.
Es: Gamma divergente EURAUD - Pip 20,00
Il rettangolo sarà rosso (senza colorazione interna)
Rettangolo sui minimi
Sotto il rettangolo che si forma sui minimi, sul lato sinistro, si deve indicare: "Divergent Range" - il mercato correlato e l'altezza del range in Pip.
Ad esempio: Gamma divergente AUDCAD - Pip 23,00
Il rettangolo sarà colorato Lime (senza colorazione interna)
Allerta sulla formazione di rettangoli divergenti.
Suono con descrizione: Gamma divergente: EURAUD - AUDCAD
Solo sulla sua formazione.
Segnale lungo e breve
Solo dopo che si saranno formati i range divergenti, il segnale lungo e corto sarà formato dalla formazione delle due candele invertite consecutive sui due mercati (vedi sopra).
Avviso sulla formazione delle due candele inverse:
Suono con descrizione: Vendi su gamma divergente: EURAUD
Lunga gamma divergente: AUDCAD
Allegato:
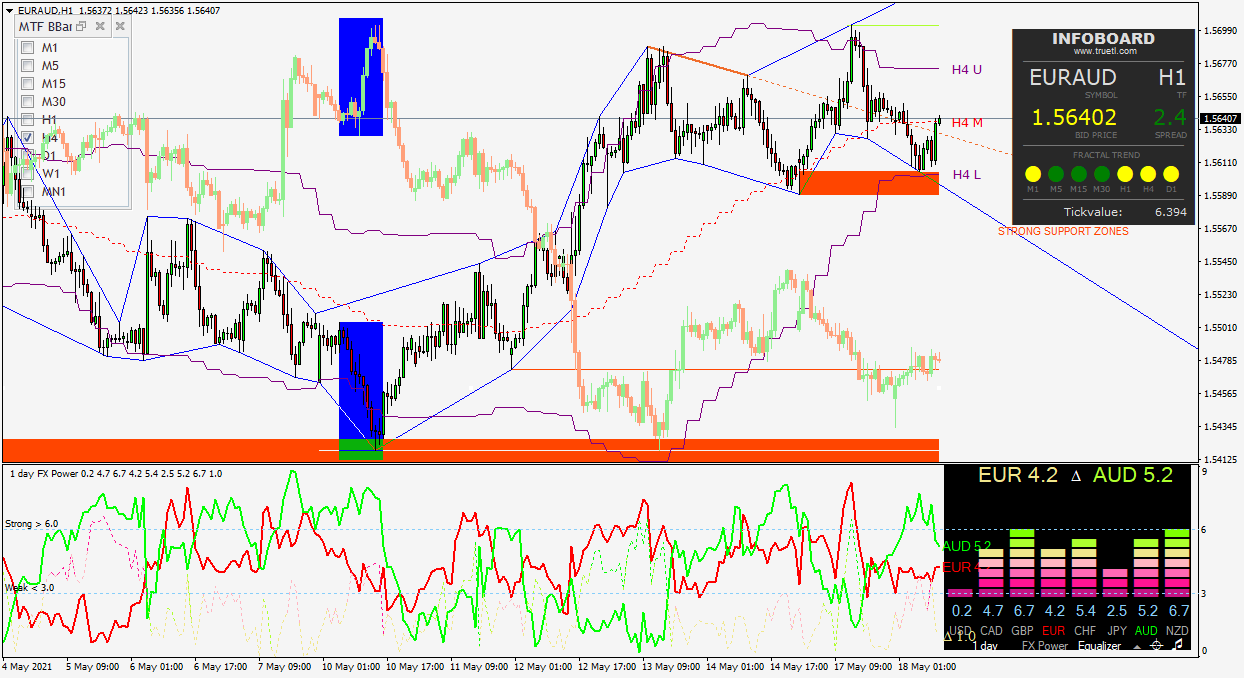
Grafico EURAUD con grafico correlato;
Indicatore OverLayCart.
Ordini simili
create a multi-timeframe (MTF) dashboard in MQL5 based on the provided Schaff Trend Cycle code, you can visualize different timeframes' trend data in a dashboard format. Should have an alert system ie. when the indicator aligns on multiple timeframes a notification is sent. Display a dashboard showing alignment across multiple timeframes (e.g., M1, M5, M15, M30, H1, H4, D1). Indicate when the signal aligns across all
Variable Inputs to be added Order Type : Market , Pending Trade Type : Buy, Sell , Buy & Sell Pending Pips Step : ( Pips Value can be negative or positive to decide on what type of Pending Order ) // If trade type Buy is selected Close Type : Close All ( Bulk Close Option in MT5 ) , Close Individually Close Option : %of Equity , %of Balance , Amount $ , %of No: of Trades Close Type : Buy Only , Sell Only , Buy & Sell
hello there I need a copy trade for mt4 can ANYONE help me with and let discuss on how to go about it kindly send me message to signify and let discuss mind you i need this urgently let connect to discuss and conclude
Below is the pine eidtor script convert it to MQL5 coding language and create bot based on following condition 1. This all should be on 5-minute chart timeframe 2. For Buy side, buy after closing of second candle when buy signal is given and hold buy position until sell signal is given. 3. For sell side, sell after closing of second candle when sell signal is given and hold sell position until next buy signal will be
I would like the better volume indicator 1.6 in a scanner format. Scanning multiple timeframe and pairs of which can be picked. Would like it to provide all standard notifications and also if pressed to go to the a template timeframe and pair. *To be placed in a table format as the one added. To be able to add which time frame you want to see. *To advise me of the following Climax High - turn the text green High
i have a JavaScript of a code which is a indicator of trading view, i want to convert into python script and make a mql5 automated trading bot which can take automatic trade and also exit when the signals come by the indicator
Here's the bot's trading strategy in a nutshell>>> I would like to make a simple scalping MT5 EA trading bot for the synthetic indices, specifically for the Boom 1000 Index. This MT5 EA trading bot will be based off of the 10 period moving average that follows specific rules for entry. The parameters of the moving average are as follows: Period:10 Shift:1 Method:Linear Weight Apply to:Close The bot will only initiate
I would like an existing, older MT4 EA I had developed converted into an MT5 EA and debugged where necessary. The EA is attached and should be fairly self-explanatory. It is a breakout order entry EA with customisable parameters
I require an MT4 Expert Advisor (EA) that automatically places hedge orders when a buy or sell order is placed by me or another EA. The hedge orders will consist of a stop order (either Buy Stop or Sell Stop), with the same lot size as the original order, deployed at a predefined price distance. The EA must ensure that only one hedge order is placed for each trade. The system should monitor trades based on specific
I want a Renko EA similar to the one I have, because I want the source code. The Renko EA will have the mode presets described, the Renko EA will be live, it will be for MT5, it will be saved under Expert Advisors. Please see the attached file for specifications. Please let me know if you have any questions