Guarda come ordinare un robot di trading
Leggi le Regole prima di pubblicare un ordine o di eseguirlo.
Come Ordinare un Robot di Trading in MQL5 e MQL4
Visualizza un esempio di Specifiche dei requisiti necessarie per ordinare un robot
Nuovi ordini nella categoria:
100+ USD
50 - 100 USD
30 - 50 USD
30 - 50 USD
30 - 50 USD
Lavoro terminato
Tempo di esecuzione 8 giorni
Feedback del cliente
Thank you for your patience and hard work
Feedback del dipendente
Attentive and friendly customer. Thank you for the interesting project.
Specifiche
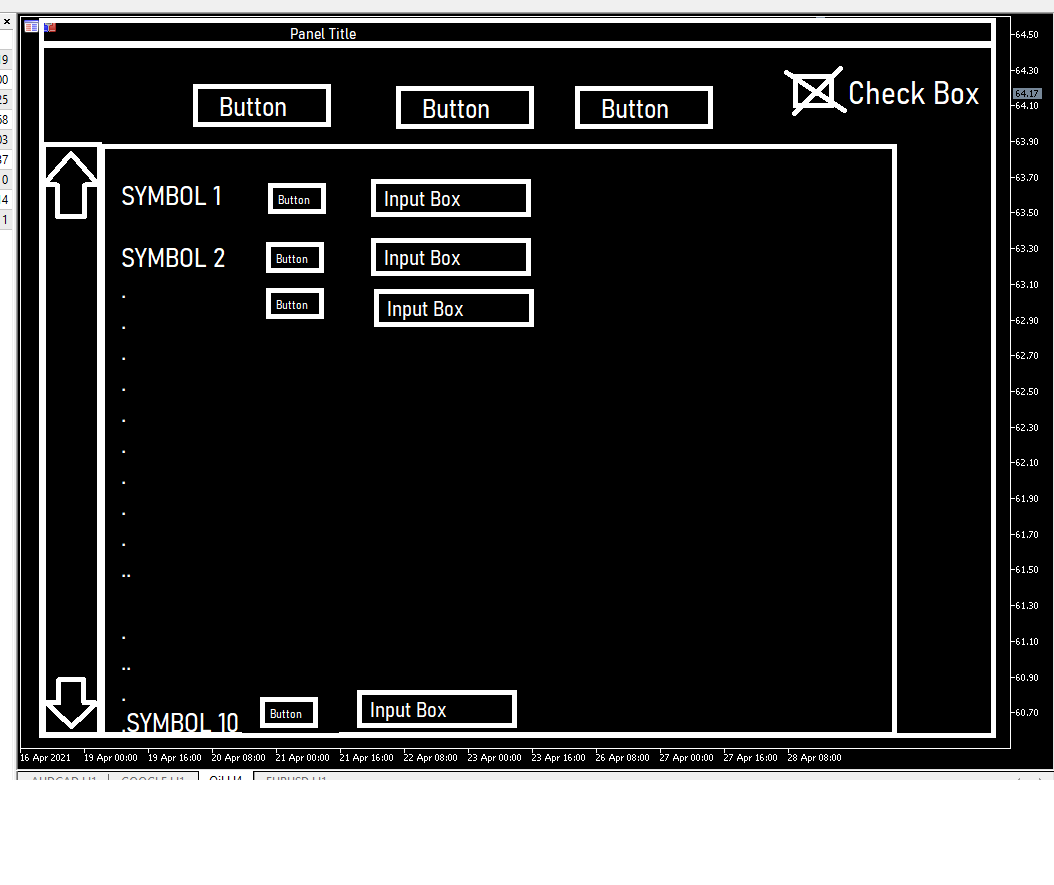
Hi everyone
I am working on a personal project and I need the following
A graphical item(canvas,panel, dialogue etc.) that will future the following
1) Make it fit the screen
2) The panel has to be able to adjust automatically to fit any screensize and display items accordingly without messing up
3) Buttons (I will add functionality to them)
4) Check boxes
5) Input text boxes
6) Sample text
7) It has to be scrollable as I will have it print all the symbols in the market watch and they won't fit in the screen
for 2-6) please create functions that take inputs ( eg x and y locations, size, display(true/false) ,color) as I would like to be able to use it myself
This if for mt5 .
Thank you
Con risposta
1
Valutazioni
Progetti
12
25%
Arbitraggio
1
0%
/
100%
In ritardo
0
Gratuito
2
Valutazioni
Progetti
84
26%
Arbitraggio
23
22%
/
48%
In ritardo
23
27%
Gratuito
3
Valutazioni
Progetti
130
49%
Arbitraggio
5
80%
/
0%
In ritardo
6
5%
Gratuito
4
Valutazioni
Progetti
352
71%
Arbitraggio
4
100%
/
0%
In ritardo
1
0%
In elaborazione
Ordini simili
Greetings, As the title suggests, I am trying to convert an indicator that calls itself via an iCustom call like this. iMAArray_Buffer[loop_1] = iCustom ( NULL , Selected_TF, MQLInfoString ( MQL_PROGRAM_NAME ), "calculate" , RPeriod, MType, MPeriod, 1 , shift); Full code will not be provided, only the position that needs fixing. I cannot get this working in MQL5 but the original code runs smoothly in MQL4. Please
I need a chart to replicate/track my equity + Balance Curve into my mt4. Also this chart i need to be able to add Stochastic / Bollingerband / Moving average on the equity/balance curve. Besides the equity curve i would like the indicator to show the Line-chart of my win + 1 and my loss -1 which results in a win-loss curve. ( i will discuss this with the choosen developer in depth. ) More information on what i want
Greetings great developer, I am in search of a highly skilled developer to assist with an exciting project. I need to convert two open-source TradingView indicators to NinjaTrader 8 and implement a usage restriction based on computer IDs. If you have experience with NinjaTrader 8 coding please let me know. I’d be happy to discuss the details further
Hello, This is pretty simple and its an indicator with On/Off button 1-Off will remove all indicator from the chart. 2-On will put them all back again with the same settings
Trading bot
300+ USD
We need bot that trades when medium and low impact news hits It will release pending order both directions few min prior to news impact And will have certain risk management strategy attached Example If Monday and Tuesday news successful clears profits It will reduce risk for next news events until new week starts each week message on tg: Dstatewealthtrading NOTE: 4 YAERS OF EXPERIENCE UPWORD, YOU MUST BE A
Supertrend + Heikin ashi indicator for mt5
35 - 45 USD
I need someone the create a supertrend indicator based on Heikin Ashi candles instead of normal candles. Needs to be exactly the same as the supertrend (original one) + ha from tradingview. In m1,m5,m15 the indicator must have the same values found with the tradingview. Work that meets this requirement will be accepted ( depending on the broker and spread, however, a few pips of difference will be accepted)
Here is a detailed instruction for the coder to implement the vertical lines based on the BrainTrainSignalAlert indicator: --- **Task: Implement Vertical Lines for Alerts from BrainTrainSignalAlert Indicator** **Objective:** Create a system that adds vertical lines on specified timeframes (M5 or M30) whenever an alert is generated by the BrainTrainSignalAlert indicator on the H1, H4, and D1 timeframes. The lines
Fixing MT4 Indicator
40+ USD
Hello Guys! I want to modify/fix the indicator that uses sequential type of entries (it calculates from 1 to 9) and if the conditions are met it provides an arrow (signal) with alert. The problem is that, sometimes (for unknown for me reasons) it repaints arrow signal. Like on the picture: Signal 1 - correct signal Signal 2 - correct signal Signal 3 - correct signal Signal 4 - repaints (signal 3 arrow dissapeared
Hi, I have a Live Data feature for my trading accounts that lets me check details like total open positions, number of lots, profits, etc. I need someone to add the number of pending orders to this live data. This is important for me to ensure that all accounts have the same number of pending orders, since I use a copy trading system. Also, there is a website where I check all the data. In this case, you would need
I came across an indicator that's perfectly good in catching spikes in boom amd crash but i would want it to be modified and to improve accuracy As a professional you will have to go through the indicator and explain to me the strategy with which the indicator was buid and tell me the possibility of improving it better
Informazioni sul progetto
Budget
30 - 100 USD
IVA (19%):
5.7
- 19
USD
Totale:
35.7
- 119
USD
Per lo sviluppatore
27
- 90
USD