Unisciti alla nostra fan page
- Visualizzazioni:
- 35030
- Valutazioni:
- Pubblicato:
- Aggiornato:
-
Hai bisogno di un robot o indicatore basato su questo codice? Ordinalo su Freelance Vai a Freelance
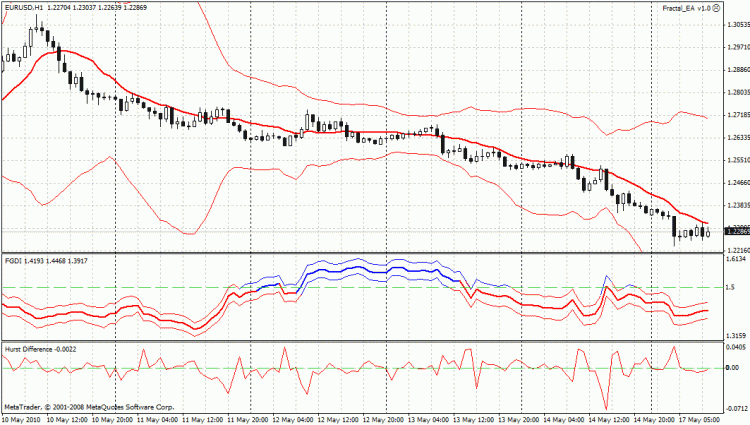
This indicator is based on the assumption that the price variations follow a multi-fractal model. From there, the Hurst exponent H can be easily computed from the fractal dimension (as obtained in http://codebase.mql4.com/en/code/8844). The variations of this Hurst exponent can actually be seen as predicting the variations of the volatility, and they therefore provide a time for entering into a trade (whenever this variation is positive), in order to profit from the high volatility period.
It must be noticed however, that this indicator doesn't give any information as to the direction of the trade, for that a directional indicator must be used.
For more details about this indicator, please see my blog: http://fractalfinance.blogspot.com/2010/05/variation-of-hurst-exponent.html
Here is how it looks like, in the lower window, on a 1hr EUR/USD chart:
 Script opening orders
Script opening orders with specified Magic Number
 Wavy Dash Indicator
Indicator draw green and red lines similar to wavy dash. Green is a buy signal, red is a sell signal.
 HAS EA NEW
Based on the HAS indicator.
 Avg_02b
Calculating the difference between the High and Low price to see the price range for every hour.
