Unisciti alla nostra fan page
- Visualizzazioni:
- 8202
- Valutazioni:
- Pubblicato:
- 2008.11.24 09:07
- Aggiornato:
- 2014.04.21 14:53
-
 Ti stai perdendo delle opportunità di trading:
- App di trading gratuite
- Oltre 8.000 segnali per il copy trading
- Notizie economiche per esplorare i mercati finanziari
Registrazione AccediAccetti la politica del sito e le condizioni d’uso
Se non hai un account, registrati -
 Hai bisogno di un robot o indicatore basato su questo codice? Ordinalo su Freelance
Vai a Freelance
Hai bisogno di un robot o indicatore basato su questo codice? Ordinalo su Freelance
Vai a Freelance
The script displays the ratio between the sum at the end of the period and the current sum, i.e. how many times it is increased/decreased.
The properties window will appear as soon as you launch it:
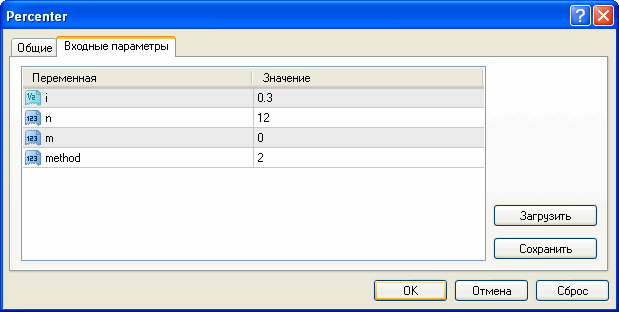
In this example we specify: i=0.3 (i.e. 30%), n=12 (the number of periods of charging), method=2 - on default, and we don't specify anything in the m field (it is used only when calculating the nominal interest rates).
The result:
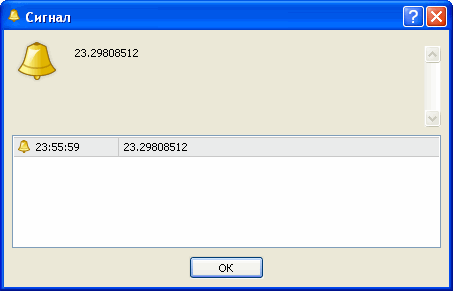
I.e. if the interest rate is equal to 30% a month and charging is performed by the complex interset rate, then the deposit will be increased more than 23 times after a year.
You can read the additional information about the rates here: https://en.wikipedia.org/wiki/Interest_rate.
Tradotto dal russo da MetaQuotes Ltd.
Codice originale https://www.mql5.com/ru/code/8554
 Standard OsMA indicator
Standard OsMA indicator with the indication of the possible trade signals.
 ind_HotKeys_v1
An example of automatic running of the script when the timeframe or symbol is changed.
MultiZigZag - Another Variant of ZigZag (Economic ZigZag)
This version of ZigZag can simultaneously display three zigzags both drawn on the data from the current timeframe and on the data from the larger timeframes.
Indicators Based on the MUV Described by Sator
The MUV indicator created by Sator is used.