Guarda come scaricare robot di trading gratuitamente
Ci trovi su Twitter!
Unisciti alla nostra fan page
Unisciti alla nostra fan page
Ti è piaciuto lo script? Provalo nel Terminale MetaTrader 5

- Visualizzazioni:
- 14619
- Valutazioni:
- Pubblicato:
- 2008.08.13 07:52
- Aggiornato:
- 2016.03.29 14:11
-
 Ti stai perdendo delle opportunità di trading:
- App di trading gratuite
- Oltre 8.000 segnali per il copy trading
- Notizie economiche per esplorare i mercati finanziari
Registrazione AccediAccetti la politica del sito e le condizioni d’uso
Se non hai un account, registrati -
 Hai bisogno di un robot o indicatore basato su questo codice? Ordinalo su Freelance
Vai a Freelance
Hai bisogno di un robot o indicatore basato su questo codice? Ordinalo su Freelance
Vai a Freelance
The EA is composed on the combination of the RSI and Stochastic, one of its best working is shown on the chart. However, it doesn't always work this way, and for some reason it stops later on.
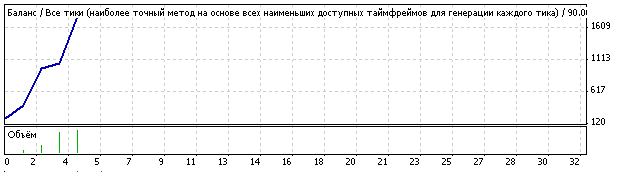
Strategy Tester Report
New_v6
Alpari-Demo (Build 217)
| Symbol | EURUSD (Euro vs US Dollar) | ||||
| Period | 30 Minutes (M30) 2008.07.01 00:00 - 2008.08.07 23:30 (2008.07.01 - 2008.08.08) | ||||
| Model | Every tick (the most precise method based on all available least timeframes) | ||||
| Parameters | Lots=1; MaximumRisk=0.8; DecreaseFactor=3; PeriodRSI=6; | ||||
| Bars in test |
2335 | Ticks modelled |
250834 | Modelling quality |
90.00% |
| Missmatched charts errors | 92 | ||||
| Initial deposit |
200.00 | ||||
| Total net profit |
1591.38 | Gross profit |
1591.38 | Gross lost |
0.00 |
| Profit factor |
Expected payoff |
397.84 | |||
| Absolute drawdown |
43.20 | Maximal drawdown |
535.50 (35.19%) | Relative drawdown |
43.52% (134.40) |
| Total trades |
4 | Short positions (% won) | 2 (100.00%) | Long positions (% won) | 2 (100.00%) |
| Profit trades (% of total) | 4 (100.00%) | Loss trades (% of total) | 0 (0.00%) | ||
| Largest | profit trade | 728.45 | loss trade | 0.00 | |
| Average | profit trade | 397.84 | loss trade | 0.00 | |
| Maximum | consecutive wins (profit in money) | 4 (1591.38) | consecutive losses (loss in money) | 0 (0.00) | |
| Maximum | consecutive profit (count of wins) | 1591.38 (4) | consecutive loss (count of losses) | 0.00 (0) | |
| Average | consecutive wins | 4 | consecutive losses | 0 | |
| № | Time | Type | Order | Volume | Price | S / L | T / P | Profit | Balance |
| 1 | 2008.07.01 01:00 | buy | 1 | 0.16 | 1.5750 | 0.0000 | 0.0000 | ||
| 2 | 2008.07.02 22:00 | close | 1 | 0.16 | 1.5878 | 0.0000 | 0.0000 | 205.26 | 405.26 |
| 3 | 2008.07.03 01:00 | sell | 2 | 0.32 | 1.5876 | 0.0000 | 0.0000 | ||
| 4 | 2008.07.03 22:30 | close | 2 | 0.32 | 1.5698 | 0.0000 | 0.0000 | 569.60 | 974.86 |
| 5 | 2008.07.03 23:00 | buy | 3 | 0.78 | 1.5706 | 0.0000 | 0.0000 | ||
| 6 | 2008.07.04 10:00 | close | 3 | 0.78 | 1.5717 | 0.0000 | 0.0000 | 88.06 | 1062.93 |
| 7 | 2008.07.04 10:30 | sell | 4 | 0.85 | 1.5711 | 0.0000 | 0.0000 | ||
| 8 | 2008.07.07 10:00 | close | 4 | 0.85 | 1.5624 | 0.0000 | 0.0000 | 728.45 | 1791.38 |
Tradotto dal russo da MetaQuotes Ltd.
Codice originale https://www.mql5.com/ru/code/8311
 DSS Bressert - double smoothed stochastic (Double Smoothed Stochastic Indicator by Walter Bressert)
Indicator of overbuying/overselling
MA_Gideon2
Indicator MA_Gideon2.
 SymbolList
The script swaps out all the symbols available in the Market Watch window into a csv file.
SymbolList fromSet
The script extracts the list of symbols from the *.set file and saves it as the csv file.