Unisciti alla nostra fan page

BROTHER - By Rainbow On Trend High Extreme Results - EA 5 minute manual system - sistema esperto per MetaTrader 4
- Visualizzazioni:
- 68457
- Valutazioni:
- Pubblicato:
- 2008.07.31 08:02
- Aggiornato:
- 2016.11.22 07:32
-
Hai bisogno di un robot o indicatore basato su questo codice? Ordinalo su Freelance Vai a Freelance
Author:
Urban Sotensek
A note from the author:
I have been a Forex trader for many years. I still trade sometimes but that happens less frequently now because I grow more and more bored waiting for a reliable signal. The main reason for writing this article is that I do not like to sit at my computer all day. So, my experience may prove useful. First, I sold my system for three hundred dollars. However, success in Forex is a relative matter, and now I decided to distribute my system for free. Making profit in Forex mostly depends on a trader (70%) and, to a lesser degree, on his/her system (30%). Therefore, I guess, it is not too fair to sell my system, even if it has a high degree of probability. Your achievements on Forex are largely based on your personality and emotions. You may lose even with the best system in the world. The system was developed over six months. It is a product of a thorough market analysis and requires no improvements or changes. Do not try to change any indicators or parameters! Use it on a demo account for at least two months to get acquainted with all indicators and the entire system. Finally, please note that I am not responsible for any financial losses or gains the information will bring you. You are entirely responsible for everything that happens with your money!
Time scale: 5 minutes
Trading time: From the beginning of the European to the end of the American session
Recommended currency pairs: USD/JPY, USD/CHF, GBP/USD, EUR/USD, USD/CAD, AUD/USD, EUR/JPY, and Gold
Trend Follower© - Harness the markets by correct timing and adherence to the rules
This is not a "get rich quick" system. You should apply some real efforts to master it. Therefore, trade on a demo account first. Forex trading involves a high potential profit, but also includes a high potential risk. You should be aware of the risks and accept them consciously to place well-informed orders. I strongly advise you not to risk the money you cannot afford to lose.
Introduction
Like its name suggests, Trend Follower is a trend-following system. As you know, "trend is your friend". This system will show you what stands behind this saying. Its unqiue approach provides you with good understanding of market movements allowing you to see the price movement structure. Following the system rules, you will get a clearer picture of the market.
The system does not try to predict future. Instead, it defines the current trend and allows you to move with the crowd. While mastering the system, you will expand your horizons because you will need to keep abreast of developments in the economy and try to clarify the values of parameters or experts' opinions. Unlike most other trend-following systems, Trend Follower does not depend on the past performance and works in any market. Its equations are not based on pattern recognition and random selection of indicators, but rather on understanding the market and good timing.
Many commercial and free systems consist only of indicators and do not provide clear description of a price movement. They simply display a signal without any explanations. If you do not know exactly what you are doing and why you are doing this, your profits will not be consistent. Trend Follower clearly defines entries and exits providing a trader with the ability to explain the reasons for a deal!
System components
First, let's briefly describe all the indicators.
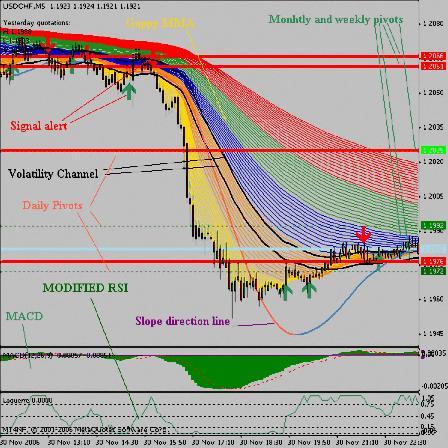
Indicators:
a) Signal arrows
b) MACD
c) Volatility Channel
d) Laguerre
e) Slope Direction line
f) Pivot points
g) Guppy Multiple Moving Averages (GMMA)
Signal arrows
The signal is generated at the crossing of two exponential moving averages. Fast EMA is 4, slow EMA is 8.
MACD histogram
The default values are used (the system uses 5,35,5):
* Slow average - 26 days
* Fast average - 12 days
* Signal line - 9 day average from the difference between the slow and the fast one.
* All averages are exponential.
MACD signals usually lag behind the price. MACD Histogram tries to avoid this issue by measuring the distance between MACD and its signal line. Due to this, the signals change before the normal MACD signal. However, the histogram should not be used isolated, therefore we use other indicators for confirmation.
Volatility Channel
This technique measures volatility. It consists of 34 EMAs built by Highs and 34 EMAs built by Lows. it is not a part of the system, but I like this indicator, especially when looking for a confirmation on a larger time scale.
Laguerre
This is an advanced version of RSI. Laguerre converts the signals, so that low-frequency components lag much more that the high-frequency ones. In general, the last bar data has more weight than the previous data, just like the exponential moving average.
Slope Direction Line
The name speaks for itself. The line measures the slope of the trend and its direction. The direction is shown in red for a downtrend and in blue for an uptrend.
Pivot points
Traders use pivot points to find intraday support/resistance levels. The pivot points are defined by a simple calculation that includes Open, High, Low, and Close of the previous day of any particular asset or index. The price breaking a reference support/resistance line upwards means a buy signal (and vice versa for a sell one). If the prices are above the central reference line, the market is bullish. If the prices are below the line, the market is bearish. The most common way of using the reference levels is applying them as checkpoints for entering the market, if your other favorite indicators confirm the signal. Market makers may use pivot points to get the price moving between the levels in order to lure buyers or sellers into performing deals. This can be easily seen during the low-volume days when prices fluctuate between the calculated points.
There are many methods of calculating pivot points and their support/resistance levels. The traditional one is as follows:
* Central pivot point Pivot= (H + L + C)/3
* First support = (2 * Pivot) – H
* First resistance = (2 * Pivot) – L
* Second support = Pivot – (H – L)
* Second resistance = Pivot + (H – L)
In our system, the pivot points are usually used to exit the market. All calculations are done automatically.
Guppy Multiple Moving Averages GMMA
Guppy MMA is a combination of moving averages optimized to make the picture more smooth and accurate and avoid sharp peaks drawn by MAs due to sudden market movements.
The most common issue of simple MA-based systems is that they become extremely inaccurate during flat markets. Besides, they do not provide clear indications of the existing trend's stage. Is it going on or coming to an end? Guppy MMA answers these questions and explains the reasons for entering the Market, so that you can improve your trading skills.
The importance of this indicator cannot be overstated! Its indications are very reliable. The original Guppy method was created by Darryl Guppy. It consists of 3,5,8,10,12, and 15 EMAs for short-term averages (traders) and 30,35,40,45,50, and 60 EMAs for long-term ones (investors).
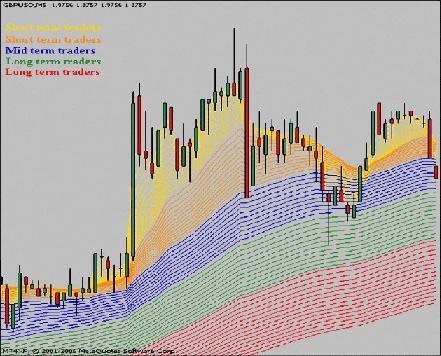
The time scale is of little importance here. In the Trend Follower system, we use the indicator on M5 charts, however it can be used on other scales – from M1 to MN. In our modified Guppy method, we use 5 colors for various types of traders. When you trade, you should know the main trend, which means that you should be aware of what other traders are doing.
1. Yellow - short-term traders (mainly catching quick pips, not interested in holding positions)
2. Orange - short-term traders (hold positions a bit longer than yellow ones)
3. Blue - medium-term traders (mainly swing traders, usually hold positions longer than the previous two groups)
4. Green - long-term traders (hold positions longer than the three previous groups)
5. Red - long-term traders or investors (hold positions longer than anyone else)
MMAs show relations between short-term traders and investors. Traders (yellow and orange ones) test the reliability of the main trend. Since they are looking for quick profits, they enter and exit the market rapidly. Investors (red and green ones) are not so fussy. However, their support is quite significant for a trend formation.
Since you follow a trend, you will look for situations when all traders come to a consensus about the market direction (yellow, orange, blue, green, and red moving averages). If all traders look in one direction, then we may speak about a trend. Any disagreement means that you do not trade. If you interpret MMA correctly, you can identify a trend, as well as detect its exhaustion and possible changes. In general, you trade better.
Breakouts
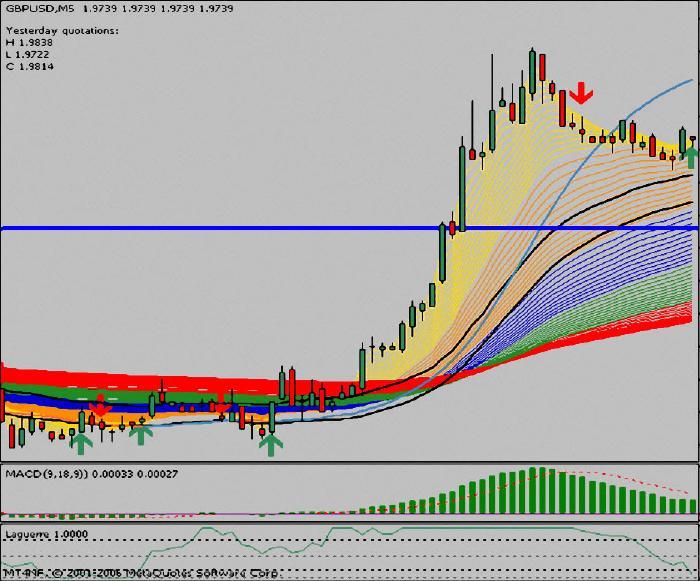
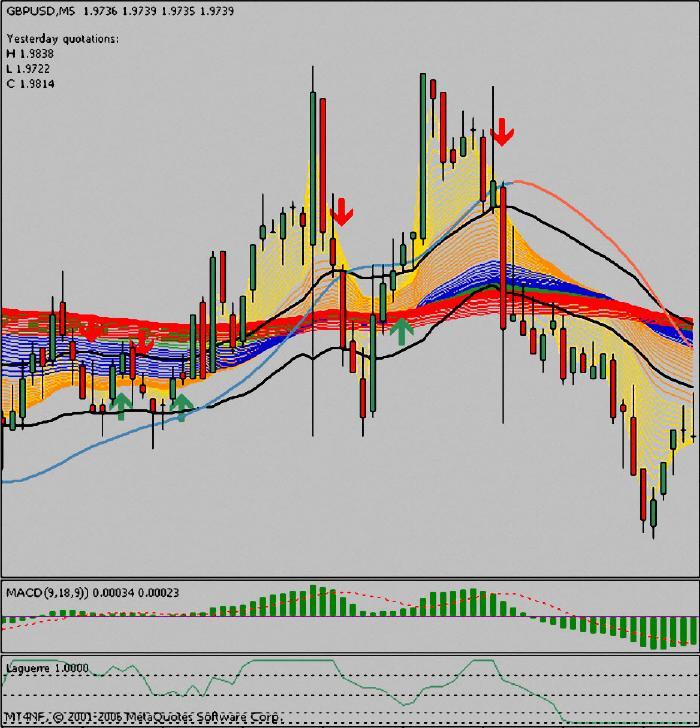
Even though we try to avoid breakouts, Guppy MMA can accurately show when they happen. As soon as a breakout occurred and yellow lines crossed the red ones, while green ones still remain below the red lines, we expect the yellow lines to return. This is the point where we can wait for the right moment to open new positions in the direction of a new trend. Please note that you do not open a deal during a breakout, but only after the price retraces, as indicated by changes in green and red lines' location.
Upward breakouts:
Red lines were above the green ones, when the yellow lines suddenly crossed the red ones upwards. Soon after its rise, the price retraced to other lines' level. The green lines are now below the red ones indicating an uptrend.
Downward breakouts:
The red lines were below the green ones indicating an uptrend. But then, the yellow lines crossed both the green and red ones. As soon as the green lines are below the red ones, we are witnessing the downtrend and may wait for signals.
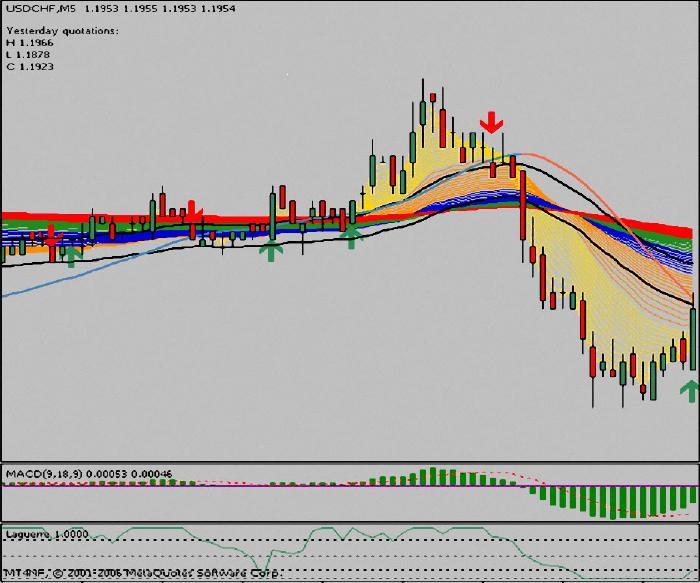
Be aware of the location of the GREEN and RED lines. For an uptrend, the green lines should be ABOVE the red ones, while for a downtrend, the green lines should be BELOW the red ones.
False breakouts
False breakouts can be easily identified with Guppy MMA. This is one of the many advantages of this indicator. False breakouts can hurt a trader both materially and emotionally.
If the yellow or orange lines cross the red ones, while the green lines retain the previous direction, a breakout is most probably false. If a trend is genuine, then all lines should re-locate (especially, green and red ones). You should be especially careful when working with volatile pairs, like GBP/USD.
Trend Follower rules
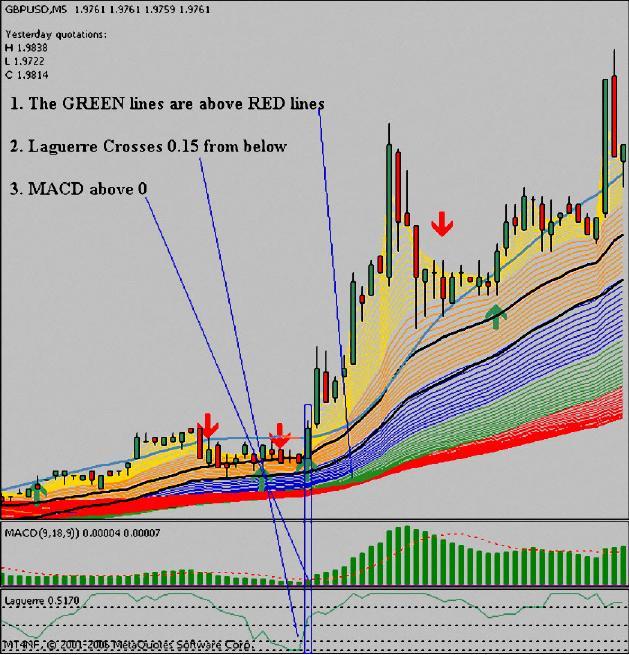
ALL criteria should coincide at a signal candle or the next one! Otherwise, do not enter the market! A market entry is performed at the next candle after a signal.
Up\Buy
ENTRY: Wait for a signal up arrow
GUPPY MMA: The green lines should be above the red ones! The green, red, and yellow lines should consistently point upwards. All lines should move in the same direction!
LAGUERRE: Laguerre line should cross the level 0.15 upwards
MACD: Important! MACD should be above 0 during a signal
STOP LOSS: 5 points (+spread!) below the current candle's LOW
ALTERNATIVE STOP LOSS: 20 points on default pairs and 25 points on more volatile pairs, like GBP and crosses. Choose a stop loss method that suits you best
EXIT (combined): A half of the position can be closed on the first reference point. Hold the remaining part till Slope Direction line turns red
ALTERNATIVE EXIT: Close positions on pivot points either when Slope Direction line turns red, or when the price (new candle) opens from the other side of the volatility channel
Down\Sell
ENTRY: Wait for a signal down arrow
GUPPY MMA: The green lines should be below the red ones! The green, red, and yellow lines should consistently point downwards. All lines should move in the same direction!
LAGUERRE: Laguerre line should cross the level 0.75 downwards
MACD: Important! MACD should be below 0 during a signal
STOP LOSS: 5 points (+spread!) below the current candle's HIGH
ALTERNATIVE STOP LOSS: 20 points on default pairs and 25 points on more volatile pairs, like GBP and crosses. Choose a stop loss method that suits you best
EXIT (combined): A half of the position can be closed on the first reference point. Hold the remaining part till Slope Direction line turns blue
ALTERNATIVE EXIT: Close positions on pivot points either when Slope Direction line turns blue, or when the price (new candle) opens from the other side of the volatility channel

Afterword
I hope, the product will prove useful..
 FIBO_S
Indicator FIBO_S.
 One Side Gaussian indicators, corrected and supplemented
One Side Gaussian indicators, corrected and supplemented