Unisciti alla nostra fan page
- Visualizzazioni:
- 6889
- Valutazioni:
- Pubblicato:
- 2012.02.06 16:30
- Aggiornato:
- 2023.03.29 13:44
-
Hai bisogno di un robot o indicatore basato su questo codice? Ordinalo su Freelance Vai a Freelance
This indicator is based on Fatl indicator values and analysis of its signal lines. The algorithm for calculation of the signal lines is following. The period of each signal line is calculated by arithmetic progression formula:
SignalPeriod(Number) = StartLength + Number * Step
The value of the Number variable vary from 0 to StepsTotal. The values of Fatl indicators with different periods used for calculation of average values of Fatl indicator. The calculation of current trend direction is based on the averaged trend values for all signal lines.
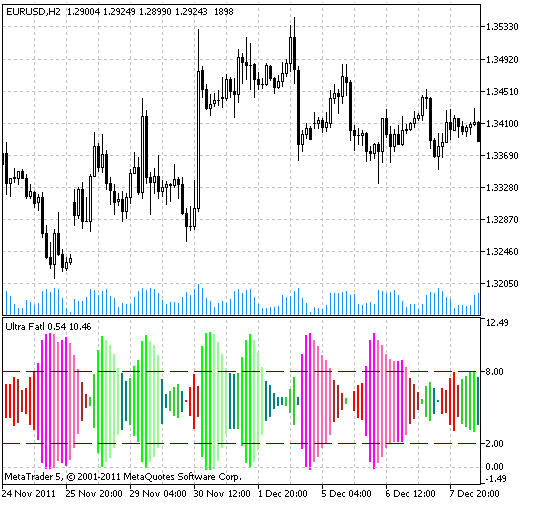
Finally, the positive and negative values of the trends are averaged and used as indicator lines, shown as a color histogram, plotted using the DRAW_COLOR_HISTOGRAM2 drawing style. Historgram color depends on trend direction, the histogram width depends on strength of the trend.
For each trend direction 4 colors are used in the histogram. For indicator values outside the overbought and oversold levels the dark colors are used. For the overbought/oversold values the light colors are used.
Indicator input parameters:
//+----------------------------------------------+
//| Indicator input parameters                   |
//+----------------------------------------------+
input ENUM_APPLIED_PRICE Applied_price=PRICE_CLOSE; // Applied price
//----
input Smooth_Method W_Method=MODE_JJMA;         // Smoothing method
input int StartLength=3;                        // Initial smoothing period
input int WPhase=100;                           // Phase
//----
input uint Step=5;                              // Step
input uint StepsTotal=10;                       // Total steps
//----
input Smooth_Method SmoothMethod=MODE_JJMA;     // Smoothing method
input int SmoothLength=3;                       // Smoothing length
input int SmoothPhase=100;                      // Phase
input Applied_price_ IPC=PRICE_CLOSE_;          // Applied price
//----
input uint UpLevel=80;                          // Overbought level (in %)
input uint DnLevel=20;                          // Oversold level (in %)
input color UpLevelsColor=Blue;                 // Color of overbought level
input color DnLevelsColor=Blue;                 // Color of oversold level
input STYLE Levelstyle=DASH_;                   // Level style
input WIDTH  LevelsWidth=Width_1;               // Level width
The indicator has a possibility to select the smoothing out of the dozen of possible versions:
- SMA - simple moving average;
- EMA - exponential moving average;
- SMMA - smoothed moving average;
- LWMA - linear weighted moving average;
- JJMA - JMA adaptive average;
- JurX - ultralinear smoothing;
- ParMA - parabolic smoothing;
- T3 - Tillson's multiple exponential smoothing;
- VIDYA - smoothing with the use of Tushar Chande's algorithm;
- AMA - smoothing with the use of Perry Kaufman's algorithm.
It should be noted that Phase1 and Phase2 parameters have completely different meaning for different smoothing algorithms. For JMA it is an external Phase variable changing from -100 to +100. For T3 it is a smoothing ratio multiplied by 100 for better visualization, for VIDYA it is a CMO oscillator period and for AMA it is a slow EMA period. In other algorithms these parameters do not affect smoothing. For AMA fast EMA period is a fixed value and is equal to 2 by default. The ratio of raising to the power is also equal to 2 for AMA.
The indicator uses SmoothAlgorithms.mqh library classes (must be copied to the terminal_data_folder\MQL5\Include). The use of the classes was thoroughly described in the article "Averaging Price Series for Intermediate Calculations Without Using Additional Buffers".

UltraFatl indicator
Tradotto dal russo da MetaQuotes Ltd.
Codice originale https://www.mql5.com/ru/code/788
 WKBIBS
WKBIBS is a next generation oscillator with combined WKB and IBS indicators functions.
 Sidus
Sidus
This indicator is based on the first version of Sidus trading method. It shows market entry points.
 DSS Bressert
The Double Smoothed Stochastics indicator was proposed by William Blau and Walter Bressert. The calculation of DSS values is similar to Stochastic indicator, the difference is the use of double exponentially smoothing.
 XR-squared
XR-Squared indicator uses linear regression to determine the presence or absence of a market trend.