Unisciti alla nostra fan page
- Pubblicati da::
- Nikolay Kositsin
- Visualizzazioni:
- 10435
- Valutazioni:
- Pubblicato:
- 2012.01.30 16:21
- Aggiornato:
- 2016.11.22 07:32
-
Hai bisogno di un robot o indicatore basato su questo codice? Ordinalo su Freelance Vai a Freelance
Real author:
GreenDog
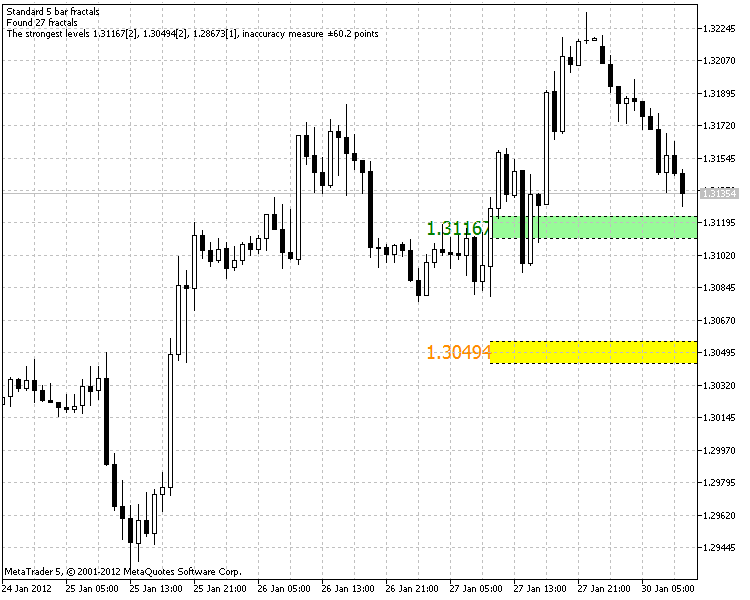
iGDR_Fractal_Levels indicator shows the fractals average values over a certain period of time. The indicator displays only three levels on the chart showing them in different colors. The same levels are plotted to the right from the text labels, though considering the variation used for calculation of an average value.
The indicator works as follows. The chart time interval from the end to the beginning is selected but a strictly limited number of bars specified in the indicator parameters is taken at the same time. Searching for fractals is carried out at this interval. Three price levels with the highest number of fractals are calculated afterwards and the price of each fractal is determined. Then the average price is found among determined ones. This average price is then displayed by the indicator, while a spread of prices of other fractals enlarges the line size, as this spread is the most powerful level.
Only three price levels are formed from all fractal ones by the indicator. Each of the three has its own color depending on the number of fractals included in building of this level. The strongest level is red, the middle one is yellow, while the weakest one is painted in green, though it also must be considered in trading activity.
Usage in trading:
As with all other levels in the Forex market, these levels have no specific differences, but we must always bear in mind that deals with the use of fractals are opened only in the direction of these fractals breakout. The same thing with the levels. We must enter the market in the direction of these levels breakout, as that is the strongest signal for market entry, while nearby levels can be used as initial stop levels and profit targets.

Tradotto dal russo da MetaQuotes Ltd.
Codice originale https://www.mql5.com/ru/code/729
 Waddah Attar Fibo
The indicator displays possible support and resistance lines as colored dots using Fibo levels.
 3XMA_Iсhimoku
The indicator that reminds of Ichimoku Kinko Hyo by its creation and usage principles.
 ZigZag_NK_MTF
ZigZag indicator version displaying results of its calculations from the larger timeframe at the current one.
 UtterFractals
This indicator shows the "inner market structure" close to the real one in contrast to the standard "fractals" and all sorts of zig zags.