Unisciti alla nostra fan page
- Visualizzazioni:
- 3167
- Valutazioni:
- Pubblicato:
- 2024.09.20 17:59
-
Hai bisogno di un robot o indicatore basato su questo codice? Ordinalo su Freelance Vai a Freelance
Have you ever needed to copy and paste some graphical objects between open charts? I think you have. Surprisingly, MetaTrader does not provide "Copy & Paste" feature for objects. The only thing that allows you to achieve more or less similar effect is templates (tpl-files). But the template stores the full chart state, including indicators, settings and a lot of auxiliary stuff, that may be irrelevant and unnecessary for required replication procedure.
That's why I developed this indicator ChartObjectsCopyPaste.mq5. It copies selected objects to the clipboard, from where they can be pasted onto other chart(s). No strings attached.
The indicator is based on another indicator published in the algotrading book - ObjectGroupEdit.mq5.
Please follow the link to find out more about all the underlying classes (ObjectMonitor, MapArray and others) working behind the scenes.
This indicator has no buffers. It should be attached at least to 2 charts: source chart from which you want to copy objects, and target chart where you plan to paste them.
While running on a chart, indicator tracks existing graphical objects and makes notes about which ones are selected.
As usual "Copy & Paste" commands work in pair:
- Press Ctrl+Q hotkey to copy all selected objects into Windows clipboard as a text (you can save and view it in any text editor, you can find an example below).
- On a target chart press Ctrl+J to paste all objects from the clipboard.
Why Ctrl+Q/Ctrl+J? These are just 2 vacant key combinations voluntarily chosen from very few. This is because MetaTrader intercepts and does not propagate many hotkeys to MQL-programs. Particularly this is so for the standard Ctrl+C/Ctrl+V/Ctrl+Ins/Shift+Ins, which are not working in this context.
As the source code is available, you can change the hotkeys to other combinations.
Since the indicator uses system DLLs to access Windows clipboard, you should allow DLL imports in the Properties dialog, on the Dependencies tab.
Due to the fact that the Codebase does not allow DLL imports, the related to clipboard code is wrapped into conditional preprocessor directive #ifdef DLL_LINK, so please uncomment the line
#define DLL_LINK
before compilation. Otherwise, you'll see how clipboard function stubs will show you alerts in responce to pressing hotkeys, and no actual actions will be performed!
- MakeAllSelectable - flag to make all objects selectable (which is normally false for those objects created programmatically);
- LogDetails - flag to output all properties of transferred objects to the log;
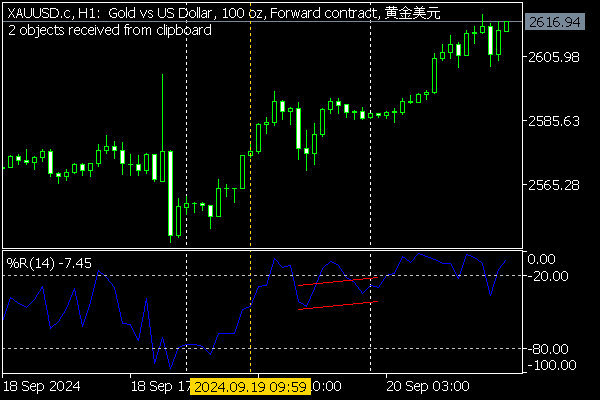
Here is an example of clipboard text with 2 objects:
OBJ_VLINE       H1 Vertical Line 5578   0       0
enum ENUM_OBJECT_PROPERTY_INTEGER
0       OBJPROP_COLOR   55295
1       OBJPROP_STYLE   2
2       OBJPROP_WIDTH   1
3       OBJPROP_BACK    0
4       OBJPROP_SELECTED        1
7       OBJPROP_TYPE    0
8       OBJPROP_TIME    1726739940
10      OBJPROP_SELECTABLE      1
11      OBJPROP_CREATETIME      1726847009
12      OBJPROP_TIMEFRAMES      2097151
200     OBJPROP_LEVELS  0
207     OBJPROP_ZORDER  0
208     OBJPROP_HIDDEN  0
1032    OBJPROP_RAY     1
enum ENUM_OBJECT_PROPERTY_DOUBLE
9       OBJPROP_PRICE   1.11449
enum ENUM_OBJECT_PROPERTY_STRING
5       OBJPROP_NAME    H1 Vertical Line 5578
6       OBJPROP_TEXT
206     OBJPROP_TOOLTIP
OBJ_CHANNEL     H1 Equidistant Channel 40885    5       1
enum ENUM_OBJECT_PROPERTY_INTEGER
0       OBJPROP_COLOR   255
1       OBJPROP_STYLE   0
2       OBJPROP_WIDTH   1
3       OBJPROP_BACK    0
4       OBJPROP_SELECTED        1
7       OBJPROP_TYPE    5
8       OBJPROP_TIME    1726758000
8       OBJPROP_TIME.1  1726797600
8       OBJPROP_TIME.2  1726758000
10      OBJPROP_SELECTABLE      1
11      OBJPROP_CREATETIME      1726847883
12      OBJPROP_TIMEFRAMES      2097151
200     OBJPROP_LEVELS  0
207     OBJPROP_ZORDER  0
208     OBJPROP_HIDDEN  0
1003    OBJPROP_RAY_LEFT        0
1004    OBJPROP_RAY_RIGHT       0
1031    OBJPROP_FILL    0
enum ENUM_OBJECT_PROPERTY_DOUBLE
9       OBJPROP_PRICE   -28.113879003558715
9       OBJPROP_PRICE.1 -21.708185053380777
9       OBJPROP_PRICE.2 -48.04270462633452
enum ENUM_OBJECT_PROPERTY_STRING
5       OBJPROP_NAME    H1 Equidistant Channel 40885
6       OBJPROP_TEXT
206     OBJPROP_TOOLTIP
And here are these objects pasted on the chart:

 Code To Check And Delete Chart Objects For MT5
- The script scans through the current chart for any available chart objects, - Counts and delete them accordingly - And log the the names of the objects on the chart respectively.
 PTB
PTB
Indicator Description: PTB.mq5 Overview: The PTB.mq5 indicator for MetaTrader 5 calculates short-term and long-term high and low prices, along with Fibonacci retracement levels based on these extremes. Features: Short-Term High and Low: Identifies immediate support and resistance over a user-defined short length. Long-Term High and Low: Analyzes broader market trends over a longer period. Fibonacci Levels: Plots key retracement levels (23.6%, 38.2%, 50%, 61.8%, 78.6%) for potential reversal points. Input Parameters: shortLength: Number of candles for short-term calculation. longLength: Number of candles for long-term calculation. Visual Representation: Distinct colors and widths for each line to differentiate between high/low and Fibonacci levels. Usage: Helps traders identify entry/exit points and monitor market trends based on historical price levels.
