Unisciti alla nostra fan page
- Visualizzazioni:
- 855
- Valutazioni:
- Pubblicato:
- 2021.12.04 15:02
-
Hai bisogno di un robot o indicatore basato su questo codice? Ordinalo su Freelance Vai a Freelance
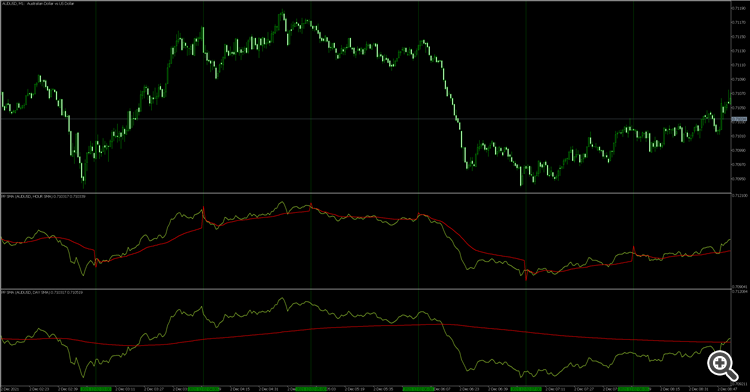
Per calcolare il prezzo medio è possibile specificare i periodi H1 e D1. Ad esempio, il prezzo medio D1 consente di monitorare se il prezzo di un determinato strumento finanziario è superiore o inferiore al prezzo medio. Lo stesso vale per H1, che indica un'inversione di tendenza dei prezzi molto più rapida.
L'indicatore ha solo tre parametri di input calcolati:
input string               _symbolName    ="0";             // Symbol, 0 = take a symbol from the chart
input ENUM_USE_SMA         _useSMA        =DAY_SMA;         // Use moving average
input ENUM_APPLIED_PRICE   _appliedPrice  =PRICE_WEIGHTED;  // Price
- Simbolo per i calcoli;
- Il periodo di tempo per il quale viene calcolato il prezzo medio;
- Prezzo applicato.
Si consiglia di utilizzare da M1 a M30, M1 è la scala temporale più informativa.
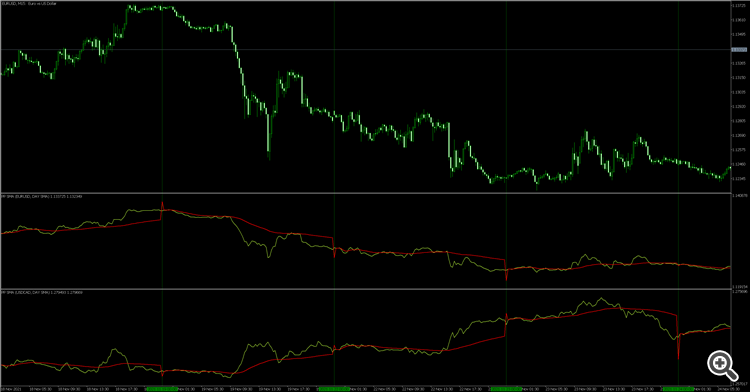
Puoi anche confrontare diversi strumenti finanziari sullo stesso grafico dei prezzi.
Ad esempio, EURUSD e USDCAD, M15.
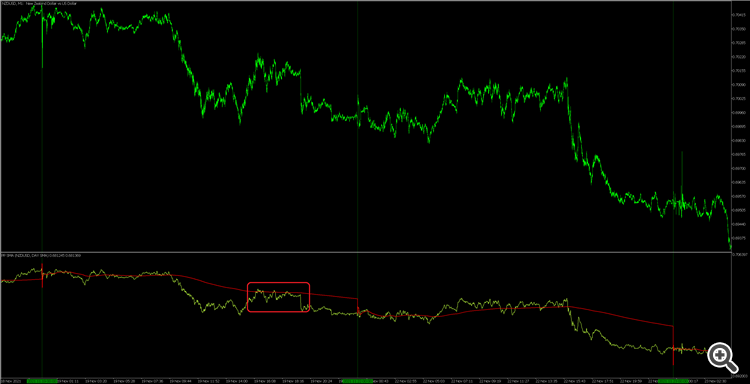
L'indicatore permette anche di vedere i livelli di resistenza/supporto del prezzo medio giornaliero.
 Price period SMA
The indicator calculates the average price for the specified period.
 Convert iExposure.mq4 From MetaQuotes
iExposure will show the opening of trading positions in tabular form in the sub-window below the main window. This allows the trader to see at a glance the positions in the market including the profit value and the amount of risk for each position. The iExposure indicator is a technical tool that is easy to use and very helpful, especially if a trader opens several trades at once with several different instruments. Traders can add the iExposure indicator to any price chart if they wish to use it. By adding the iExposure indicator, traders can also still see tabs of other trading positions for other currencies. Also note that iExposure can also monitor all trading positions, besides being able to make details by displaying one position for one window.
 Consolidation Detector
Draws an equidistant channel to detect rectangular consolidation pattern on chart
 Bobokus Fibonacci
Select Timeframe to draw Bobokus Fibonacci and add any custom fibonacci levels you want


