Unisciti alla nostra fan page
- Visualizzazioni:
- 6367
- Valutazioni:
- Pubblicato:
- 2018.11.20 12:51
-
Hai bisogno di un robot o indicatore basato su questo codice? Ordinalo su Freelance Vai a Freelance
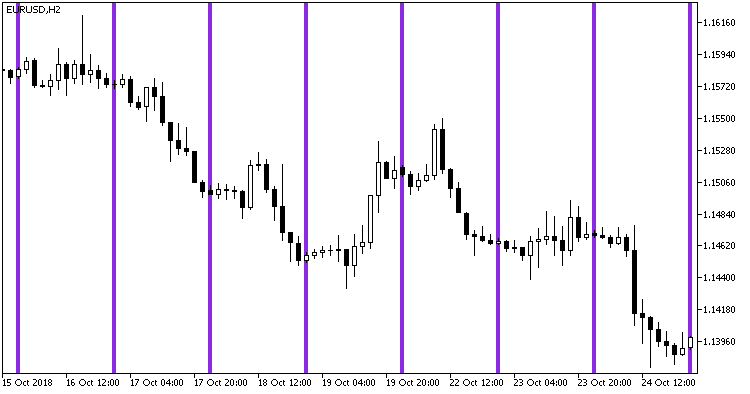
The indicator plots one vertical line per day in a specified moment of time. Lines are drawn using indicator buffers and DRAW_HISTOGRAM2 graphical construction type. It is recommended to place the indicator on the main chart before attaching other indicators.

Fig. 1. Time_Bar_Custom indicator in the main chart window
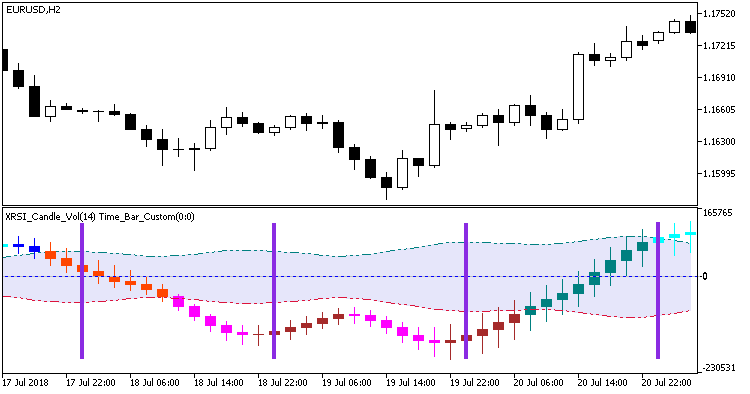
You can also place the indicator in the additional windows of other indicators simply by dragging it to these windows from the Navigator window.

Fig. 2. Time_Bar_Custom indicator in the additional window of another indicator
Tradotto dal russo da MetaQuotes Ltd.
Codice originale https://www.mql5.com/ru/code/22982
 Time_Candle_Custom
The indicator paints a candle in color corresponding to its direction once per day at a specified time
 Secwenta
The Expert Advisor counts the number of bullish and bearish bars in a row.