Unisciti alla nostra fan page
- Visualizzazioni:
- 10623
- Valutazioni:
- Pubblicato:
- 2018.12.28 13:04
- Aggiornato:
- 2019.01.17 11:29
-
Hai bisogno di un robot o indicatore basato su questo codice? Ordinalo su Freelance Vai a Freelance
Indicator SCAD (iCrossAD). It shows possible reversals or price roll-backs. The indicator is based on the intersecting by A/D a trend line built on the extreme values of indicator A/D.
The indicator is based on the "MT4 signal function based on the Accumulation/Distribution (A/D) indicator" described in article "An Insight into Accumulation/Distribution and Where It Can Get You. Briefly: If a trend line built on the A/D indicator chart is crossed by the indicator line, then the price will most probably cross the trend line based on the price chart, too. Thus, upon a signal from the indicator, a reversal or a roll-back can be expected.
The indicator has twenty-three adjustable parameters:
- AD applied volume — volume used when calculating AD
- Bars for calculate — number of bars where the intersection is looked for.
- Unchecked bars — number of the last bars on the right, the intersection with which is not considered as a signal ("sensitivity" filter).
- Filtering indicator — filtering indicator
- Without filtration - without filtering on additional indicators
- Filter by CCI - filter on indicator CCI
- Use setting by default CCI parameters — if CCI is used for filtering the signals, then the Yes value allows using the CCI default settings.
- CCI period — CCI calculation period if default CCI settings are not used.
- CCI appled Price — CCI calculation price if default CCI settings are not used.
- The upper level of the filter indicator — upper level of the filtering indicator.
- The lower level of the filter indicator — lower level of the filtering indicator.
- Draws arrow on chart — draw signal arrows on the price chart (Yes/No).
- The size of the arrows on the chart — size of signal arrows on the price chart.
- Bullish arrows color — color of bullish arrows.
- Bearish arrows color — color of bearish arrows.
- Draw a trend line — draw a trend line on the A/D indicator chart, intersections with which are searched for (Yes/No).
- Trend line thickness — thickness of the trend line.
- Trend line style — style of the trend line.
- Downtrend line color — color of the downtrend line.
- Uptrend line color — color of the uptrend line.
- Draw the search area — draw the area for searching the intersections (Yes/No).
- Search area style — drawing style of the search area
- Fill - filling
- Frame - frame
- Search area line width (if Frame mode) — line width of the search area (if drawing with a frame is selected).
- Search area line style (if Frame mode) — line style of the search area (if drawing with a frame is selected).
- Search area color — color of the search area line/filling.

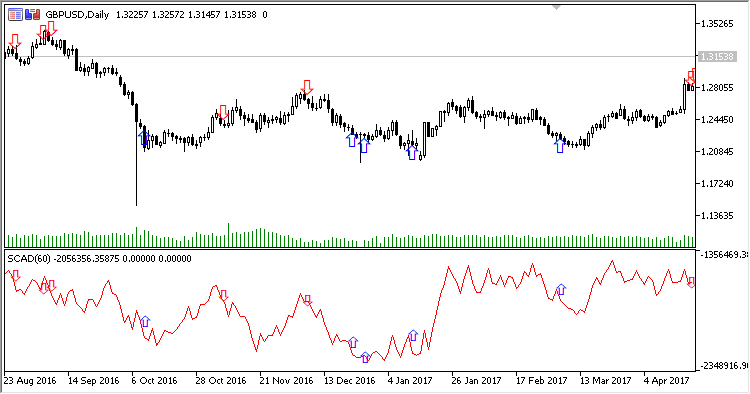
Fig.1. SCAD, default settings

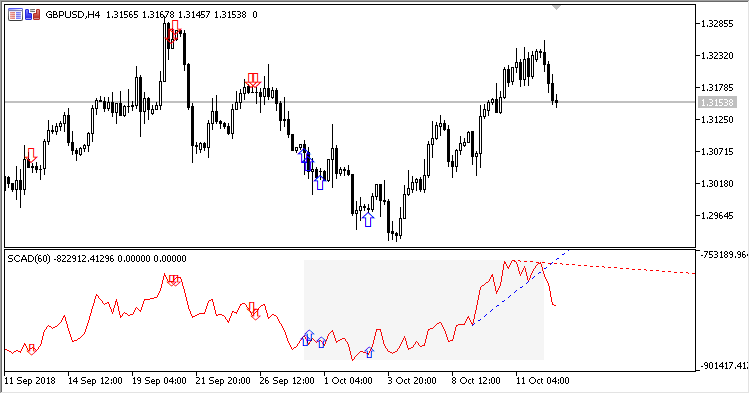
Fig. 2. SCAD, default settings. Draw a trend line = Yes, Draw the search area = Yes, Search area style = Fill
Tradotto dal russo da MetaQuotes Ltd.
Codice originale https://www.mql5.com/ru/code/22753
 Pivot_Fibs_Custom
A set of Fibo levels (pivot points) built on candles of the timeframe specified in the inputs
 Pivot_Fibs_Custom_Arr
A set of Fibo levels (pivot points), based on candles of a timeframe specified in the inputs, made in the form of labels
 ATR Dual
The indicator displays two indicators ATR with different averaging periods in a single window.
 Fractal_Channel
Indicator Fractal Channel