Unisciti alla nostra fan page
- Visualizzazioni:
- 9111
- Valutazioni:
- Pubblicato:
- 2018.06.18 15:12
-
Hai bisogno di un robot o indicatore basato su questo codice? Ordinalo su Freelance Vai a Freelance
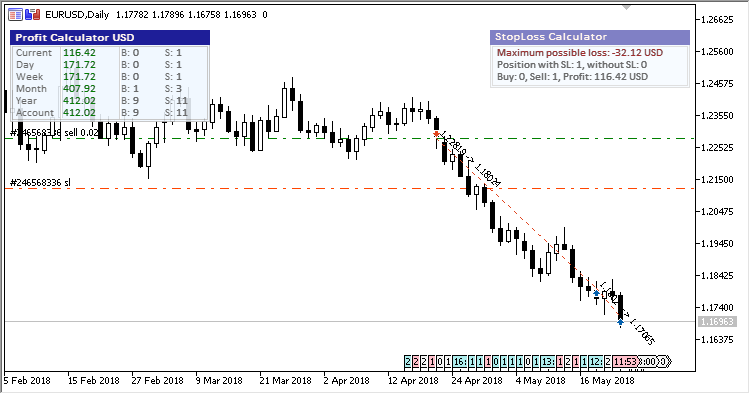
The indicator calculates and shows in the panel in the price chart:
- Size of the current profit from all the open positions on the account, as well as the number of the current Buy and Sell positions;
- Size of the profit from closed positions over the last day, as well as the number of the closed Buy and Sell positions over the last day;
- Size of the profit from closed positions over the last week, as well as the number of the closed Buy and Sell positions over the last week;
- Size of the profit from closed positions over the last month, as well as the number of the closed Buy and Sell positions over the last month;
- Size of the profit from closed positions over the last year, as well as the number of the closed Buy and Sell positions over the last year;
- Size of the profit from closed positions over the entire account life, as well as the number of the closed Buy and Sell positions on the account;
It has ten input parameters:
- Start day of the week - start day of the week:
- Monday - Monday;
- Sunday - Sunday.
- Panel corner - chart corner, to which the panel is anchored;
- Panel X offset - horizontal shift of the panel from the anchoring corner;
- Panel Y offset - vertical shift of the panel from the anchoring corner;
- Panel transparency - panel transparency (255 means complete opacity)*;
- Panel background color - panel color;
- Panel border color - panel border color;
- Panel text color - panel text border;
- Loss value text color - fixed loss value text color;
- Profit value text color - fixed profit value text color.
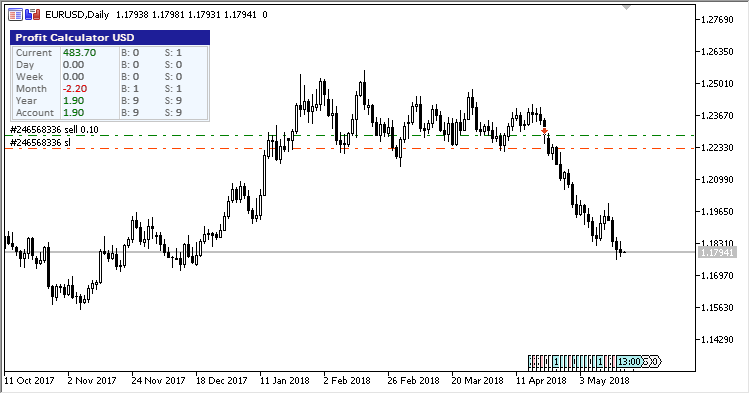
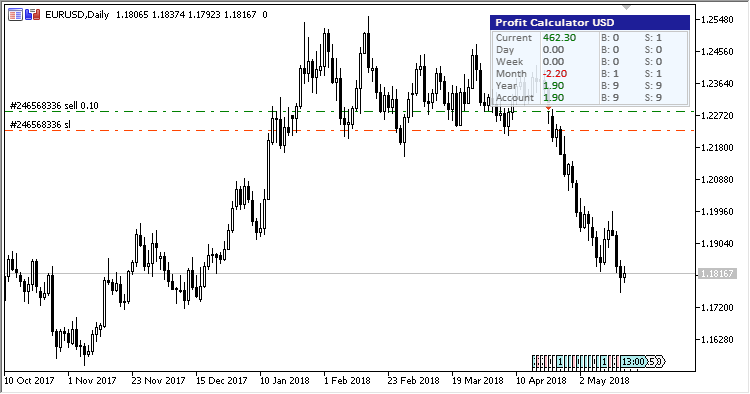
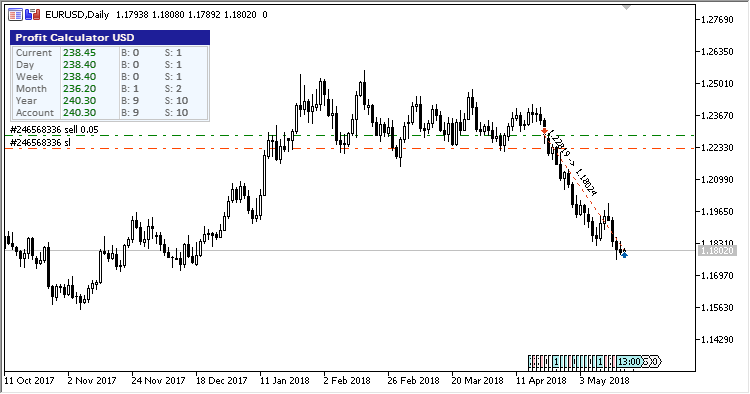
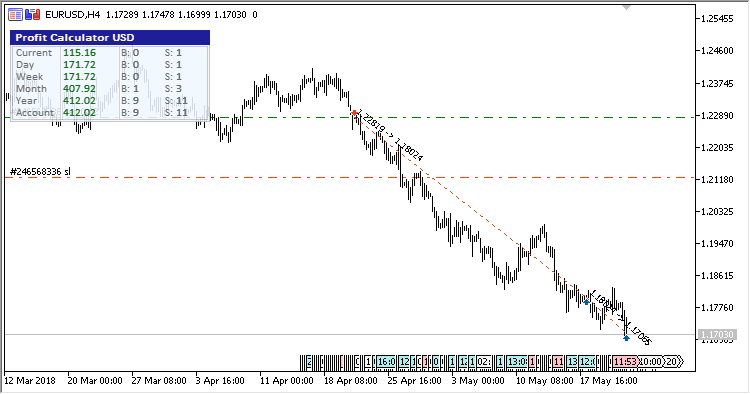
For more convenience, this panel showing the current and fixe profit can be combined with the indicator of possible losses at closing open positions by a Stop order (SL_Calculator):
Tradotto dal russo da MetaQuotes Ltd.
Codice originale https://www.mql5.com/ru/code/20870
 RSI_STARC
RSI + STARC Bands (Stoller Average Range Channels).
 Volatility_Ratio
Indicator Volatility_Ratio.
 Trend_Angle
The indicator calculates the inclination angle of the last segment of moving average and shows it in the chart together with the MA line and the line drawn from the last segment of moving average.
 BrainTrend2_V2_x10
Indicator BrainTrend2_V2x10 shows the color of the BrainTrend2_V2 indicator candlesticks from ten different timeframes.