Unisciti alla nostra fan page
- Visualizzazioni:
- 6154
- Valutazioni:
- Pubblicato:
- 2017.08.10 09:49
- Aggiornato:
- 2023.03.29 13:47
-
Hai bisogno di un robot o indicatore basato su questo codice? Ordinalo su Freelance Vai a Freelance
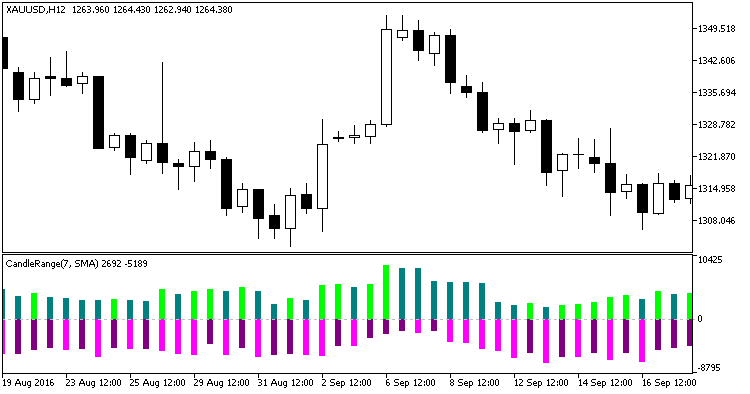
Two histograms in one window, showing the maximum average price deviation in points from the initial value. The upper green histogram is the averaged difference between High and Open of a price series. The lower histogram shows the average difference between Low and Open of a price series. A bright color of the upper histogram indicates the growth of the candlestick High. Brighter color of the lower histogram means the decrease of the candlestick Low. Dark colors indicate the opposite.
The indicator uses the SmoothAlgorithms.mqh library classes (copy it to <terminal_data_folder>\MQL5\Include). The detailed description of the classes is available in the article Averaging Price Series for Intermediate Calculations Without Using Additional Buffers.

Fig. 1. The CandleRange indicator
Tradotto dal russo da MetaQuotes Ltd.
Codice originale https://www.mql5.com/ru/code/18308
 cheduecoglioni
The EA waits for a TP or SL to trigger, and then opens a position in the opposite direction. It checks if there is enough money before sending a trade request. OnTradeTransaction.
 Laguerre stripped of double stochastic
Stripped Laguerre of double smoothed stochastic.
 TotalPowerIndicatorX_HTF
The TotalPowerIndicatorX indicator with the timeframe selection option available in the indicator input parameters.
 Bollinger Bands N positions
Signals are generated by the iBands, Bollinger Bands indicator. When a signal is received, opposite positions are closed.