Unisciti alla nostra fan page
- Visualizzazioni:
- 16180
- Valutazioni:
- Pubblicato:
- 2013.03.25 10:45
- Aggiornato:
- 2016.11.22 07:32
-
Hai bisogno di un robot o indicatore basato su questo codice? Ordinalo su Freelance Vai a Freelance
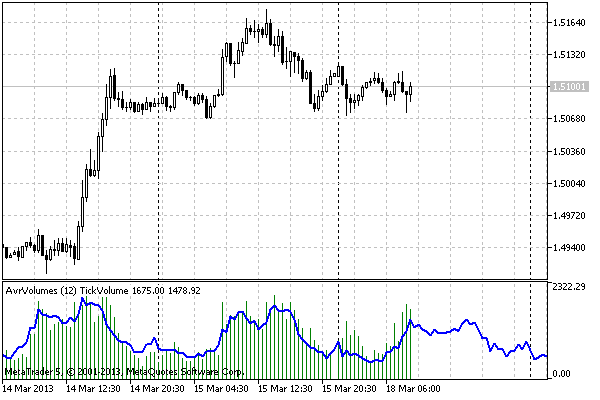
The indicator displays in a separate window "Tick Volume" or "Real Volume" volumes and their average value on history. The average value of volumes is used for drawing the forecast of their volumes value for the current and the following days.
The average value of volumes is performed considering the day of the week, i.e. Monday volumes average with the previous Mondays' volumes, Tuesday with Tuesdays and so on.
Set the number of averaging weeks and type of the displayed volumes in indicator input parameters. The number of the used averages can differ from the specified ones in parameters. If the terminal lack of data for the specified number of averaging weeks, for example, if insufficient value of the "Max bars in chart" terminal parameter set, then number of averages can be significantly less than the specified one.
The real number of average weeks can be seen, if set the mouse pointer to the line of average values. In this case it will be specified in the tooltip how many weeks succeeded to use for averaging.
Line of average values can be additionally processed by the median filter. It should also be considered that there is a risk to smooth some significant peak. Default median filter disabled.

If quotes supplier during the whole time of averaging didn't change the parameters of algorithm, then it will be well seen, if the current volumes were significantly less or more than the average value. Such situation can be considered as decrease or increase of the market activity relative to average value.
In addition to other things, when applying neural networks you can try to use for their learning not only the previous values, but also forecasted volume values.
Tradotto dal russo da MetaQuotes Ltd.
Codice originale https://www.mql5.com/ru/code/1603
 Object Emulator
Emulator of functions for working with objects. It gives possibility to see the objects after testing in the chart
 Easy Trend Visualizer
Simple trends visualizer
 CCIArrows
The semaphore signal indicator fixing moments of breakthrough of the zero level by the iCCI technical indicator and displaying these moments by color points
 FigurelliSeries
The indicator allows defining the trend direction