Guarda come scaricare robot di trading gratuitamente
Ci trovi su Twitter!
Unisciti alla nostra fan page
Unisciti alla nostra fan page
Ti è piaciuto lo script? Provalo nel Terminale MetaTrader 5
- Visualizzazioni:
- 7776
- Valutazioni:
- Pubblicato:
- 2015.07.27 09:22
- Aggiornato:
- 2016.11.22 07:32
-
Hai bisogno di un robot o indicatore basato su questo codice? Ordinalo su Freelance Vai a Freelance
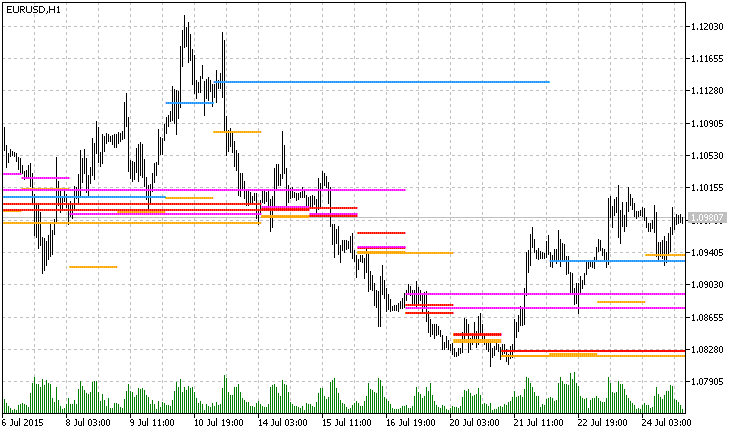
This indicator shows the support/resistance lines using price histogram. The indicator is not so heavy, the calculation was simplified.
Display:
- Gold Line — peaks of a 1-day histogram.
- Red Line — peaks of a short term histogram.
- Magenta Line — peaks of a medium term histogram.
- Blue Line — peaks of a long term histogram.

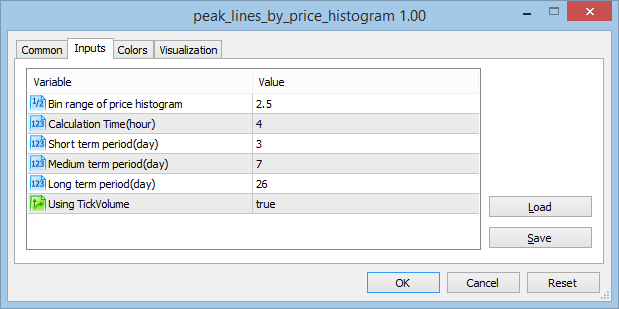
Settings:

 MomentumCloud
Cloud indicator, the envelopes of which represent the Momentum oscillator values calculated for High and Low prices.
 ColorZerolagTriXOSMATrend_x10
The ColorZerolagTriXOSMATrend_x10 indicator shows the ColorZerolagTriXOSMA oscillator direction from ten different timeframes.
 ColorZerolagRSIOSMA_HTF
The ColorZerolagRSIOSMA indicator with the timeframe selection option available in the input parameters.
 ColorZerolagRSIOSMACandle
The ColorZerolagRSIOSMA indicator implemented as a sequence of candlesticks.