Unisciti alla nostra fan page
- Visualizzazioni:
- 3262
- Valutazioni:
- Pubblicato:
- 2017.01.18 09:01
- Aggiornato:
- 2023.03.29 13:45
-
Hai bisogno di un robot o indicatore basato su questo codice? Ordinalo su Freelance Vai a Freelance
Real author:
paladin80
Moving average wing averaging of the linear combination of the input price timeseries.
The moving average, just like any other indicator, can be calculated only based on 7 price constants. This modification of the moving average allows to calculate the indicator based on any combination of the 4 main price types (close, open, high, low). For this purpose, four coefficients are used as the indicator's input parameters:
- Close_coef - weight coefficient of CLOSE price for calculation of the individual price;
- Open_coef - weight coefficient of OPEN price for calculation of the individual price;
- High_coef - weight coefficient of HIGH price for calculation of the individual price;
- Low_coef - weight coefficient of LOW price for calculation of the individual price.
Resulting formula of the weight constant:
Price = (Close_coef*CLOSE + Open_coef *OPEN + High_coef*HIGH + Low_coef*LOW) / (Close_coef + Open_coef + Open_coef + High_coef + Low_coef );
The indicator uses SmoothAlgorithms.mqh library classes (copy it to <terminal_data_folder>\MQL5\Include). The use of the classes was thoroughly described in the article "Averaging Price Series for Intermediate Calculations Without Using Additional Buffers".
The original indicator was developed in the MQL4 language and published in the CodeBase on 11.11.2012.

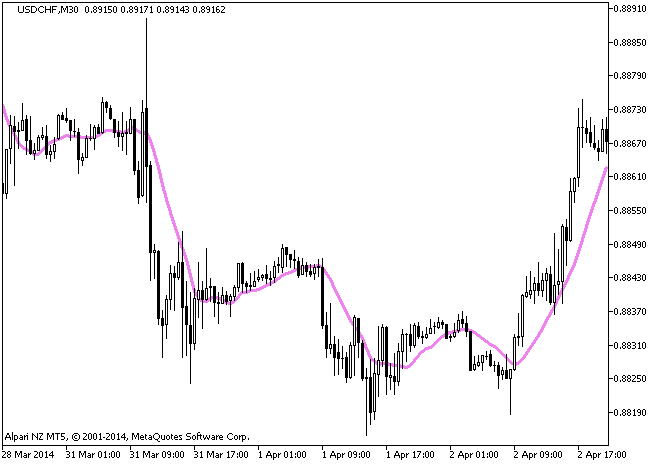
Fig1. The Imp_XMA indicator
Tradotto dal russo da MetaQuotes Ltd.
Codice originale https://www.mql5.com/ru/code/11377
 DownloadHistory
Symbol for downloading the history data for the current symbol with indication of progress.
 YURAZ_RSAXEL Script draws the Axel Rudolph levels
Script draws the Axel Rudolph levels
 BoDi
BoDi
The Standard Deviation indicator implemented in the form of a color histogram.
 Switching charts
The script switches all opened charts at a certain interval. It is also possible to display only the charts of certain symbols.