SensorMap

5

Concept

Market arranges in Time upcoming Phases according to the present Results of its Interest.

Directing Modulations are an Interaction of immanent Periods, which show in Reference

  • to Time cyclic Activity and
  • to Price leveling Activity.

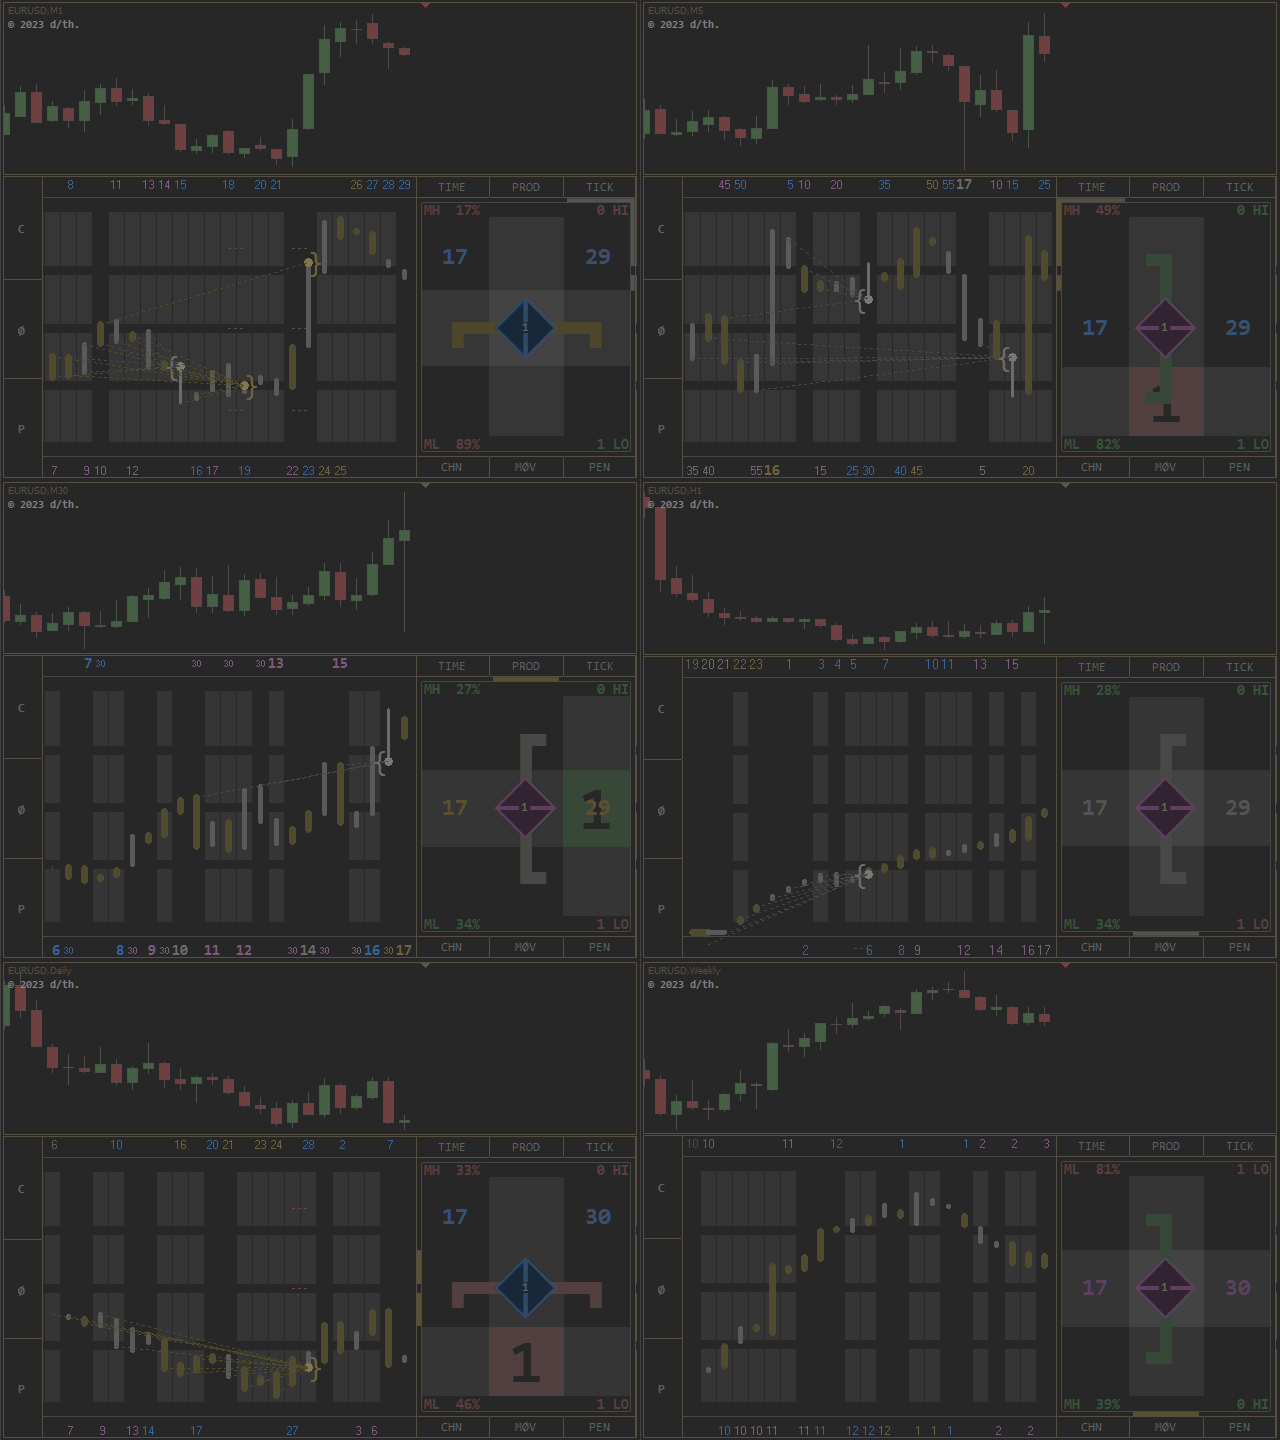
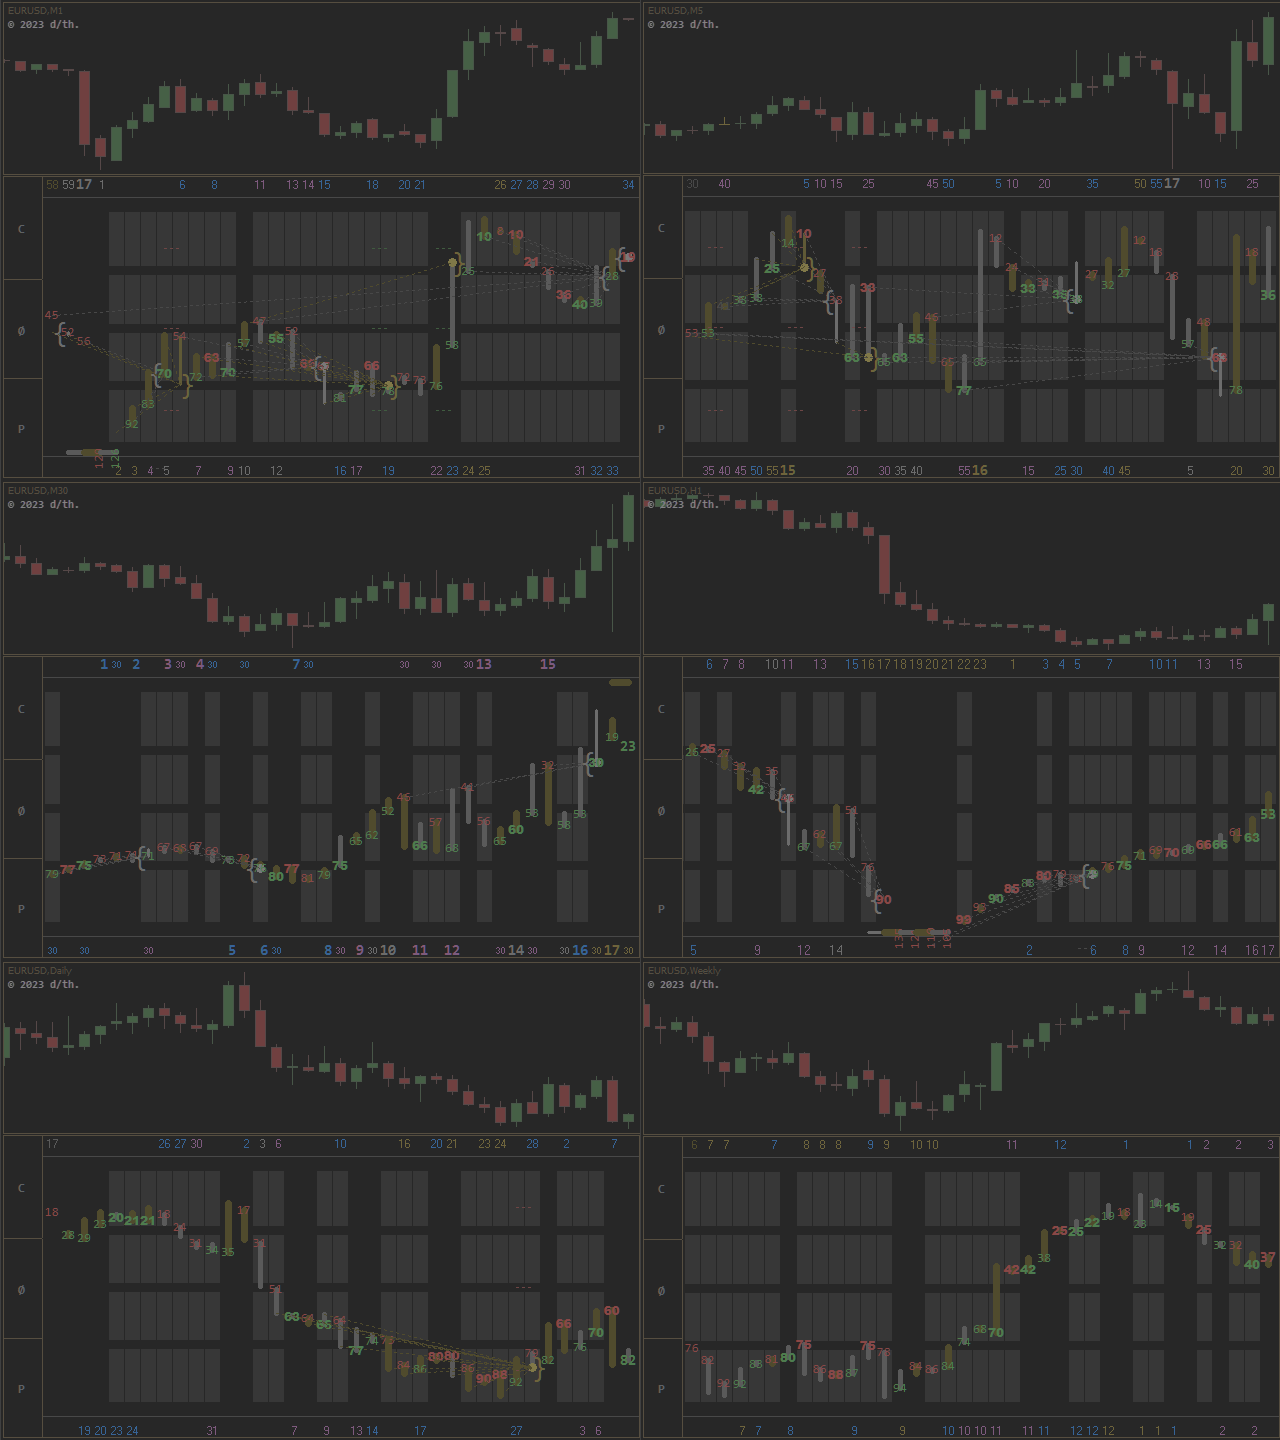
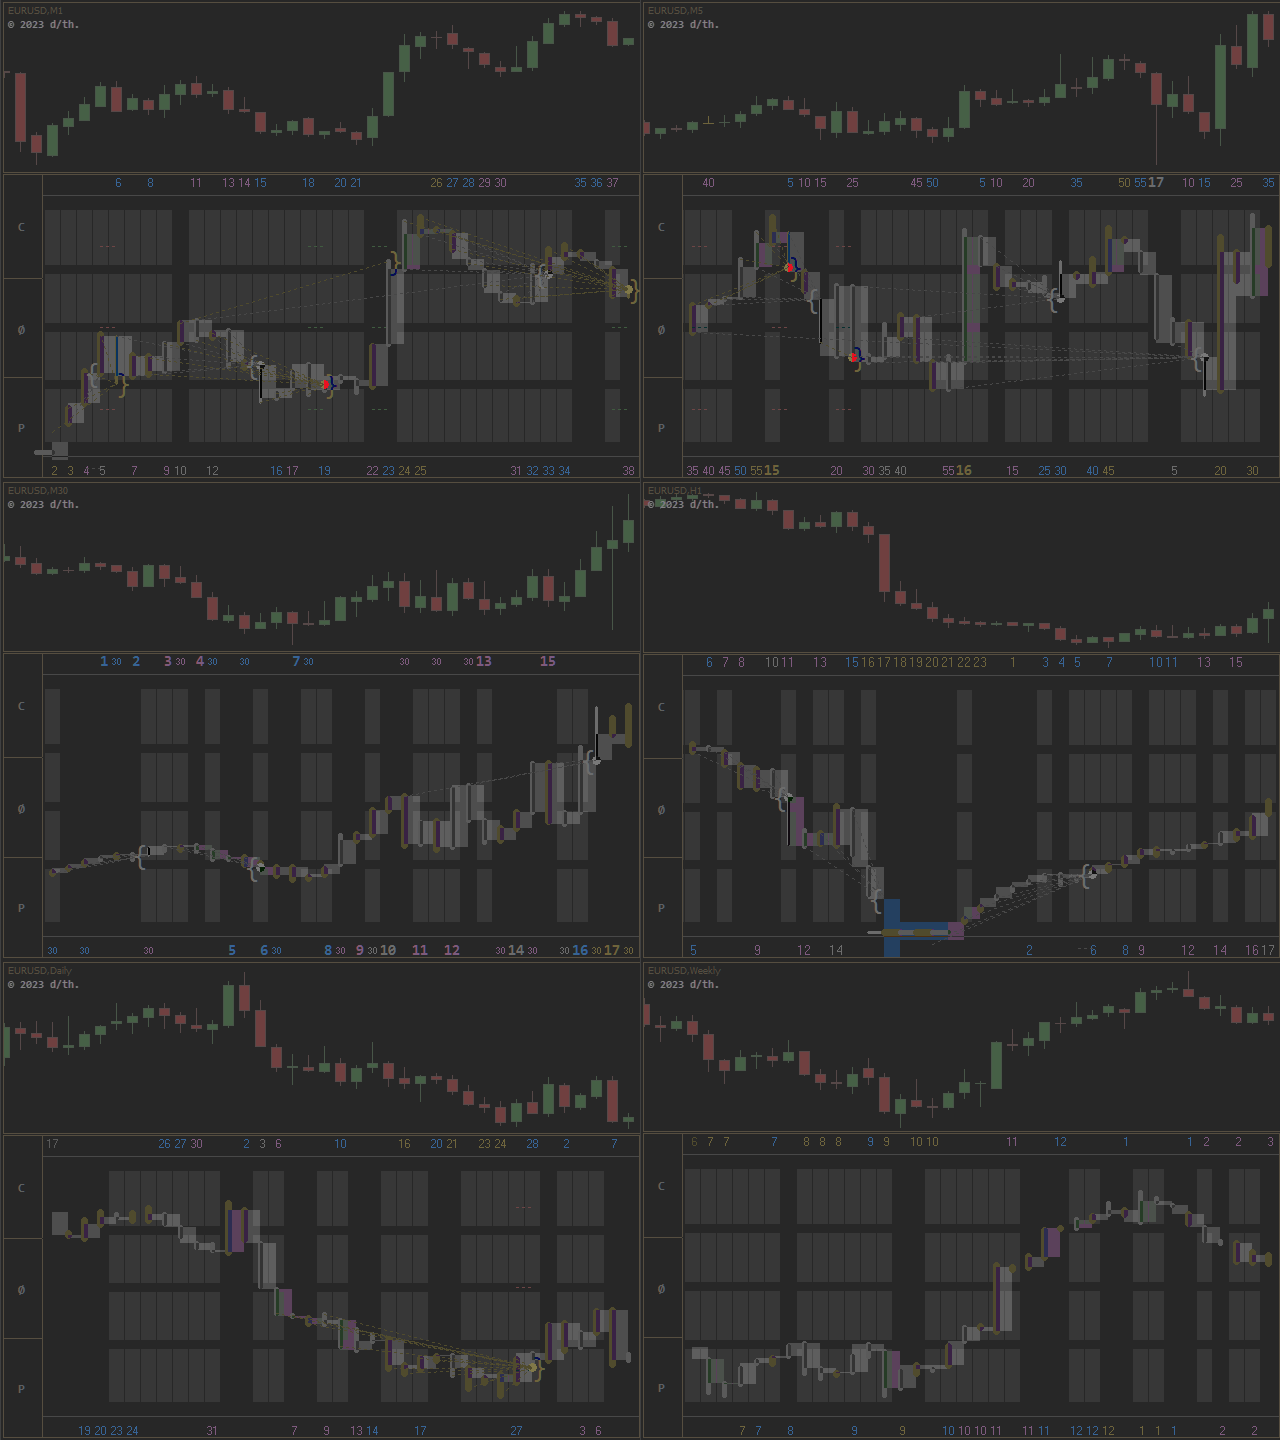
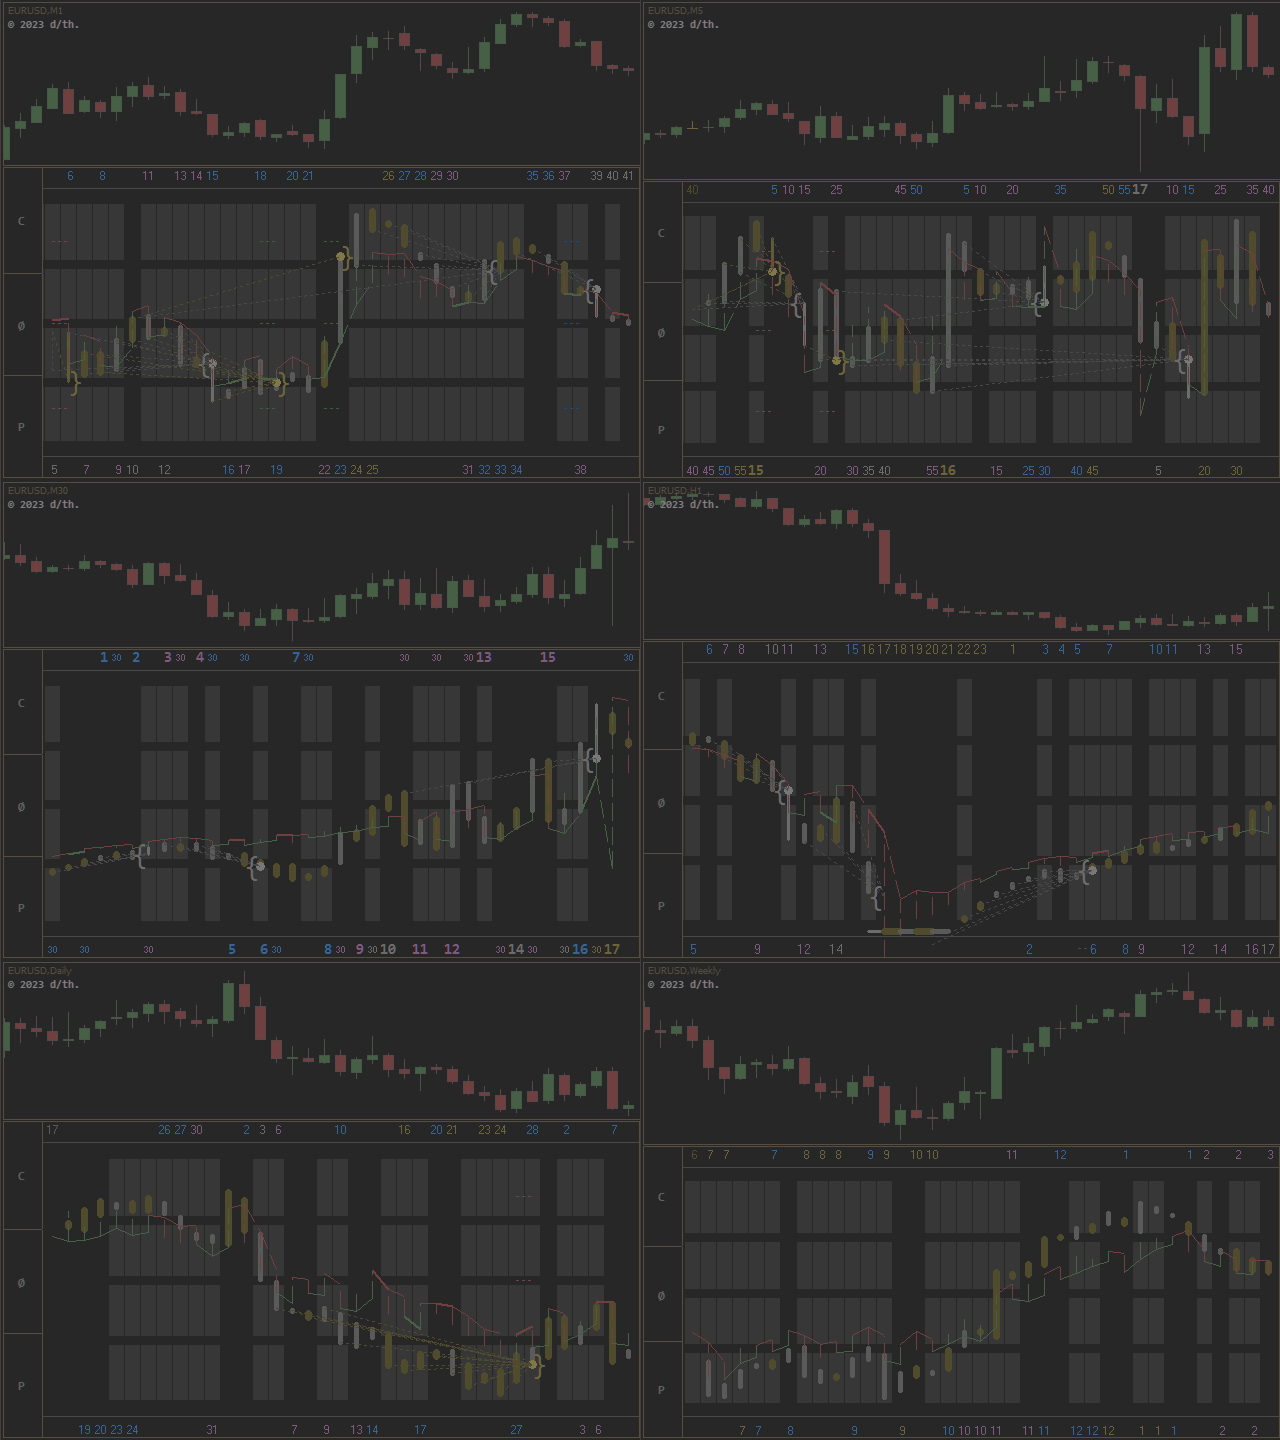
SensorMap is a reflecting Volume Mask of this Concept of Time and Price and

  • apportioning developed Price Movements in an equalized 100 % - Range: how far moved ?
  • indicating their Status by marking special Events: when which Action ?
  • setting the Situation in a functional Relation to the presented Support/ Resistance - Motive: miss/ hit/ pass ?


equalize and reflect

Choose of relative

  • Price Ranges and Moves
  • Triple Moving Average

and mirror them instantaneously against their Channelcenter by Button on the Volume Band.


Content

Price Time Channel

Multidimensional, equalized/ flattened and mirrorable Timingband as Matrix for Time, Price, Tick and Averages in definable Appearance Option.


Period Event Notation

    Price is noted (in Relation to W1)

    • as Bars, Clips [] and Streams (with Scales by ZeroLink),
    • as Value (directional and white: Null/ Support, orange: Full/ Resistance),
    • as Period Moves (Color set by the reached Level in Channel),
    • as High- and Low-Range Trends (related to MN, Color directional).


    Moving Averages

    The Price Averages work as ranging Levels, each in its flattened Channel. They reflect the Movement as periodic Pricelines and cooperate.


    Special Events are displayed:

    • PointZero as situational Scale (15/ 50/ 85 %, blue: cyclic, green/ red: leveling)
    • Close on limiting numeric Values (Fraction Hits bold), 
    • Tick Deviation to prior Period > +/-15 % (Background bright)
    • interdimensional Crosses (Color Overtaking) and periodic Triggers (Line dotted) of Moving Averages
    • Objects beyond their respective Channelband are lined up at Chartborder until Reentry (= Time is ticking for this Component)


    Layers

    • framing periodic Timedisplay (Side of Open/ if Zero at both Sides, Color: Channel Position)
    • simplified Servertime Clock (Circulation = Period / 8) with relative Positions of Move-High and Move-Low on actual Period Range
    • the conditional BullBear Compass indicates situational Phases with 3 Symbols and 4 Aggregate States 
      • on the Productivity-Cube 


    Additional Benefits

    • individual Appearance Preferences
    • a detailed Definition of Objects and Functions by the Descriptive Mode (Tool Tips)
    • adjustable Window Size, seamless functional Complement for its origin opposite Pricechart


    Contemplate its Concentrate

    The Signal Density is related to Markets actual Phase, chosen Timeframe/ Security and Components.

    SensorMap generates as resulting Composition a defined Setting of Support and Resistance:

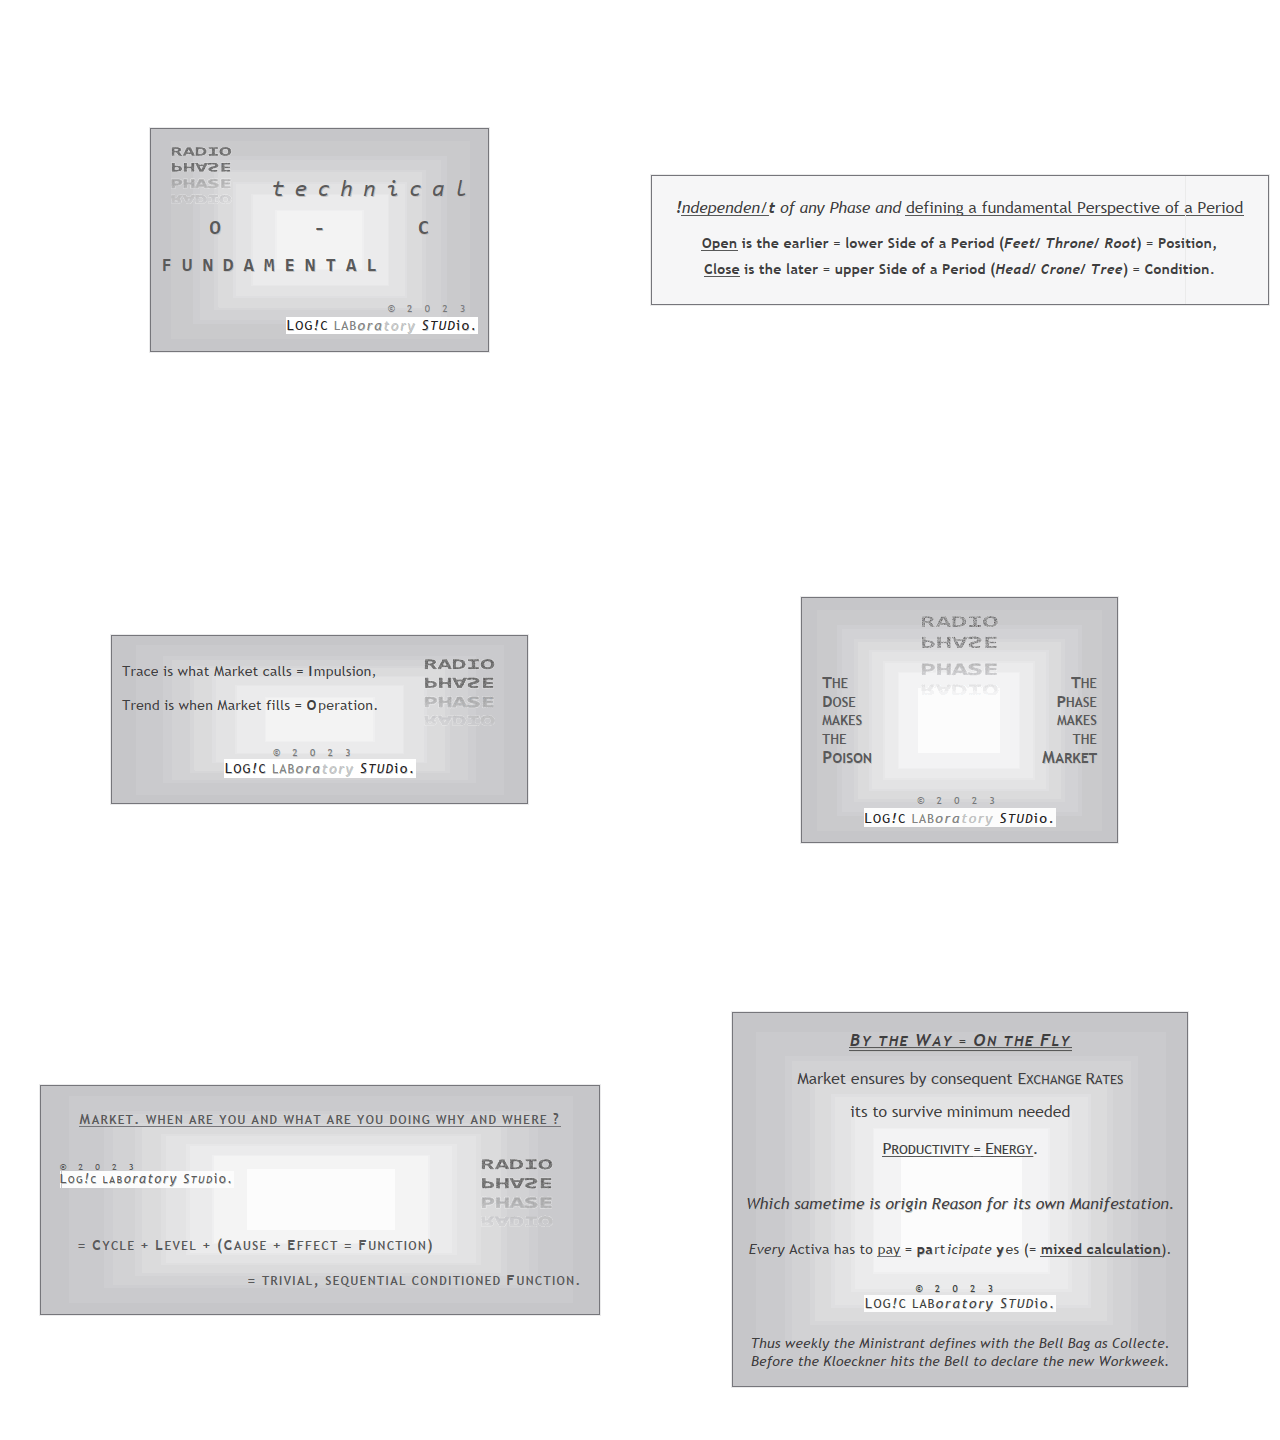
    No Matter which Hemisphere: [ Open = Support | Resistance = Close ]


    Both look like the Other.

    The MindMask resolves the active Status.


    A Picture is worth a thousand Words.

    Indicative : Colorized : Universal


    Please find all necessary Informations to this Product in its Compendium.

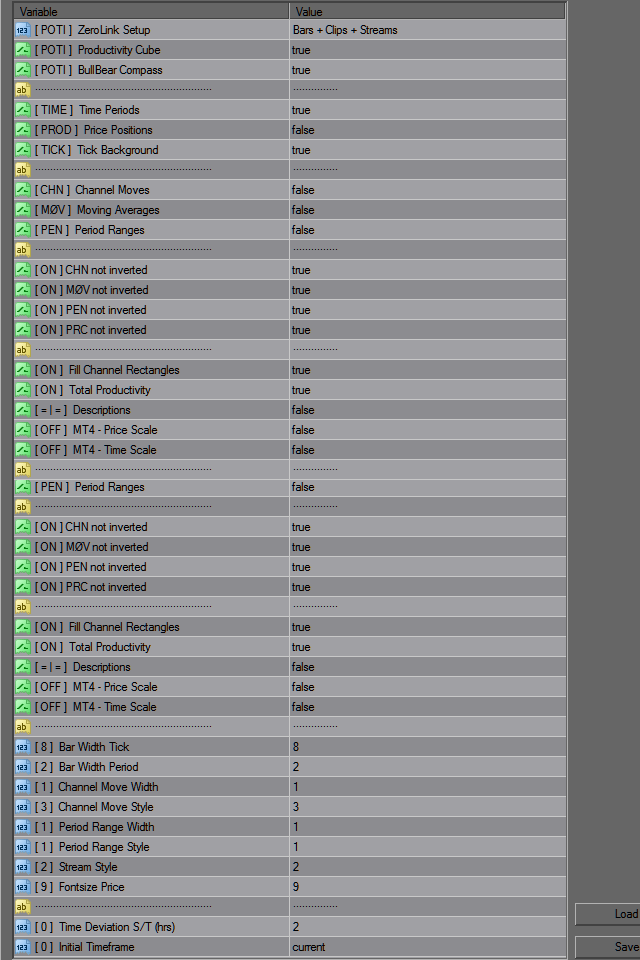
    Below as Orientation the Extract of the individual Indicator-Adjustments.


    Indicator SensorMap

    Think global - Act local


    Multidimensional, equalized and mirrorable VolumeBand 

    • as Matrix for Time, Price, Tick
    • and Channel (Ranges/ Moves/ Averages)
    • Window-Height = 135%
    • Border-Clock-Frame = 115%
    • Tick-Barsize = 100%
    • colored ZeroPoint Scale = 15%/ 50%/ 85%
    • black Bar-Divider = 25%/ 50%/ 75%

    Buttons to the Left: Mirror-Function of Channel/ Average/ Pen.

    Edging Values are lined up at Chartborder.


    Ideally in Completion with the PointZero PriceGraph is the VolumeBand a Composition of

    Time Band = Equalizer
      • 1D Time
      • periodic Sentence 
      • equalized Product = Timeline
      and
        Volume Clock = Oscillator
          • 3D Productivity Sensor + 12D BullBear Compass
          • Productivity = Potential
            • -2 / -1 / 0 / +1 / +2
          = Sensor = Sequence
            • BullBear = Phase 
              • Rotor/Stator
              • Trend/Trace
              • Gator/Zero
            = Compass = Sentence


              [VALUE] =

              • Boolean: Button Position on Chart
              • Variable: default Value


              The default View of the Chart consists of following Components and is read like follows:


              Time Band

              Moves (escalative Trace/Trend), by default depicted via ZeroLink-Module:

              • Colors:

                • Close = orange
                • Open = brightgray
              • as Pens (Bars)
                • by Close and Open 
                • 2x2 overlaying Lineweights
              • as Clips 
                • Perspective of Activa
                • works as Pointer
              • as Streams 
                • interactive OC-Work
                • presents active Phase
              • actual and last active Directive 
                • as big Dot


              ZeroLink: Appearance of PointZero as periodic Scale (dotted)

              • blue: active Time/ Cycle
              • directional: active Price/ Level


              Volume Clock

              • Frame = Period Clock (Period / 8)
              • Background = Productivity Potentiometer 3D
              • Onlay Bull Bear Compass 12D
              • Onlay Clock
                • Position on active operative Mode-Side
                • Coloring according Price Position in Channel
                • valid also for TimeBand-Frame-Periods

                       
                  Shell % Shell % Tone
                       
                  <0 - 15
                  85 - 100>
                  orange
                  15 - 30
                  70 - 85
                  blue
                  30 - 45
                  55 - 70
                  violet
                  45 - 50
                  50 - 55
                  gray
                       

                    Role 07: five-dimensional translating Volume-Channel

                    (Potential-Shells of Unit 1 Being develops from Within (2D-Center = 50% = 3D-Center = 0%))


                    Fundament

                    Body of Chart


                    The visual Conjunction of both Mask-Complements uses extra Room for additional

                    Buttons of the Price-Chart, to have direct Access to its three Core-Options.


                    ZeroLink Setup [POTI]:

                    Toggle the Composition of the default Chart-Layout:

                    • in Options
                      • choose of limitless Adjustability
                    • on Chart
                      • toggle separate Components 
                      • by Click on the Poti-Background
                      • first Click minus Clips
                      • second Click minus Streams
                      • third Click minus Pens
                      • fourth Click all back


                    Productivity Cube [POTI]:

                    Productivity Display -1 / 0 / +1


                    VPP = Volume per Period:

                    • 3 vertical Bars
                    • absolute (= Frequency)
                    • Impulse / Period
                    • Sensitivity 15%
                    TPP = Ticks per Pip:

                    • 3 horizontal Bars
                    • relative (= Alteration)
                    • Impulse / Pip
                    • Sensitivity 33%

                      PPT = Pips per Tick:

                      • 9 resulting Positions
                      • total (= Oscillation)
                      • Pip / Impulse
                      • Sensitivity 2 x 25 = 50%


                          VPP [-15%] VPP [= 0] VPP [+15%]
                          TPP [+33%] = 0 + 1 + 2 PPT [+50%]
                          TPP [= 0] - 1 = 0 + 1 PPT [+25%]
                          TPP [-33%] - 2 - 1 = 0 PPT [= 0]

                          PPT [-50%] PPT [-25%] PPT [= 0]
                                   
                          Role 08: three-dimensional ionic Productivity-Cube

                          (ionic = Sensor of current electronic Potential)


                          BullBear Compass [POTI]:

                          Sensor of current sequential Phase


                          Arms: Color navigational/ positional

                          • Zero = gray
                          • Gator = orange
                          • else directional
                          Gate = Tap = Zero/ Gator

                            • Prop horizontal = Level Phase
                              • glides
                            • Prop vertical = Cycle Phase
                              • sways

                            Bull = Gap to North/ Lap to South

                              • Arms up = Rotor/ Level Trend
                                • hurls
                              • Arms right = Stator/ Cycle Trace
                                • looks like C, but is O

                            Bear = Gap to South/ Lap to North

                              • Arms down = Rotor/ Level Trace
                                • runs
                              • Arms left = Stator/ Cycle Trend
                                • looks not like C, but is C


                              Head: Color phasic

                              • blue: Cycle - W1-Activity
                              • violet: Level - D1-Activity
                              • Arrow = ver: Cycling/ hor: Leveling
                              • Divisor = ver: Stator/ hor: Rotor
                              • please recognize Frame and Inlet (Cause + Effect)


                              Note:

                                The small central Number marks the Time-Deviation Server/ Terminal.

                                • No Deviation = · dot if not
                                • Deviation < 9 sec = Seconds
                                • Deviation > 9 sec = ×

                                This Difference can be caused by either Side, because it measures

                                • current Server-Time against current System-Time.

                                Consequently it is also an Indicator, how precise the System-Time is adjusted.

                                Modern OS come with the Functionality of Time-Setting by atomic Clock-Data.

                                Please refresh sporadic the System and/or in Case of questionable Results.

                                Ensuring that delivers precise Notation about Deviations/ Differences/ Offsets.


                                Layers

                                projective Reflection = reflective Projection


                                The Card Deck:


                                Time Periods [TIME]

                                Toggle the framing Time - Display

                                • (colored by Channel Position)
                                • Button-Click on the top Time-Row 
                                • changes operative Mode from Open to Close
                                  • recognizable at Color of Poti-Frame
                                  • and Color Switch of Channel-Ranges
                                  • Hit Rate around 100% when Resizing Window.
                                  • Reminds, which of both Components 
                                  • unalterable is the directive One.

                                • Button-Click on the bottom Time-Row 
                                • toggles Moving Averages
                                  • first Click minus W1
                                  • second Click minus MN
                                  • third Click all back


                                Price Positions [PROD]

                                Toggle the relative Price - Values (related to W1-Channel)

                                An Inversion of the Price-Component is accessed by Click on the Propeller Head.


                                Tick Bars [TICK]

                                Toggle Background Histogram (bright-gray)

                                • notes VPP-Deviation < or > 15% to prior Period.

                                = Phase -

                                  • Acceleration [+]
                                  • Deceleration [-]
                                  • individual State (+/-) irrelevant 
                                  • due to resulting absolute PhaseChange
                                • Appearance of a bright Bar notes 
                                • Center-Work, which is defined as decisional = intersecting.


                                  Channel Moves [CHN]

                                  The Rectangles operate in the W1-Channel

                                  Color:

                                  • defined by Channel Position/ Break of Band
                                  • violet = Step/ D1-Move/ Trace-Trend
                                  • blue = Lift/ W1-Move/ Trend-Trend
                                  • white = Null/ MN-Move/ Trace-Trace
                                  • orange = Full/ H4-Move/ Trend-Trace

                                  Adjust the Visual

                                  • Fill Rectangles (or not)
                                  • set Linestyle/ -width

                                  by Integer in the last Section.


                                  Moving Averages [MOV]

                                  The Averages work each in its respective Channel

                                  that means: the Subwindow-Scalation is valid related to the Phase of the Component.

                                  They cooperate and affect their passing Neighbor interdimensional,

                                  • depicted as Color-Overtaking, if they pass near enough.
                                  Their Behaviour is easily comprehensible via PointZero - Indicator.

                                  Their relative Movements reflect the actual leading Priceline/s.

                                  They show in Cooperation with the framing Clock the Time.


                                  Period Event Notation [PEN]

                                  The Period-Trend is related to the MN-Channel and

                                  • builds a directional HI-LO - Grid according to the
                                  • actual RH/ MH/ ML/ RL - Development.
                                  • D1-Price in Relation of the Monthly Channel results as 
                                  • exponential Translation of internal Period-Positions (of OHLC).


                                    Pre-Adjustments of inverted Nature:

                                    • Inversion/ MirrorView initially off
                                    • toggle separately for every Component


                                    Adjustments of general Nature:

                                    • toggle the Visual of the Channel-Moves (filled/ lined Rectangles)
                                    • toggle the Display of the Productivity-Potential (colored Position without Value)
                                    • The Descriptive Mode is useful for Orientation or Confirmation (of not finally settled Experience).
                                    • The MT4-Scales are a "fundamental Adjustment". In particular not resolvable for me. Mine is time-sensitive.


                                    Integer/ Double

                                    constant variable = variable constant


                                    The Icing:

                                    • preadjust Styles/ Widths/ Fontsize (Effect limited)
                                    • Time-Deviation: Server-Terminal (in Hours)
                                    • Initial Timeframe: self-explaining


                                    Please find all necessary Informations to this Product in its Compendium in its respective RadioPhase - Blog.


                                    logiclaboratory studio
                                    © 2018-2023 /thiejden.


                                    Avis 1
                                    Jamie Daniel Thompson
                                    163
                                    Jamie Daniel Thompson 2023.06.22 14:42 
                                     

                                    Extremely useful and incredible tool! I don't understand how this doesn't have 5 star reviews yet! It has totally changed the accuracy of my entries! Thanks to the author!

                                    Produits recommandés
                                    Wise Men Indicator demo
                                    Bohdan Kasyanenko
                                    3 (2)
                                    The indicator displays signals according to the strategy of Bill Williams on the chart. Demo version of the indicator has the same features as the paid, except that it can work only on a demo account . Signal "First Wise Man" is formed when there is a divergent bar with angulation.  Bullish divergent bar - with lower minimum and closing price in the upper half. Bearish divergent bar - higher maximum and the closing price at the bottom half. Angulation is formed when all three lines of Alligator
                                    FREE
                                    PointZero
                                    Juergen Thielen
                                    5 (1)
                                    Concept Market arranges in Time upcoming Phases according to the present Results of its Interest. Directing Modulations are an Interaction of immanent Periods, which show in Reference to Time cyclic Activity and to Price leveling Activity. PointZero is a projecting Price Mask of this Concept of Time and Price and categorizing developed Price Movements related to their own Range: how far moved ? indicating their Status by marking special Events: when which Action ? setting the Situation in a fun
                                    FREE
                                    Free automatic Fibonacci is an indicator that automatically plots a Fibonacci retracement based on the number of bars you select on the BarsToScan setting in the indicator. The Fibonacci is automatically updated in real time as new highest and lowest values appears amongst the selected bars. You can select which level values to be displayed in the indicator settings. You can also select the color of the levels thus enabling the trader to be able to attach the indicator several times with differe
                                    FREE
                                    SuperMac Free
                                    Agus Wahyu Pratomo
                                    4 (1)
                                    FREE VERSION ONLY USE LOT SIZE 0.01 TO UNLOCK IT GO HERE  https://www.mql5.com/en/market/product/61498 SuperMac EA is a trading robot  for the trading on forex and trades  Scalping  Strategy and Tren Follower. This is a Trend Following system that trades in all session.   It use Multi Complex Algorithm to determine tren behaviour.  EA optimized on EURUSD, GBPUSD and NZDUSD (Use together) but can be use on other pair  Use PAIR can use 3 pairs (recommended to maximize profit) at the same time (
                                    FREE
                                    The   OHLC indicator   shows the current and historical values of High, Low, Open, Close and Mid for a specific time period. It can plot the current values or the values from the previous session. The indicator's range can be calculated from a daily, weekly, monthly, or user-specified session. Levels High  of the current or previous session. Low  of the current or previous session. Open  of current or previous session. Close  of the current or previous session. Midpoint  of the current or prev
                                    FREE
                                    This indicator is a perfect tool able to compare which brokers have the lower latency. It shows us immediately which brokers are slower or faster. When you see the dot icon on the line, it means this broker is the faster one and the red line (Broker_A) is the slower one. See the example on the screenshot. How It Works? This indicator shares the prices information to and from the "shared" common data folder. It compares all the prices. The price is based on average by (Ask + Bid) / 2. There are
                                    FREE
                                    UPD1 Rsi Dots Dashboard
                                    Vitaliy Kuznetsov
                                    5 (2)
                                    L'indicateur affiche les signaux basés sur l'oscillateur RSI terminal sur le graphique. Il est possible de filtrer les signaux répétés. Ici, l'oscillateur est utilisé pour rechercher un signal inverse. Il est recommandé comme point d'entrée dans les stratégies swing et le trading à partir de niveaux. Un tableau de bord multidevises est disponible. Avec lui, vous pouvez facilement basculer entre les graphiques. Dans les discussions sur les produits, vous pouvez suggérer un algorithme dans lequ
                                    FREE
                                    Discover Your Edge with Golden Trend Finder Are you tired of second-guessing your trades? Golden Trend Finder is the all-in-one indicator designed to give you a decisive advantage in the market. It's not just another tool; it's a powerful signal generator that combines multiple advanced indicators to provide you with clear, confirmed trading opportunities. Imagine having a smart system that tells you exactly when to enter and exit a trade, filtered to avoid false signals. Golden Trend Finder doe
                                    FREE
                                    PZ The Zone
                                    PZ TRADING SLU
                                    4.33 (3)
                                    This indicator displays buy or sell signals according to Bill Williams' definition of the Trading Zone. [ Installation Guide | Update Guide | Troubleshooting | FAQ | All Products ] Easy to use and understand Avoid trading flat markets Deterministic indicator with clear rules The indicator is non-repainting It implements alerts of all kinds It has straightforward trading implications. A blue arrow is a buy signal A red arrow is a sell signal According to Bill Williams trading in the zone helps to
                                    FREE
                                    Follow The Line
                                    Oliver Gideon Amofa Appiah
                                    3.94 (16)
                                    FOLLOW THE LINE GET THE FULL VERSION HERE: https://www.mql5.com/en/market/product/36024 This indicator obeys the popular maxim that: "THE TREND IS YOUR FRIEND" It paints a GREEN line for BUY and also paints a RED line for SELL.  It gives alarms and alerts of all kinds. IT DOES NOT REPAINT and can be used for all currency pairs and timeframes. Yes, as easy and simple as that. Even a newbie can use it to make great and reliable trades. NB: For best results, get my other premium indicators for more
                                    FREE
                                    SMA Indicator
                                    Nitu Brijesh Yadav
                                    Arrow Indicator (Buy/Sell Alerts) – Simple Yet Powerful Tool!             Product Version: 1.01           Indicator Type: Trend Reversal Signals           Timeframes Supported: All (Recommended: H1, H4, D1)           Key Features: Buy Signal: Green upward arrow () appears below the candle  Sell Signal : Red downward arrow () appears above the candle Accurate Trend Reversal Detection – Based on tried and tested SMA strategy. ️ Clean Chart View – Minimalist, non-i
                                    FREE
                                    FFx MACD
                                    Eric Venturi-Bloxs
                                    4.2 (5)
                                    The purpose of this new version of the MT4 standard indicator provided in your platform is to display in a sub-window multiple timeframes of the same indicator. See the example shown in the picture below. But the display isn’t like a simple MTF indicator. This is the real display of the indicator on its timeframe. Here's the options available in the FFx indicator: Select the timeframes to be displayed (M1 to Monthly) Define the width (number of bars) for each timeframe box Alert pop up/sound/ema
                                    FREE
                                    Email Drawdown Alert
                                    Roman Starostin
                                    5 (12)
                                    Free informative Indicator-helper. It'll be usefull for traders who trade many symbols or using grid systems (Averaging or Martingale). Indicator counts drawdown as percent and currency separate. It has a number of settings: Count deposite drawdown according equity value and send e-mail or notifications to user if DD more than set; Sending e-mail when max open orders reached; Shows price and remaining pips amount before MarginCall on current chart and Account generally; Display summary trade lot
                                    FREE
                                    Auto Fib MT4
                                    Part-time Day Trader
                                    5 (1)
                                    Clean, Accurate Fibonacci Levels — Always Ready When You Need Them. Auto Fib for MT4 keeps precise Fibonacci retracement levels on your chart at all times. It automatically detects the latest impulse move and instantly plots wick-to-wick Fibonacci levels with perfect accuracy. Need a clean chart? Show or hide all levels with a single click. Two Detection Modes (Selectable in Inputs): Auto Mode   — Automatically finds the latest valid trend leg and draws Fibonacci levels instantly. Manual Mode
                                    FREE
                                    Trendline indicator
                                    David Muriithi
                                    2 (1)
                                    Are you tired of drawing trendlines every time you're analyzing charts? Or perhaps you would like more consistency in your technical analysis. Then this is for you. This indicator will draw trend lines automatically when dropped on a chart. How it works Works similar to standard deviation channel found on mt4 and mt5. It has 2 parameters: 1. Starting Bar 2. Number of bars for calculation The   starting bar   is the bar which drawing of the trend lines will begin, while the   number of bars for c
                                    FREE
                                    OrderBlock TS Roman
                                    Vladislav Vlastovskii
                                    3.8 (5)
                                    Индикатор строит блоки заказов (БЗ) по торговой системе (ТС) Романа. Поиск блоков осуществляется одновременно на двух таймфремах: текущем и старшем (определяемым в настройках). Для оптимизации и игнорирования устаревших блоков в настройках задается ограничение количества дней в пределах которых осуществляется поиск блоков. Блоки строятся по правилам ТС состоящем из трех шагов: какую свечу вынесли (что?); какой свечой вынесли (чем?); правило отрисовки (как?).
                                    FREE
                                    The Four Pillars: Your All-in-One Trading Powerhouse! Tired of juggling multiple indicators and missing out on perfect entries? The Four Pillars is the ultimate solution, merging four proven market analysis tools into one powerful, easy-to-use indicator. Get crystal-clear, high-conviction Buy and Sell signals directly on your chart, filtered for maximum accuracy. Stop guessing and start trading with confidence! Key Advantages & Features Precision Signals, Zero Clutter: This indicator combine
                                    FREE
                                    ET1 for MT4
                                    Hui Qiu
                                    3.83 (6)
                                    ET1 for MT4 is new and completely free!! ET1 for MT4 v4.20 Updated!! Now use on XAUUSD(Gold)!! The success rate is more than 75% !!! important update: Merge ET9 's breakout strategy Warning!! You can use ET1 completely free, but we do not guarantee ET1 stability, It is recommended that the more powerful ET9 for MT4 version includes the ET1 strategy and guarantees complete and stable returns. The Best Expert Advisor  on   XAUUSD   any timeframes  ET9  for MT4 Updated v4.70 !!  https://www.mql5
                                    FREE
                                    This scanner shows the trend values of the well known indicator SuperTrend for up to 30 instruments and 8 time frames. You can get alerts via MT4, Email and Push-Notification as soon as the direction of the trend changes. This is the FREE version of the indicator: SuperTrend Scanner The free version works only on EURUSD and GBPUSD! Important Information How you can maximize the potential of the scanner, please read here: www.mql5.com/en/blogs/post/718074 With the following FREE indicator you c
                                    FREE
                                    Ppr PA
                                    Yury Emeliyanov
                                    4.5 (2)
                                    "Ppr PA" is a unique technical indicator created to identify "PPR" patterns on the currency charts of the MT4 trading platform. These patterns can indicate possible reversals or continuation of the trend, providing traders with valuable signals to enter the market. Features: Automatic PPR Detection:   The indicator automatically identifies and marks PPR patterns with arrows on the chart. Visual Signals:   Green and red arrows indicate the optimal points for buying and selling, respectively. Ar
                                    FREE
                                    Extremum Reverse Bar
                                    Yurij Izyumov
                                    2.8 (5)
                                    This indicator has been created for finding the probable reversal points of the symbol price. A small candlestick reversal pattern is used it its operation in conjunction with a filter of extremums. The indicator is not redrawn! If the extremum filter is disabled, the indicator shows all points that have a pattern. If the extremum filter is enabled, the condition works – if the history Previous bars 1 candles back contains higher candles and they are farther than the Previous bars 2 candle, such
                                    FREE
                                    Pivot Mean Oscillator
                                    Marco Calabrese
                                    4 (1)
                                    Pivot Mean Oscillator (PMO) is a unbounded zero-centered oscillator that provides a quick and normalized measure of divergence between two spreads. Detailed description of the mathematical formulation along with some comments and experiments can be found in this article .  Trading aspects This version of PMO is tuned on spreads relative to Close and Open price signals against their cumulative moving average (CMA). Positive PMO(m,n) values means that last (normalized) m Close prices are higher t
                                    FREE
                                    Signals and Alerts for Accelerator/Decelerator indicator based on these MQL5 posts: Accelerator Oscillator and Signals of the Indicator Accelerator Oscillator . Note : this tool is based on the code of Accelerator indicator developed by MetaQuotes Software Corp. Features The signals are triggered at   closing   of last bar/opening of a new bar; Any kind of alerts can be enabled: Dialog Box, Email message, SMS notifications for smartphones and tablets, and Sound alerts; Customizable arrows. By d
                                    FREE
                                    Line
                                    Andrea Fontanini
                                    free only until the end of the week The following indicator must be used and contextualized according to your trading methodologies. It provides excellent trading insights and identifies rejection zones on the drawn lines. Several parameters can be customized. The indicator will plot three levels above and below the opening price on D1, W1, and MN1. It will provide the daily ADR and display two additional daily sessions (EUROPE session and USA session). The colors of the various lines can be cu
                                    FREE
                                    ''Trendlines'' is an Indicator, that every Trader need and shows Trendline and  Support and resistance levels in all  Timeframe's. Also In 1-hour, 4-hour and daily time frames and Current timeframes, support, and resistance levels are specified and trend lines are drawn so that the trader can see all levels on a chart.   In   Properties   it is possible to turn off unnecessary Lines.  In ' Tendency indicator '' , as full package of Predictions that every Trader need, there  is also the Predict
                                    FREE
                                    This classic "old school" MAGIC MACD indicator gives you the cross of the parameters you set. Standart setting is (12,26,9) . The arrows give you a possible change of trend. Be careful and do not use this indicator as a single signal source. FREE version  Please feel free to check out our other REX indicator series. We do have other free indicators.     "OLD BUT GOLD"
                                    FREE
                                    Sm Ichimoku Scanner
                                    Steeve Christian Martol
                                    5 (5)
                                    Multi Time Frame Indicator acts as a Scanner based on the Ichimoku Trading System. The outcome is displayed on a board. This helps you to make "at a glance" a mental picture of the System without having to open the chart. Up to 10 Currencies can be watched. Scanned elements And Legend "KUMO Futur" - Green : The Kumo Futur is Bullish. "KUMO Futur" - Red : The Kumo Futur is Bearish. "PRICE Cross KJ" - Green : The Price is Above the Kijun Sen.  "PRICE Cross KJ" - Red : The Price is Below the Kijun

                                    FREE
                                    .....................................hi....................... ................for showing high s and low s and support and resistanses .....................we have a lot of ways............................... it can be helpful for finding trends , higher highs , higher lows , lower highs , lower lows .......................today i write on of thems.......................... ........................you can enter the number of last support and resistanses .........................and it will dra
                                    FREE
                                    EUR INDEX The Currency Index Project is ONE part of a thorough Forex study. Many people do not know the theoretical basis that drives currency exchange rates to move on the market. With this set of tools you will be able to have a more complete view of the entire market by analyzing not only the single currency of an exchange, but all the exchange rates that make up that currency by looking at a single window! The indicator faithfully represents the real index of a single currency present in a
                                    FREE
                                    Les acheteurs de ce produit ont également acheté
                                    Trend indicator AI
                                    Ramil Minniakhmetov
                                    5 (71)
                                    L'indicateur Trend Ai est un excellent outil qui améliorera l'analyse du marché d'un trader en combinant l'identification des tendances avec des points d'entrée exploitables et des alertes d'inversion. Cet indicateur permet aux utilisateurs de naviguer dans les complexités du marché forex avec confiance et précision Au-delà des signaux primaires, l'indicateur Trend Ai identifie les points d'entrée secondaires qui surviennent lors des retraits ou des retracements, permettant aux traders de capit
                                    M1 Sniper
                                    Oleg Rodin
                                    4.89 (18)
                                    M1 SNIPER est un système d'indicateurs de trading facile à utiliser. Il s'agit d'un indicateur à flèche conçu pour l'unité de temps M1. Cet indicateur peut être utilisé seul pour le scalping sur l'unité de temps M1 ou intégré à votre système de trading existant. Bien que conçu spécifiquement pour le trading sur l'unité de temps M1, ce système peut également être utilisé avec d'autres unités de temps. Initialement, j'avais conçu cette méthode pour le trading du XAUUSD et du BTCUSD. Cependant, je
                                    Game Changer est un indicateur de tendance révolutionnaire, conçu pour être utilisé sur tout instrument financier et transformer votre MetaTrader en un puissant analyseur de tendances. L'indicateur ne se redessine pas et est sans latence. Il fonctionne sur n'importe quelle unité de temps et facilite l'identification des tendances, signale les retournements potentiels, agit comme un stop suiveur et fournit des alertes en temps réel pour une réaction rapide du marché. Que vous soyez un trader expé
                                    Gann Made Easy
                                    Oleg Rodin
                                    4.82 (145)
                                    Gann Made Easy est un système de trading Forex professionnel et facile à utiliser qui est basé sur les meilleurs principes de trading en utilisant la théorie de mr. WD Gann. L'indicateur fournit des signaux d'ACHAT et de VENTE précis, y compris les niveaux Stop Loss et Take Profit. Vous pouvez échanger même en déplacement en utilisant les notifications PUSH. VEUILLEZ ME CONTACTER APRÈS L'ACHAT POUR OBTENIR DES CONSEILS DE TRADING, DES BONUS ET L'ASSISTANT EA GANN MADE EASY GRATUITEMENT! Vous ave
                                    Scalper Inside PRO
                                    Alexey Minkov
                                    4.74 (69)
                                    An exclusive indicator that utilizes an innovative algorithm to swiftly and accurately determine the market trend. The indicator automatically calculates opening, closing, and profit levels, providing detailed trading statistics. With these features, you can choose the most appropriate trading instrument for the current market conditions. Additionally, you can easily integrate your own arrow indicators into Scalper Inside Pro to quickly evaluate their statistics and profitability. Scalper Inside
                                    Day Trader Master est un système de trading complet pour les day traders. Le système se compose de deux indicateurs. Un indicateur est un signal fléché pour acheter et vendre. C'est l'indicateur de flèche que vous obtenez. Je vous fournirai le deuxième indicateur gratuitement. Le deuxième indicateur est un indicateur de tendance spécialement conçu pour être utilisé conjointement avec ces flèches. LES INDICATEURS NE RÉPÉTENT PAS ET NE TARDENT PAS! L'utilisation de ce système est très simple. Il v
                                    Entry Points Pro
                                    Yury Orlov
                                    4.61 (170)
                                    Indicateur supérieur pour MT4 fournissant des signaux précis pour entrer dans un trade sans repeindre ! Il peut être appliqué à tous les actifs financiers : forex, cryptocurrencies, métaux, actions, indices.  La version MT5 est ici Il fournira des signaux de trading assez précis et vous dira quand il est préférable d'ouvrir un trade et de le fermer. Regardez la vidéo (6:22) avec un exemple de traitement d'un seul signal qui a rapporté à l'indicateur ! La plupart des traders améliorent leurs
                                    SMC Easy Signal
                                    Mohamed Hassan
                                    4.69 (13)
                                    2 copies left at $65, next price is $120 SMC Easy Signal was built to remove the confusion around the smart money concept by turning structural shifts like BOS (Break of Structure) and CHoCH (Change of Character) into simple buy and sell trading signals. It simplifies market structure trading by automatically identifying breakouts and reversals as they happen, allowing traders to focus on execution rather than analysis. Whether the market is continuing its trend or preparing to reverse, the i
                                    Trend Screener
                                    STE S.S.COMPANY
                                    4.79 (95)
                                    Indicateur de tendance, solution unique révolutionnaire pour le trading et le filtrage des tendances avec toutes les fonctionnalités de tendance importantes intégrées dans un seul outil ! Il s'agit d'un indicateur multi-période et multi-devises 100 % non repeint qui peut être utilisé sur tous les symboles/instruments : forex, matières premières, crypto-monnaies, indices et actions. OFFRE À DURÉE LIMITÉE : L'indicateur Support and Resistance Screener est disponible pour seulement 50 $ et à vie. (
                                    Currency Strength Wizard est un indicateur très puissant qui vous offre une solution tout-en-un pour un trading réussi. L'indicateur calcule la puissance de telle ou telle paire de devises en utilisant les données de toutes les devises sur plusieurs périodes. Ces données sont représentées sous la forme d'un indice de devise facile à utiliser et de lignes électriques de devise que vous pouvez utiliser pour voir la puissance de telle ou telle devise. Tout ce dont vous avez besoin est d'attacher l'
                                    Cet indicateur est un indicateur d'analyse automatique des vagues, parfait pour le trading pratique ! Cas... Remarque :   je n'ai pas l'habitude d'utiliser des noms occidentaux pour l'évaluation des vagues. En raison de l'influence de la convention de dénomination de Tang Lun (Tang Zhong Shuo Zen), j'ai nommé la vague de base comme   un stylo   et la bande d'onde secondaire comme   un segment   . en même temps, le segment a la direction de la tendance.Le   segment de tendance principal   est no
                                    Actuellement 20% de réduction ! La meilleure solution pour tout débutant ou trader expert ! Ce logiciel de tableau de bord fonctionne sur 28 paires de devises. Il est basé sur 2 de nos principaux indicateurs (Advanced Currency Strength 28 et Advanced Currency Impulse). Il donne un excellent aperçu de l'ensemble du marché Forex. Il montre les valeurs de l'Advanced Currency Strength, la vitesse de mouvement des devises et les signaux pour 28 paires de devises dans tous les (9) délais. Imaginez
                                    Advanced Supply Demand
                                    Bernhard Schweigert
                                    4.91 (296)
                                    CURRENTLY 26% OFF !! Best Solution for any Newbie or Expert Trader! This indicator is a unique, high quality and affordable trading tool because we have incorporated a number of proprietary features and a new formula. With this update, you will be able to show double timeframe zones. You will not only be able to show a higher TF but to show both, the chart TF, PLUS the higher TF: SHOWING NESTED ZONES. All Supply Demand traders will love it. :) Important Information Revealed Maximize the potentia
                                    Currency Strength Exotics
                                    Bernhard Schweigert
                                    4.88 (33)
                                    ACTUELLEMENT 20% DE RÉDUCTION ! La meilleure solution pour tout débutant ou trader expert ! Cet indicateur est spécialisé pour montrer la force de la devise pour tous les symboles comme les paires exotiques, les matières premières, les indices ou les contrats à terme. C'est le premier de son genre, n'importe quel symbole peut être ajouté à la 9ème ligne pour montrer la force réelle de la devise de l'or, l'argent, le pétrole, DAX, US30, MXN, TRY, CNH etc. Il s'agit d'un outil de trading unique
                                    L'indicateur « Dynamic Scalper System » est conçu pour la méthode de scalping, permettant de trader au sein des vagues de tendance. Testé sur les principales paires de devises et l'or, il est compatible avec d'autres instruments de trading. Fournit des signaux pour l'ouverture de positions à court terme le long de la tendance, avec un support supplémentaire pour les fluctuations de prix. Principe de l'indicateur : De grandes flèches déterminent la direction de la tendance. Un algorithme de gén
                                    FX Volume
                                    Daniel Stein
                                    4.61 (36)
                                    FX Volume : Découvrez le Sentiment du Marché tel que perçu par un Courtier Présentation Rapide Vous souhaitez faire passer votre approche de trading au niveau supérieur ? FX Volume vous fournit, en temps réel, des informations sur la manière dont les traders particuliers et les courtiers sont positionnés—bien avant la publication de rapports retardés comme le COT. Que vous visiez des gains réguliers ou recherchiez simplement un avantage plus solide sur les marchés, FX Volume vous aide à repére
                                    M1 Arrow
                                    Oleg Rodin
                                    5 (19)
                                    Une stratégie intraday basée sur deux principes fondamentaux du marché. L'algorithme est basé sur l'analyse des volumes et des vagues de prix à l'aide de filtres supplémentaires. L'algorithme intelligent de l'indicateur ne donne un signal que lorsque deux facteurs de marché se combinent en un seul. L'indicateur calcule les vagues d'une certaine plage sur le graphique M1 en utilisant les données de la période la plus élevée. Et pour confirmer la vague, l'indicateur utilise une analyse en volume.
                                    KT Trend Trading Suite MT4
                                    KEENBASE SOFTWARE SOLUTIONS
                                    KT Trend Trading Suite est un indicateur multifonction qui combine une stratégie de suivi de tendance avec plusieurs points de cassure servant de signaux d’entrée. Une fois qu’une nouvelle tendance est établie, l’indicateur fournit plusieurs opportunités d’entrée permettant de suivre la tendance efficacement. Un seuil de repli est utilisé pour éviter les points d’entrée moins significatifs. Version MT5 disponible ici  https://www.mql5.com/en/market/product/46270 Fonctionnalités Combine plus
                                    The Super Arrow Indicator provides non-repainting buy and sell signals with exceptional accuracy. Key Features No repainting – confirmed signals remain fixed Clear visual arrows: green for buy, red for sell Real-time alerts via pop-up, sound, and optional email Clean chart view with no unnecessary clutter Works on all markets: Forex, gold, oil, indices, crypto Adjustable Parameters TimeFrame Default: "current time frame" Function: Sets the time frame for indicator calculation Options: Can be set
                                    Dynamic Forex28 Navigator
                                    Bernhard Schweigert
                                    4.43 (7)
                                    Dynamic Forex28 Navigator - L'outil de trading Forex de nouvelle génération. ACTUELLEMENT 49 % DE RÉDUCTION. Dynamic Forex28 Navigator est l'évolution de nos indicateurs populaires de longue date, combinant la puissance de trois en un : Advanced Currency Strength28 Indicator (695 avis) + Advanced Currency IMPULSE avec ALERT (520 avis) + CS28 Combo Signals (Bonus). Détails sur l'indicateur https://www.mql5.com/en/blogs/post/758844 Qu'offre l'indicateur de force de nouvelle génération ? Tout
                                    Auto Optimized RSI
                                    Davit Beridze
                                    5 (2)
                                    Auto Optimized RSI est un indicateur fléché intelligent et facile à utiliser, conçu pour fournir des signaux d’achat et de vente précis. Il utilise des simulations de trading sur des données historiques pour déterminer automatiquement les niveaux RSI les plus efficaces pour chaque instrument et période. Cet indicateur peut être utilisé comme un système de trading autonome ou intégré dans votre stratégie existante, et il est particulièrement utile pour les traders à court terme. Contrairement aux
                                    Market Structure Break Out
                                    Ashkan Hazegh Nikrou
                                    5 (7)
                                    Le Market Structure Break Out (MSB) est un outil avancé conçu pour MT4 et MT5 , permettant aux traders d’analyser les mouvements du marché sous forme de structure. Il détecte et affiche des signaux de trading puissants à l’aide de flèches et alertes , aussi bien dans le sens de la tendance qu’ en sens inverse . L’une de ses fonctionnalités majeures est le tracé de zones d’offre et de demande continues . De plus, la fonction de backtest en direct permet aux traders de visualiser directement sur
                                    Unlock hidden profits: accurate divergence trading for all markets Tricky to find and scarce in frequency, divergences are one of the most reliable trading scenarios. This indicator finds and scans for regular and hidden divergences automatically using your favourite oscillator. [ Installation Guide | Update Guide | Troubleshooting | FAQ | All Products ] Easy to trade Finds regular and hidden divergences Supports many well known oscillators Implements trading signals based on breakouts Display
                                    Special offer : ALL TOOLS , just $35 each! New tools   will be   $30   for the   first week   or the   first 3 purchases !  Trading Tools Channel on MQL5 : Join my MQL5 channel to update the latest news from me L'indicateur Volumetric Order Blocks Multi Timeframe est un outil puissant conçu pour les traders cherchant à obtenir des informations approfondies sur le comportement du marché en identifiant les zones clés de prix où les participants importants accumulent des ordres. Ces zones, connues
                                    Offre spéciale  : ALL TOOLS , seulement $35 chacun ! Nouveaux outils   à   $30   pendant la   première semaine   ou les   3 premiers achats  !  Trading Tools Channel on MQL5  : Rejoignez mon canal MQL5 pour recevoir les dernières nouvelles Volumatic Support/Resistance Levels Scanner est un indicateur de support/résistance qui ajoute un contexte de volume à la structure des prix. En montrant comment l’activité de trading se concentre autour des pivots récents, il aide les utilisateurs à voir où
                                    System Trend Pro
                                    Aleksandr Makarov
                                    5 (2)
                                    System Trend Pro - This is the best trend trading indicator!!! The indicator no repaint!!!  The indicator has   MTF   mode, which adds confidence to trading on the trend (   no repaint   ). How to trade? Everything is very simple, we wait for the first signal (big arrow), then wait for the second signal (small arrow) and enter the market in the direction of the arrow. (See screens 1 and 2.) Exit on the opposite signal or take 20-30 pips, close half of it, and keep the rest until the opposite
                                    Offre spéciale : TOUS LES OUTILS , seulement 35 $ chacun ! Les nouveaux outils   seront à   30 $   pendant la   première semaine   ou pour   les 3 premiers achats !  Chaîne Trading Tools sur MQL5  : rejoignez ma chaîne MQL5 pour recevoir mes dernières actualités Stochastic Z-Score est un oscillateur de momentum qui normalise le prix avec un Z-Score, le borne via une logique stochastique et le lisse avec HMA, tandis que ALMA apporte un contexte long terme. Éléments optionnels : histogramme, band
                                    Gold Venamax MT4
                                    Sergei Linskii
                                    5 (1)
                                    Gold Venamax   - c'est le meilleur indicateur technique boursier. L'algorithme de l'indicateur analyse l'évolution des prix d'un actif et reflète la volatilité et les zones d'entrée potentielles. Caractéristiques de l'indicateur: Il s'agit d'un super indicateur avec Magic et deux blocs de flèches de tendance pour un trading confortable et rentable. Le bouton rouge pour changer de bloc est affiché sur le graphique. La magie est définie dans les paramètres de l'indicateur, afin que vous puissiez
                                    Blahtech Supply Demand
                                    Blahtech Limited
                                    4.58 (36)
                                    Was: $299  Now: $149   Supply Demand uses previous price action to identify potential imbalances between buyers and sellers. The key is to identify the better odds zones, not just the untouched ones. Blahtech Supply Demand indicator delivers functionality previously unavailable on any trading platform. This 4-in-1 indicator not only highlights the higher probability zones using a multi-criteria strength engine, but also combines it with multi-timeframe trend analysis, previously confirmed swings
                                    Support Resistance screnner
                                    STE S.S.COMPANY
                                    4.95 (37)
                                    Support And Resistance Screener est dans un indicateur de niveau pour MetaTrader qui fournit plusieurs outils à l'intérieur d'un indicateur. Les outils disponibles sont : 1. Filtre de structure de marché. 2. Zone de repli haussier. 3. Zone de recul baissier. 4. Points pivots quotidiens 5. points pivots hebdomadaires 6. Points pivots mensuels 7. Support et résistance forts basés sur le modèle harmonique et le volume. 8. Zones au niveau de la banque. OFFRE D'UNE DURÉE LIMITÉE : L'indicateur de sup
                                    Plus de l'auteur
                                    PointZero
                                    Juergen Thielen
                                    5 (1)
                                    Concept Market arranges in Time upcoming Phases according to the present Results of its Interest. Directing Modulations are an Interaction of immanent Periods, which show in Reference to Time cyclic Activity and to Price leveling Activity. PointZero is a projecting Price Mask of this Concept of Time and Price and categorizing developed Price Movements related to their own Range: how far moved ? indicating their Status by marking special Events: when which Action ? setting the Situation in a fun
                                    FREE
                                    Filtrer:
                                    Jamie Daniel Thompson
                                    163
                                    Jamie Daniel Thompson 2023.06.22 14:42 
                                     

                                    Extremely useful and incredible tool! I don't understand how this doesn't have 5 star reviews yet! It has totally changed the accuracy of my entries! Thanks to the author!

                                    Répondre à l'avis