Zhi Xian Hou / Vendedor
Productos publicados

Indicator Introduction: The indicator comes from network ,It is more stable relative to RSI or CCI. You can set the indicator to send emails/notifications/alerts when the previous bar has an up or down arrow, you can specify the text of emails by inputing string into the parameter box of "UpMessages/DownMessages". It can be used to analyze market trend and design new expert that is based on trend. If the indicator below the axis ,this is a buy zone. The trend indicator is suitable for M1 and ab
FREE

Indicator introduction: The indicator draws wave lines and histograms, It has small price lag, and the signal will not drift. The indicator can send emails, alerts and notifications to you when previous k line has an up arrow and it is under the histogram sections or it has a down arrow. you can choose whether or not to send the two kind of alerts, the alerts repetition times can also be changed. If the indicator appears red and green histograms, this is a buy zone. It can be used to analyze mar
FREE

Introducción del indicador:
El indicador dibuja la línea de tendencia y el histograma, tiene un pequeño retraso en el precio y no tiene funciones futuras, las señales no se desviarán. Cuando el mercado está bajo oscilaciones entre áreas, si el indicador aparece histograma rojo y verde, esta es una zona de precio bajo, si el indicador aparece histograma magenta y amarillo, esta es una zona de precio alto. También se puede utilizar para analizar la tendencia del mercado según la zona de precio a
FREE

Indicator introduction:
The indicator is calculated by volumes and prices, It is a single side indicator, only has up arrow signals. It is better to use it in conjunction with other trend indicators, and you need to find the most efficient time to use it in order to acquire a high winning probability. The indicator can send emails, alerts and notifications to you when the indicator before k line has an up arrow. The indicator's parameters can be changed, including the computation period of the
FREE

Indicador Introducción El indicador está diseñado de acuerdo con fórmulas de promedio móvil, que es más estable y tiene menos retraso que RSI o CCI. El indicador tiene tres valores de indicador, el período de promedio móvil y los colores de la línea se pueden cambiar manualmente. ¿Qué puede aportarte este indicador? Señales de entrada precisas: el indicador dibuja señales de flecha hacia arriba y hacia abajo. Análisis de tendencia multiperíodo: al cargar este indicador en un gráfico de marco de

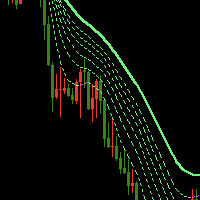
The Waterfall Trend Indicator MT5 uses line regression algorithm, using "Waterfall" in its name is in that it like waterfall when there is a strong down market trend. The indicator draws seven lines, one of which is sold line, others are dash line, the sold line is more stable. Indicator introduction The indicator can effectively filter price noise since it is calculated with line regression. It can be used to analyze market trend and design new expert that is based on trend. When the trend lin

Advanced Trader MT5 is a fully automated trading robot developed by using custom indicator "Trend for MT5", which can be found here . The expert has been tested on AUDNZD、NZDCAD、AUDCAD and USDCHF using historical data of many years, you can also test it using real ticks history data on MT5 backtest platform. Even if you don't want to 100% automatically trade by it, you can still use it as a good tool for trading, there is parameters for you to control the EA trading and use it as a trade assist

GOLD EA MT5 es un robot comercial completamente automatizado, que se desarrolla utilizando el indicador "Trend for MT5". Se basa en el sistema de red neuronal + cuadrícula, selecciona oportunidades comerciales con alta probabilidad de ganancias y bajo riesgo. El depósito inicial mínimo es de 250 USD por 0,01 lotes iniciales, cada posición tiene un stop loss oculto. EA tiene buenos resultados en XAUUSD y la reducción máxima es relativamente baja. Puede usar una prueba retrospectiva de precio abi

Indicator introduction: A channel and trend line indicator, which is a good tool for manual trading, and also can be used for creating new EAs, without drifting or repainting. It applies to any timeframes and any symbols. The work of the indicator is shown in the screenshots. For any novice and programming trading friend, you can write the signal into the EA to play freely, buffer 0 corresponds to the bold trend line, buffer 4 and 5 respectively corresponds to the channel's upper and lower f