Young Ho Seo / Perfil
- Información
|
11+ años
experiencia
|
62
productos
|
1193
versiones demo
|
|
4
trabajos
|
0
señales
|
0
suscriptores
|
Harmonic Pattern Indicator - Repainting + Japanese Candlestick Pattern Scanner + Automatic Channel + Many more
https://www.mql5.com/en/market/product/4488
https://www.mql5.com/en/market/product/4475
https://algotrading-investment.com/portfolio-item/harmonic-pattern-plus/
Non Repainting and Non Lagging Harmonic Pattern Indicator – Customizable Harmonic + Japanese Candlestic Pattern Scanner + Advanced Channel + Many more
https://www.mql5.com/en/market/product/41993
https://www.mql5.com/en/market/product/41992
https://algotrading-investment.com/portfolio-item/profitable-pattern-scanner/
Supply Demand Indicator – Multiple Timeframe Scanning Added + Non Repainting + Professional Indicator
https://www.mql5.com/en/market/product/40076
https://www.mql5.com/en/market/product/40075
https://algotrading-investment.com/portfolio-item/ace-supply-demand-zone/
Momentum Indicator – Path to Volume Spread Analysis
https://www.mql5.com/en/market/product/30641
https://www.mql5.com/en/market/product/30621
https://algotrading-investment.com/portfolio-item/excessive-momentum-indicator/
Elliott Wave Indicator for the Power User
https://www.mql5.com/en/market/product/16479
https://www.mql5.com/en/market/product/16472
https://algotrading-investment.com/portfolio-item/elliott-wave-trend/
Forex Prediction - Turn Support and Resistance to the Advanced Strategy
https://www.mql5.com/en/market/product/49170
https://www.mql5.com/en/market/product/49169
https://algotrading-investment.com/portfolio-item/fractal-pattern-scanner/
MetaTrader 4 and MetaTrader 5 Product Page: https://www.mql5.com/en/users/financeengineer/seller#products
Free Forex Prediction with Fibonacci Analysis: https://algotrading-investment.com/2020/10/23/forex-prediction-with-fibonacci-analysis/
Free Harmonic Pattern Signal: https://algotrading-investment.com/2020/12/17/harmonic-pattern-signal-for-forex-market/
============================================================================================================================
Here are the trading education books. We recommend reading these books if you are a trader or investor in Forex and Stock market. In the list below, we put the easy to read book on top. Try to read the easy to read book first and try to read the harder book later to improve your trading and investment.
First Link = amazon.com, Second Link = Google Play Books, Third Link = algotrading-investment.com, Fourth Link = Google Books
Technical Analysis in Forex and Stock Market (Supply Demand Analysis and Support Resistance)
https://www.amazon.com/dp/B09L55ZK4Z
https://play.google.com/store/books/details?id=pHlMEAAAQBAJ
https://algotrading-investment.com/portfolio-item/technical-analysis-in-forex-and-stock-market/
https://books.google.co.kr/books/about?id=pHlMEAAAQBAJ
Science Of Support, Resistance, Fibonacci Analysis, Harmonic Pattern, Elliott Wave and X3 Chart Pattern (In Forex and Stock Market Trading)
https://www.amazon.com/dp/B0993WZGZD
https://play.google.com/store/books/details?id=MME3EAAAQBAJ
https://algotrading-investment.com/portfolio-item/science-of-support-resistance-fibonacci-analysis-harmonic-pattern/
https://books.google.co.kr/books/about?id=MME3EAAAQBAJ
Profitable Chart Patterns in Forex and Stock Market (Fibonacci Analysis, Harmonic Pattern, Elliott Wave, and X3 Chart Pattern)
https://www.amazon.com/dp/B0B2KZH87K
https://play.google.com/store/books/details?id=7KrQDwAAQBAJ
https://algotrading-investment.com/portfolio-item/profitable-chart-patterns-in-forex-and-stock-market/
https://books.google.com/books/about?id=7KrQDwAAQBAJ
Guide to Precision Harmonic Pattern Trading (Mastering Turning Point Strategy for Financial Trading)
https://www.amazon.com/dp/B01MRI5LY6
https://play.google.com/store/books/details?id=8SbMDwAAQBAJ
http://algotrading-investment.com/portfolio-item/guide-precision-harmonic-pattern-trading/
https://books.google.com/books/about?id=8SbMDwAAQBAJ
Scientific Guide to Price Action and Pattern Trading (Wisdom of Trend, Cycle, and Fractal Wave)
https://www.amazon.com/dp/B073T3ZMBR
https://play.google.com/store/books/details?id=5prUDwAAQBAJ
https://algotrading-investment.com/portfolio-item/scientific-guide-to-price-action-and-pattern-trading/
https://books.google.com/books/about?id=5prUDwAAQBAJ
Predicting Forex and Stock Market with Fractal Pattern: Science of Price and Time
https://www.amazon.com/dp/B086YKM8BW
https://play.google.com/store/books/details?id=VJjiDwAAQBAJ
https://algotrading-investment.com/portfolio-item/predicting-forex-and-stock-market-with-fractal-pattern/
https://books.google.com/books/about?id=VJjiDwAAQBAJ
Trading Education Book 1 in Korean (Apple, Google Play Book, Google Book, Scribd, Kobo)
https://books.apple.com/us/book/id1565534211
https://play.google.com/store/books/details?id=HTgqEAAAQBAJ
https://books.google.co.kr/books/about?id=HTgqEAAAQBAJ
https://www.scribd.com/book/505583892
https://www.kobo.com/ww/en/ebook/8J-Eg58EDzKwlpUmADdp2g
Trading Education Book 2 in Korean (Apple, Google Play Book, Google Book, Scribd, Kobo)
https://books.apple.com/us/book/id1597112108
https://play.google.com/store/books/details?id=shRQEAAAQBAJ
https://books.google.co.kr/books/about?id=shRQEAAAQBAJ
https://www.scribd.com/book/542068528
https://www.kobo.com/ww/en/ebook/X8SmJdYCtDasOfQ1LQpCtg
About Young Ho Seo
Young Ho Seo is an Engineer, Financial Trader, and Quantitative Developer, working on Trading Science and Investment Engineering since 2011. He is the creator of many technical indicators, price patterns and trading strategies used in the financial market. He is also teaching the trading practice on how to use the Supply Demand Analysis, Support, Resistance, Trend line, Fibonacci Analysis, Harmonic Pattern, Elliott Wave Theory, Chart Patterns, and Probability for Forex and Stock Market. His works include developing scientific trading principle and mathematical algorithm in the work of Benjamin Graham, Everette S. Gardner, Benoit Mandelbrot, Ralph Nelson Elliott, Harold M. Gartley, Richard Shabacker, William Delbert Gann, Richard Wyckoff and Richard Dennis. You can find his dedicated works on www.algotrading-investment.com . His life mission is to connect financial traders and scientific community for better understanding of this world and crowd behaviour in the financial market. He wrote many books and articles, which are helpful for understanding the technology and application behind technical analysis, statistics, time series forecasting, fractal science, econometrics, and artificial intelligence in the financial market.
If you are interested in our software and training, just visit our main website: www.algotrading-investment.com
Young Ho Seo
EURUSD Market Outlook
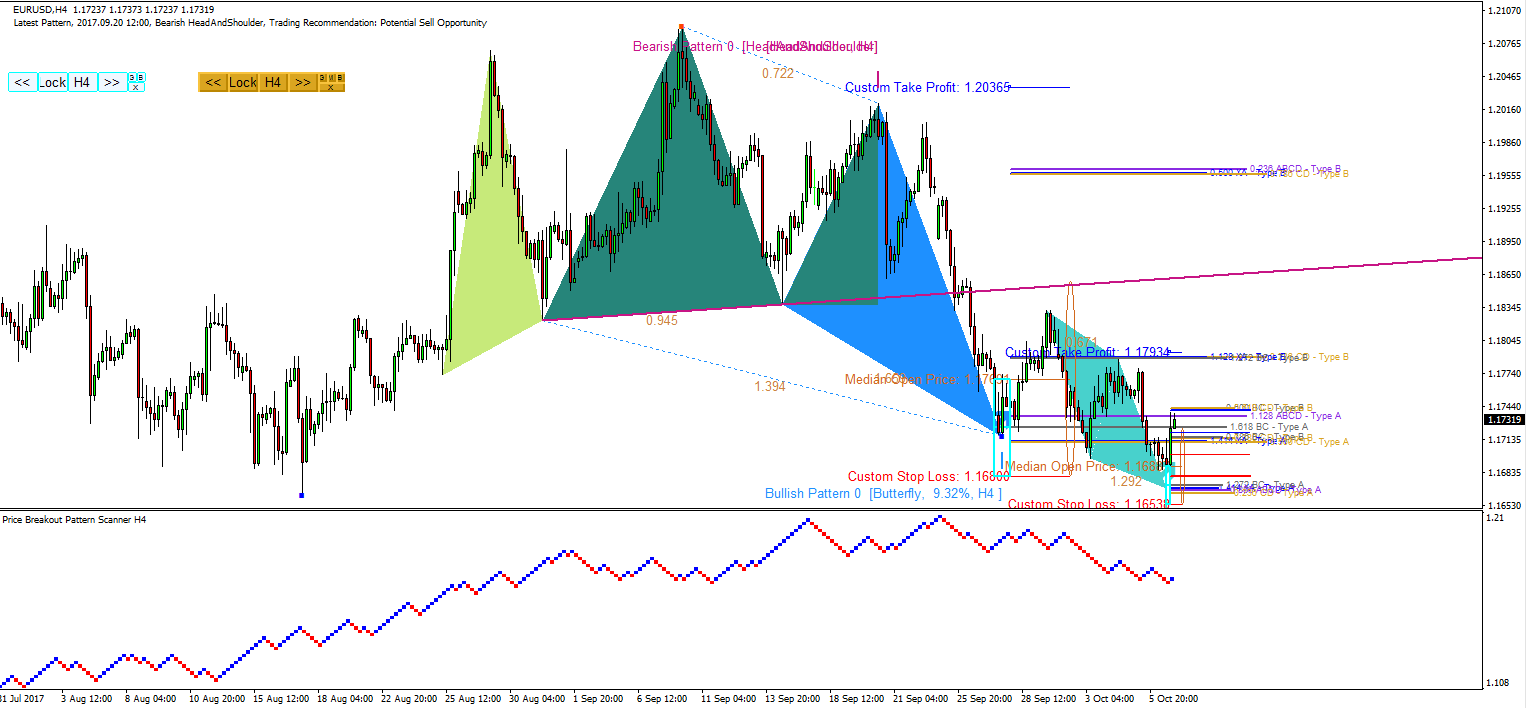
EURUSD accomplished with another bearish pressure last week. However, it was milder than the previous one. Currently EURUSD nearly made its complete head and shoulder pattern breaking nearly 200 pips from its neckline. Before the end of the market close, we had an ABCD pattern which was coincided with the corrective phase of EURUSD.
Looking for powerful trading system and strategy, do not miss to visit our website:
http://algotrading-investment.com/
https://www.mql5.com/en/users/financeengineer/seller#products

Young Ho Seo

Making your income with our Affiliate Program
With Algo Trading & Investment, you can generate stable but easy income by joining our ATI Affiliate Program. To start to generate your income with us, all you need is good internet connection and your own computer. That is all. So what are you exactly earning from us? You can earn up to 30% of the referral commission on our products. Below is the referral commission table summarizing your payment structure from us.
Algotrading-Investment-Affiliate Commission Table
You can be ready to receive the payments in less than 10 minutes by following the few steps below. If anything is unclear to join our affiliate program, then do not hesitate to contact us @ sales@algotrading-investment.com.
For more information on our affiliate Program, you can visit following links.
http://algotrading-investment.com/affiliate-membership/

Young Ho Seo
Introduction to Peak Trough Analysis for Your Trading
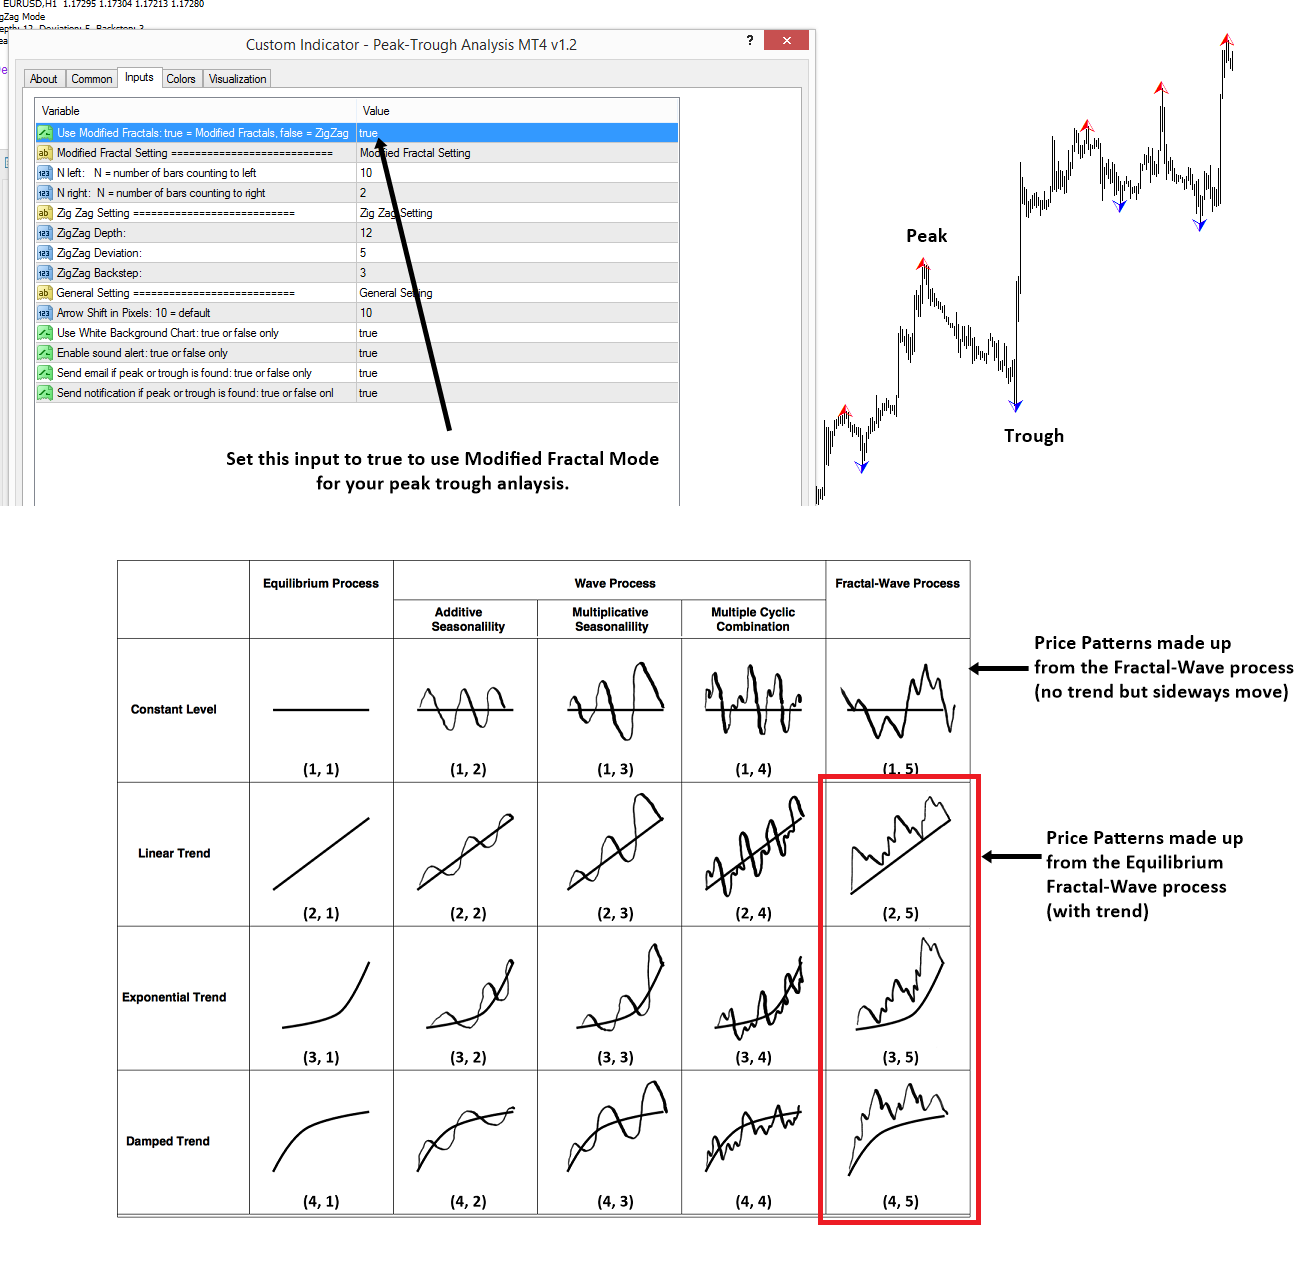
After we have released the free Peak Trough Analysis tool, we have many response from traders about their usefulness for their trading. Yes, that is exactly why we developed it. Although it is free, it can be powerful for your trading. It was not merely part of engineering plan but it was developed in seeking the coherent tool to discover the nature of the financial market dynamics. We are not clamming that we have developed the ZigZag or fractals indicators. However, we are saying we provide the good conceptual connection between the peak trough analysis and how to reveal the structure of the financial market dynamics. Not just intuitive manner but we have the formulated logical and reproducible ways for your trading. You can use the peak trough analysis tool without much explanation since they are very simple and easy to use.
However, if you really want to digger deeper and to have more performance with the peak trough analysis, then you can look into our E book: Price Action and Pattern Trading Course: Theory to Practice with over 85 years of Evidence (Available in Amazon.com)
We shows more comprehensive explanation and usage in the peak-trough analysis in this book. At the same time, in our website, the peak trough analysis is the most basic trading tool you can use. If you need more sophisticated but automated tools for your trading, then you can visit our website. You will find much more powerful trading system than the peak trough analysis indicator. As we have mentioned, the peak trough analysis indicator is the most basic one you can use among our products.
http://algotrading-investment.com
https://www.mql5.com/en/users/financeengineer/seller#products
Here are the download links for
Download link for MT4:
https://www.mql5.com/en/market/product/4859
Download link for MT4:
https://www.mql5.com/en/market/product/22420
Download link from Algotrading-Investment.com:
http://algotrading-investment.com/portfolio-item/peak-trough-analysis-tool/

Young Ho Seo
Multiple Timeframe Pattern Analysis vs Multiple Timeframe Pattern Detection
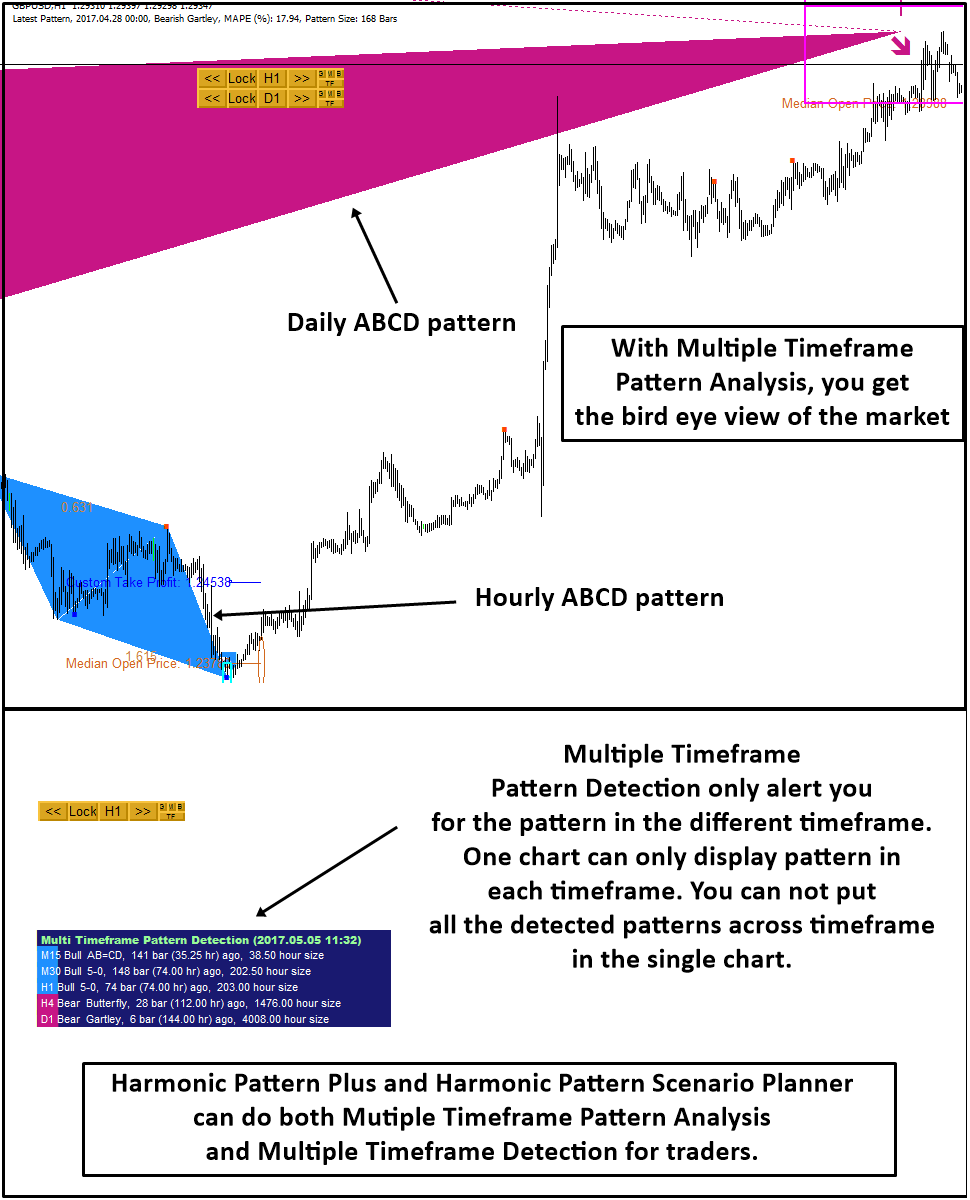
Just to help some traders to clarify these two concepts, we post this article. Multiple Timeframe Pattern Analysis and Multiple Timeframe Pattern Detection seems pretty similar concept. But there are some important difference too.
Multiple Timeframe Pattern Analysis means that you are detecting patterns from another timeframe then you put the detected patterns all in the same chart to give you the bird eye view of the market for your trading.
Multiple Timeframe Pattern Detection is just a process of detecting the patterns across different timeframe. One chart can only display the patterns detected from each time frame. You can not put all the patterns in one signal chart to have a bird eye view.
Which way is preferred for you, with our Harmonic Pattern Plus and Harmonic Pattern Scenario planner, you can have both Multiple timeframe Pattern Analysis and Multiple Timeframe pattern detection. Also our Price Breakout Pattern Scanner support for Multiple Timeframe pattern analysis too for now.
See the screenshot below for better understanding.
Links below are for the harmonic Pattern Plus and Harmonic Pattern Scenario planner from mql5.com and algotrading-investment.com.
https://www.mql5.com/en/market/product/4488
https://www.mql5.com/en/market/product/4475
https://www.mql5.com/en/market/product/6240
https://www.mql5.com/en/market/product/6101
http://algotrading-investment.com/portfolio-item/harmonic-pattern-plus/
http://algotrading-investment.com/portfolio-item/harmonic-pattern-scenario-planner/

Young Ho Seo
GBPUSD Market Outlook
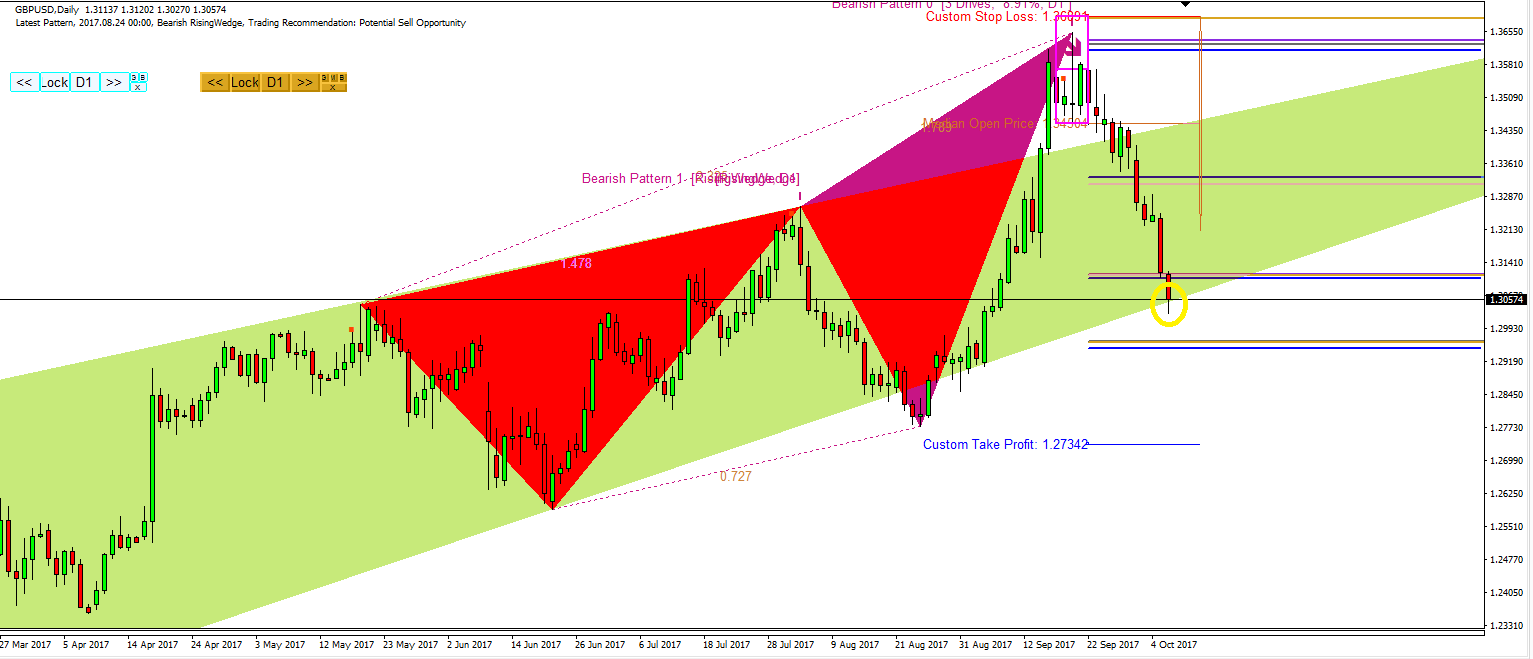
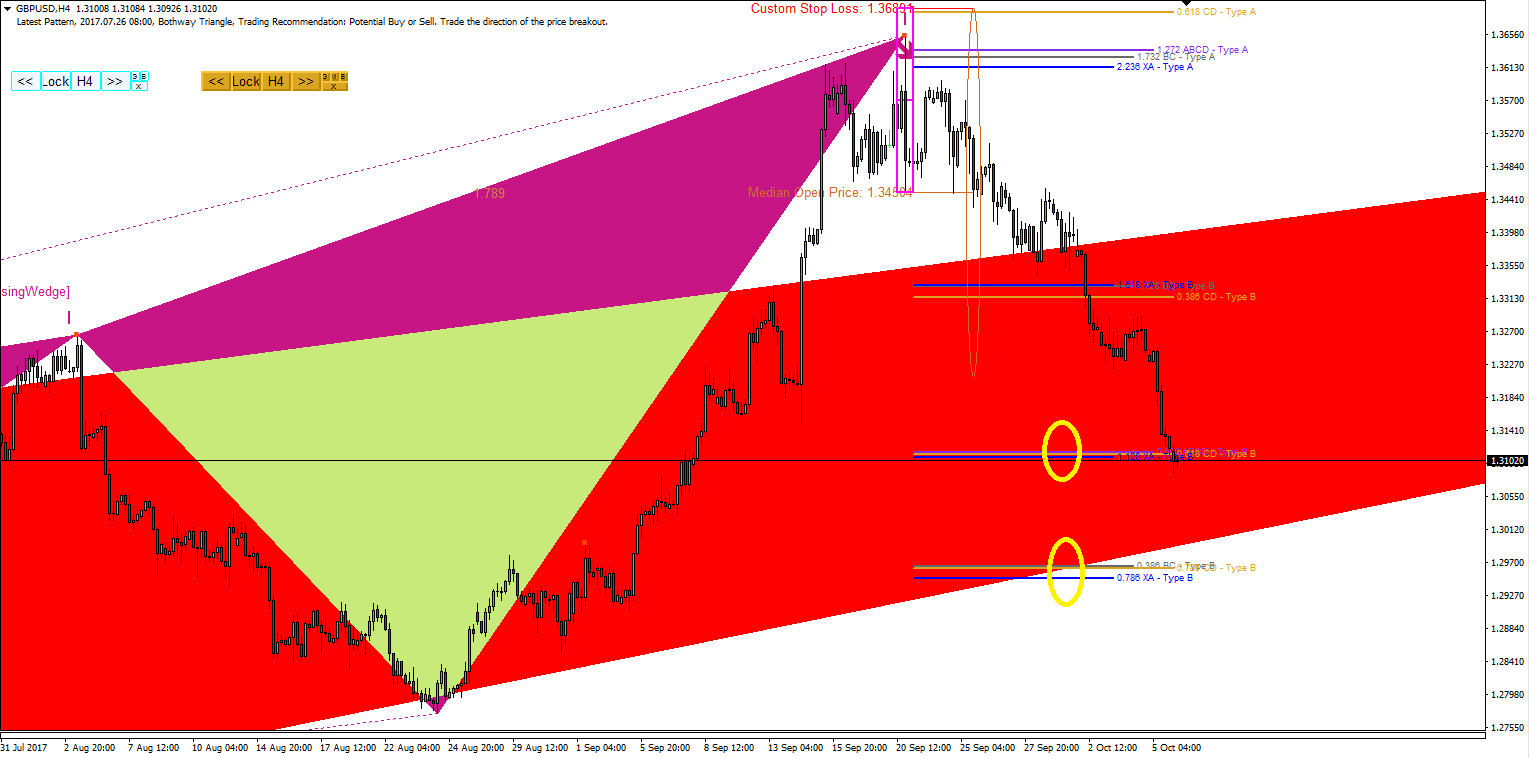
GBPUSD made another penetration on the PRZ Type B levels and finally hit the wall of the rising wedge pattern for resting for a while.
http://algotrading-investment.com/
https://www.mql5.com/en/users/financeengineer/seller#products
GBPUSD made another penetration on the PRZ Type B levels and finally hit the wall of the rising wedge pattern for resting for a while.
http://algotrading-investment.com/
https://www.mql5.com/en/users/financeengineer/seller#products

Young Ho Seo
GBPUSD Market Outlook
In regards to our last GBPUSD analysis, GBPUSD hit the PRZ Type B levels. Nearly 200 pips down in 2 days.
http://algotrading-investment.com/
https://www.mql5.com/en/users/financeengineer/seller#products
In regards to our last GBPUSD analysis, GBPUSD hit the PRZ Type B levels. Nearly 200 pips down in 2 days.
http://algotrading-investment.com/
https://www.mql5.com/en/users/financeengineer/seller#products

Young Ho Seo
The Cluster of Potential Reversal Zone (PRZ) for Harmonic Pattern Plus and Harmonic Pattern Scenario Planner
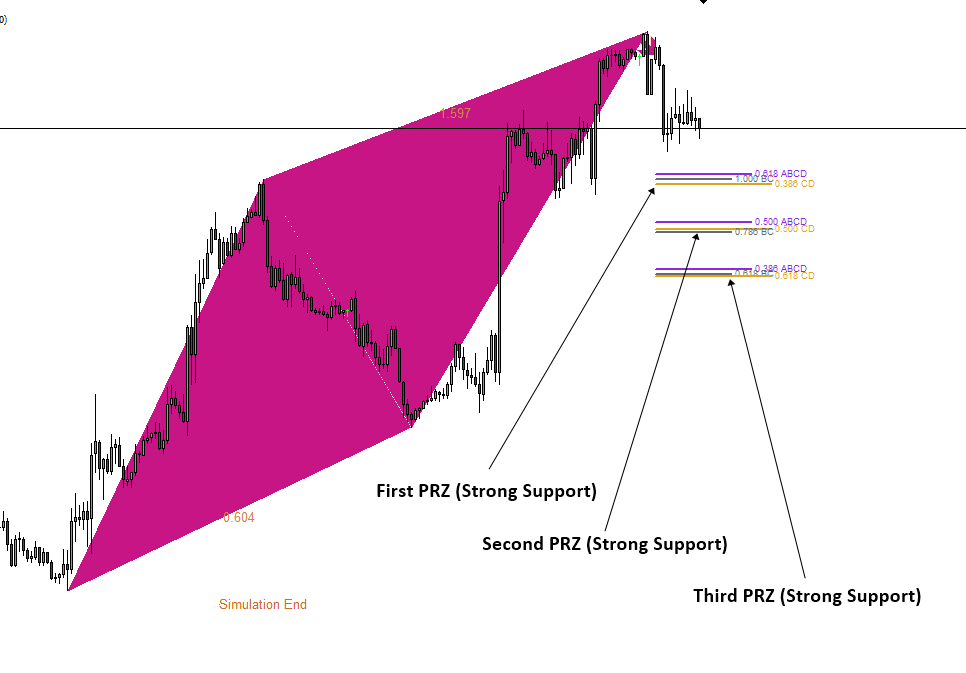
The cluster of Potential Reversal Zone (PRZ) is an area where 3 or more Fibonacci retracement levels converges together. (Sometime, one might use 2 Fibonacci retracement levels only. There is no absolute criteria for this.) When several layers of Fibonacci level are stacked up near to each other, this area should be treated as very strong support and resistance. Using classic definition of support and resistance, this condensed area (i.e. PRZ) can act as highly probable trend reversal area or as highly probable breakout area. For example, in the screenshot below shows 3 strong support levels derived from ABCD pattern. More than often, these strong support levels are where high trading volumes appear. Understanding this basic ideas, you can use PRZ for many different purpose in your art of Harmonic Pattern trading. PRZ can be used to confirm the last point D in your harmonic Pattern. Also this PRZ can be used to place your stop loss or trail your stops or take profit targets.
To visit our website, follow the links below:
http://algotrading-investment.com
https://www.mql5.com/en/users/financeengineer/seller#products

Young Ho Seo
Users with Apple Mac or Linux based Operating System
Users with Window OS, from Window 7 to Window X, can ignore this part. If you are using Apple Mac based OS or Linux based OS or other OS, then you might use some window emulator to run MetaTrader in your Computer. We found some Mac users are using our products without any problem. However, each user can have a specific Operating System configuration which is different from other users. So your Mac Computer are not necessarily able to run our products (or our app) because other Mac Users can run our products without any problem. Although this is not the absolutely guarantee, there is a simple way to test if you can run our products in your Computer or not. Here are the 3 steps:
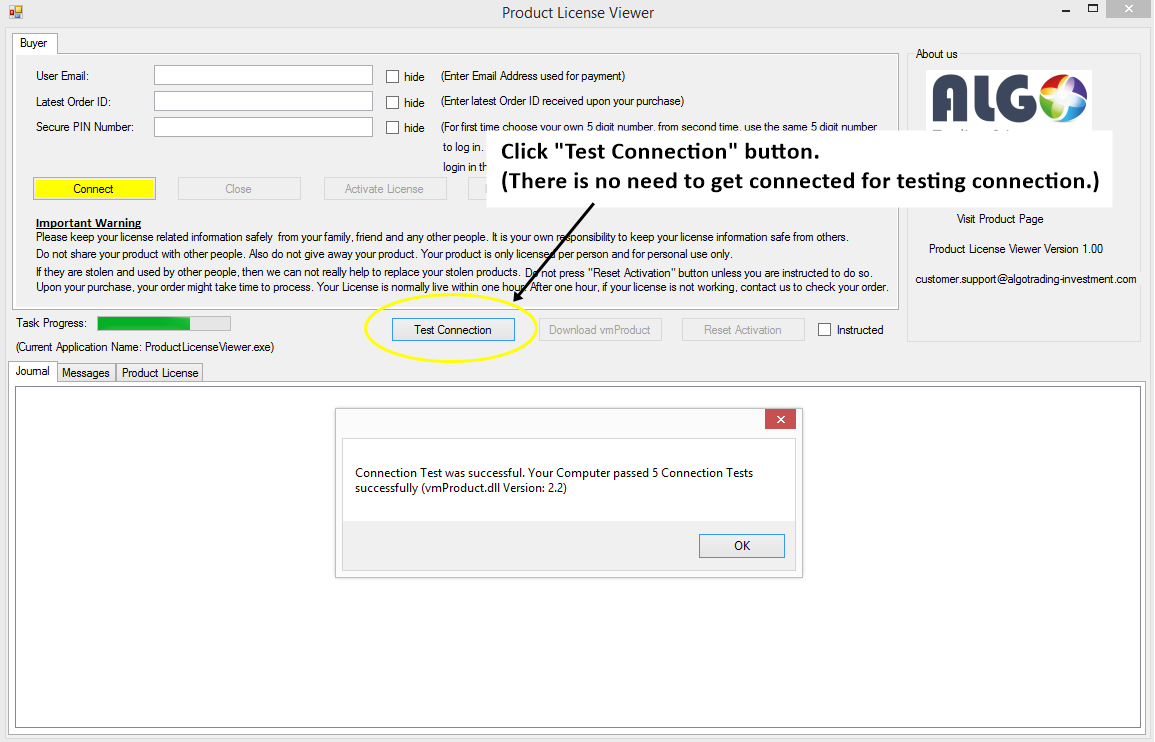
1.Download our Product License Viewer
2.Run Product License Viewer
3.Click “Test Connection” button.
For the Connection Test, there is no need to get connected in the Product License Viewer. Simply click “Test Connection” button when the Product License Viewer is opened. If your computer passed the Connection Test successfully, then your Mac or Linux computer have a good chance to be able to run our Products. If you are not able to pass the Connection Test, then 99% chance that your Mac or Linux OS is not ready to run our products. If you have any doubt about running our products in your Computer, feel free to talk to us at any time (customer.support@algotrading-investment.com). We care about our customers and their value.
http://algotrading-investment.com/product-installation-guide/
https://www.mql5.com/en/users/financeengineer/seller#products

Young Ho Seo
EURUSD Market Outlook
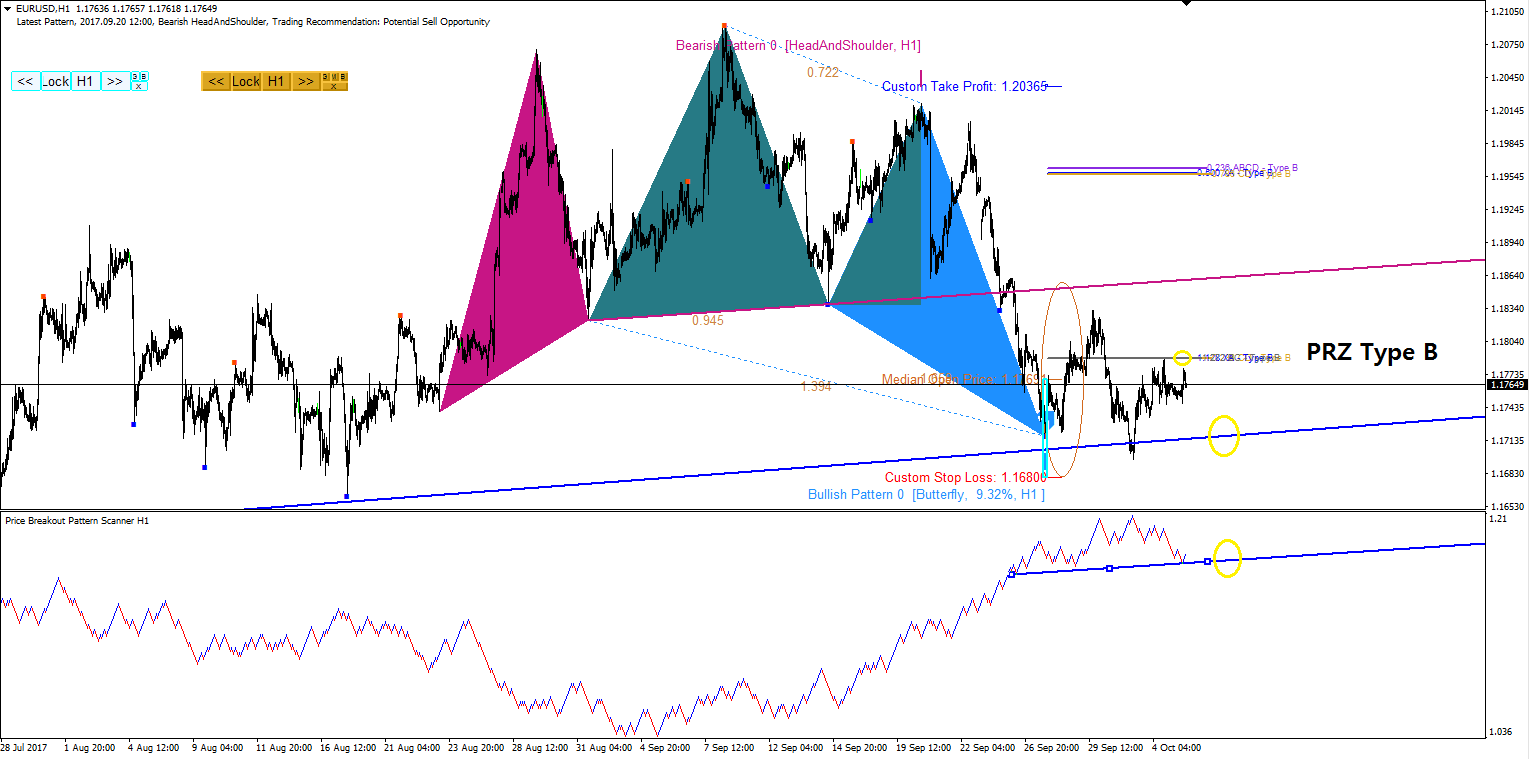
EURUSD enjoyed the sharp fall after the head and shoulder pattern formed last week. With the formation of bullish Butterfly pattern, EURUSD undergone minor correction around 100 pips. Previously EURUSD could not gone far from the first PRZ Type B levels. Afterwards, EURUSD came down to retest the PRZ Type B level again. Currently EURUSD is making a consolation. For your trading, you might watch two important support and resistance lines we have marked out in our screenshots.
Visit the link below for unique and powerful trading system
http://algotrading-investment.com/
https://www.mql5.com/en/users/financeengineer/seller#products

Young Ho Seo
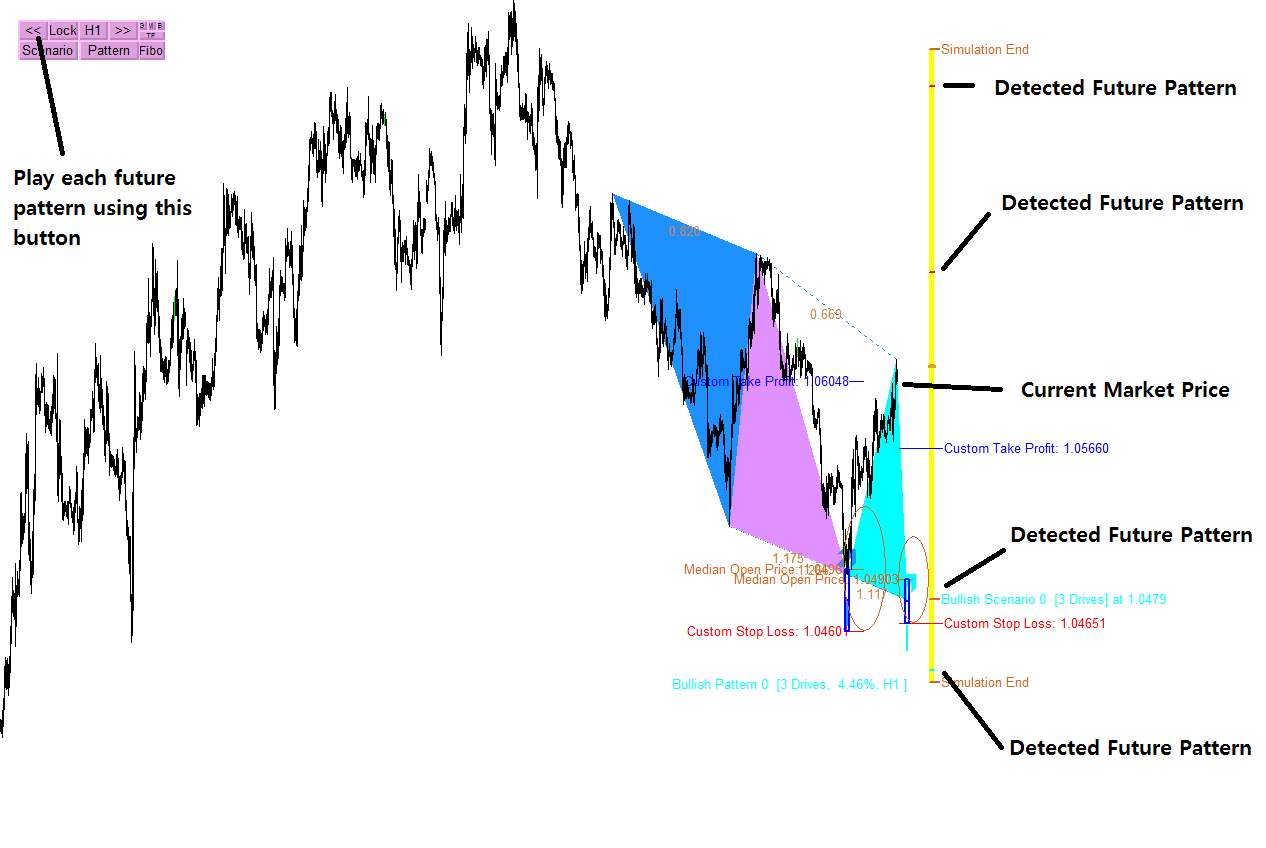
Difference Between Harmonic Pattern Plus and Harmonic Pattern Scenario Planner
The biggest difference between these two are that Harmonic Pattern Scenario Planner can predict future patterns. Not just single future pattern but it can predict any potential patterns around in your price range. Just detecting them are not good enough. In Harmonic Pattern Scenario Planner, you can view each future patterns for your trading decision making one by one or two by two, etc. This is very unique feature for Harmonic Pattern Scenario Planner. To feel what is detecting future patterns, please see this screenshots. In the Screenshots, we have four future harmonic patterns detected in advance. How will you use these advanced information for your trading. Yes, we have many customers taking advantage of these information. However, still you need to be careful at deciding which one is right for you between Harmonic Pattern Scenario Planner and Harmonic Pattern Plus.
If you are quite strategist in forex trading and you appreciate the extra information on your hands, knowing the future patterns in advance, then we recommend Harmonic Pattern Scenario planner. If you believe that playing with many future patterns can be too sophisticated task for you, then Harmonic Pattern Plus is the best recommendation. Considering your decision making capacity is very important for your trading. If you prefer simple and easy trading, then Harmonic pattern Plus is generally good choice.
Harmonic Pattern Plus is still widely used by many Professional traders over 50 different countries around the world. It is built in with the latest pattern detection technology for your advanced trading too. If you have a difficulty to decide which one is right for you, then do not hesitate to contact us.
To visit our website, you can visit following links:
http://algotrading-investment.com/
https://www.mql5.com/en/users/financeengineer/seller#products

Young Ho Seo
GBPUSD Market Outlook
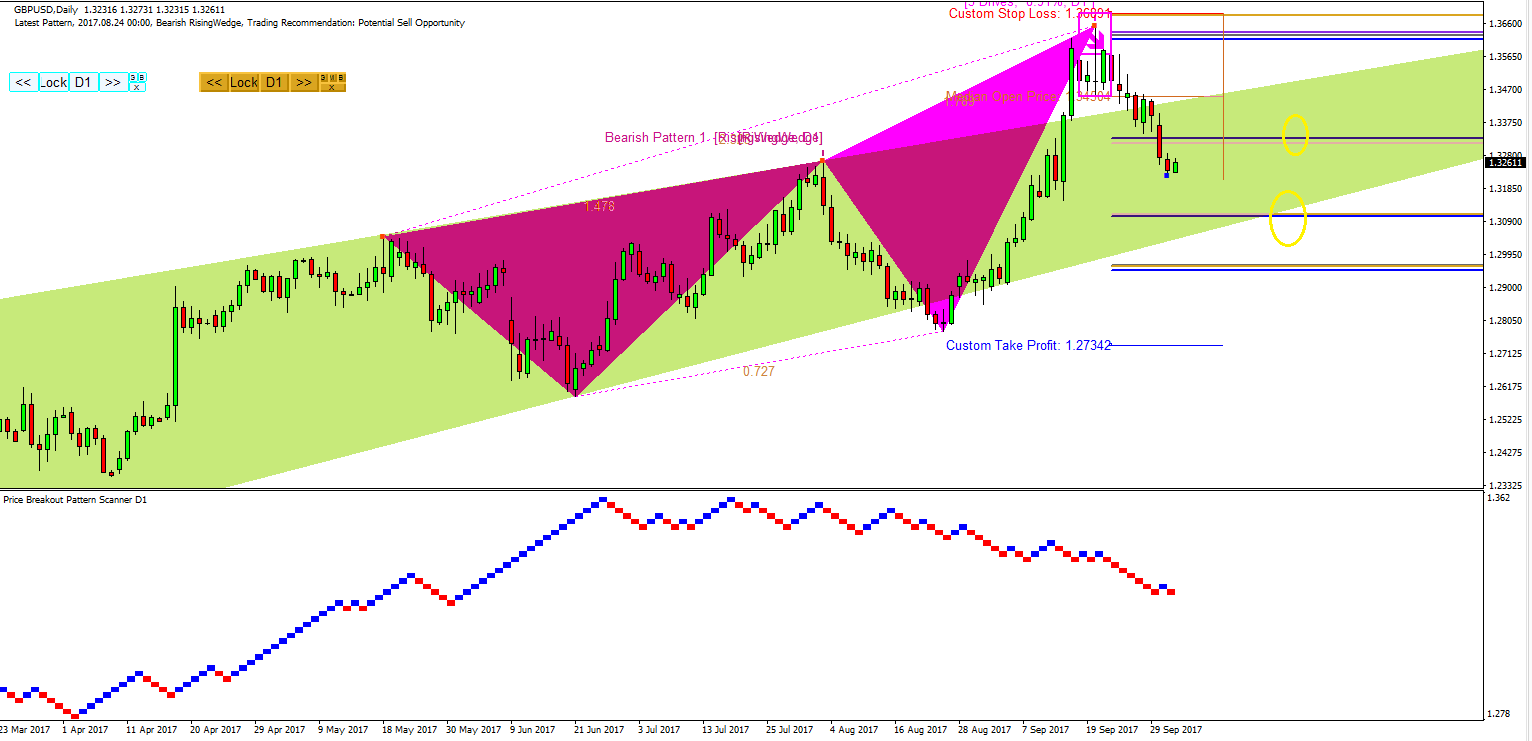
Last week we were talking about GBPUSD making the turning point with 3 Drive pattern. We have been warned you to watch out the price action around the top of the rising wedge pattern. GBPUSD made around 160 pips further drops after it penetrated the top levels. We have outlined two important PRZ Type B levels for your trading in our screenshots.
Visit our website if you are looking for powerful trading system and strategy.
http://algotrading-investment.com/
https://www.mql5.com/en/users/financeengineer/seller#products

Young Ho Seo
USDJPY Market Outlook
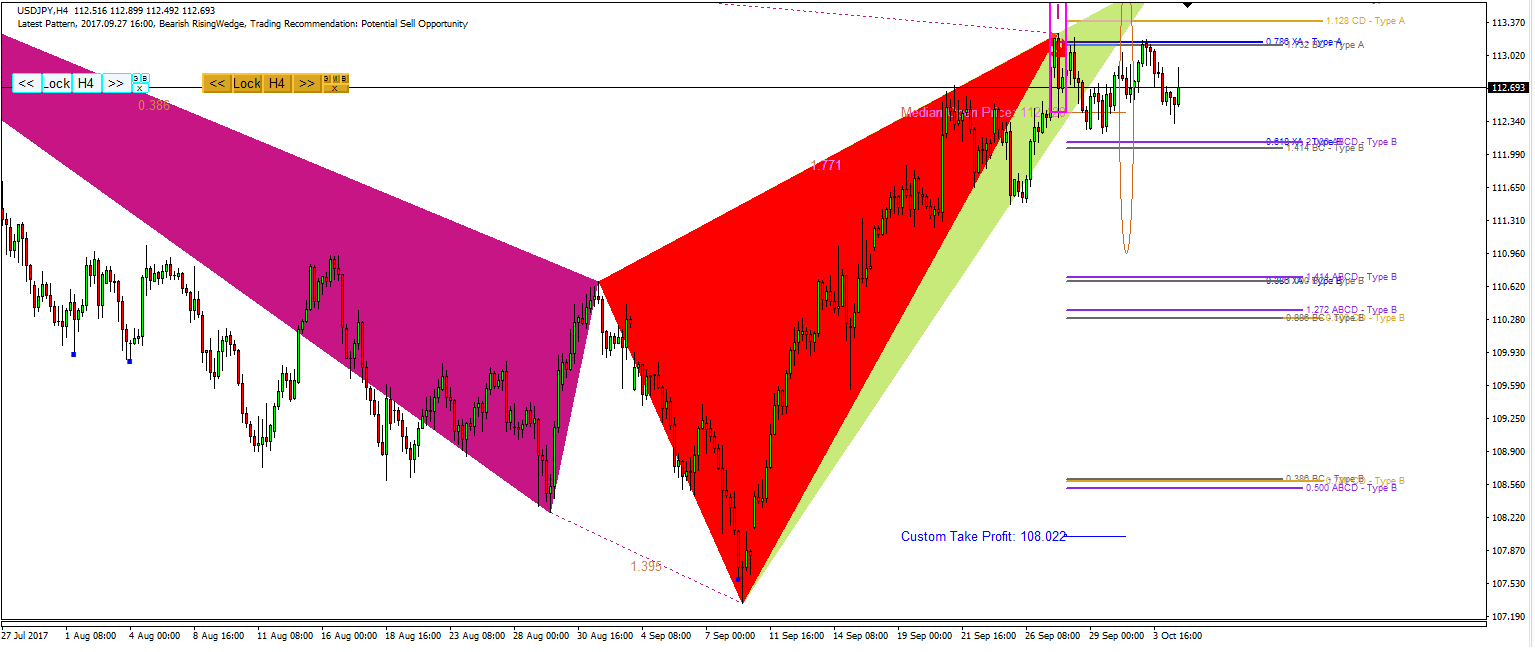
In regards to our last analysis, USDJPY reacted with bearish move on the first appearance of the Cypher pattern on last week. It made a corrective move to retest the PRZ Type A levels again. Currently it is down by nearly 40 pips. Watch out the next nearest PRZ Type B levels for your trading.
http://algotrading-investment.com/
https://www.mql5.com/en/users/financeengineer/seller#products

Young Ho Seo
GBPUSD Market Outlook
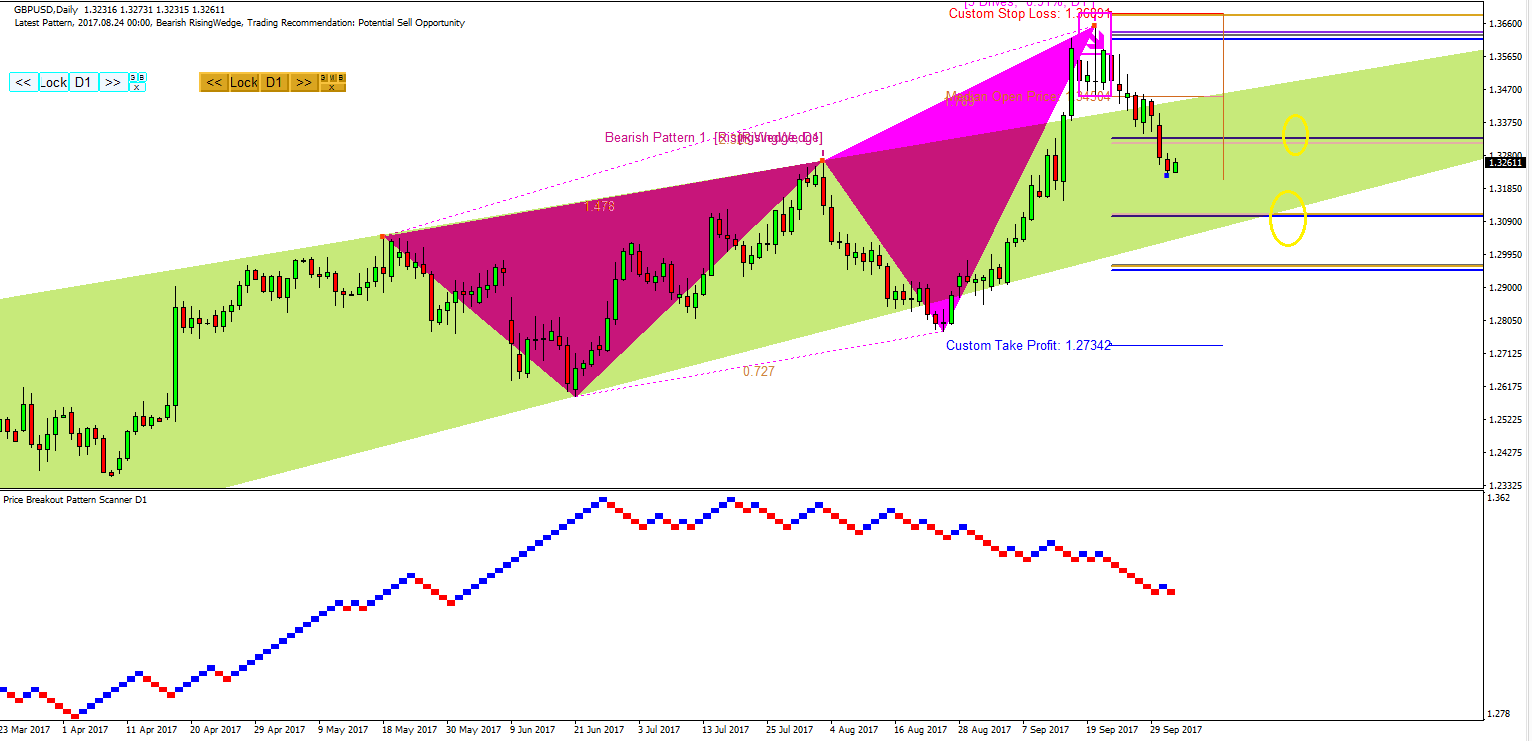
Last week we were talking about GBPUSD making the turning point with 3 Drive pattern. We have been warned you to watch out the price action around the top of the rising wedge pattern. GBPUSD made around 160 pips further drops after it penetrated the top levels. We have outlined two important PRZ Type B levels for your trading in our screenshots.
Visit our website if you are looking for powerful trading system and strategy.
http://algotrading-investment.com/
https://www.mql5.com/en/users/financeengineer/seller#products
Last week we were talking about GBPUSD making the turning point with 3 Drive pattern. We have been warned you to watch out the price action around the top of the rising wedge pattern. GBPUSD made around 160 pips further drops after it penetrated the top levels. We have outlined two important PRZ Type B levels for your trading in our screenshots.
Visit our website if you are looking for powerful trading system and strategy.
http://algotrading-investment.com/
https://www.mql5.com/en/users/financeengineer/seller#products

Young Ho Seo
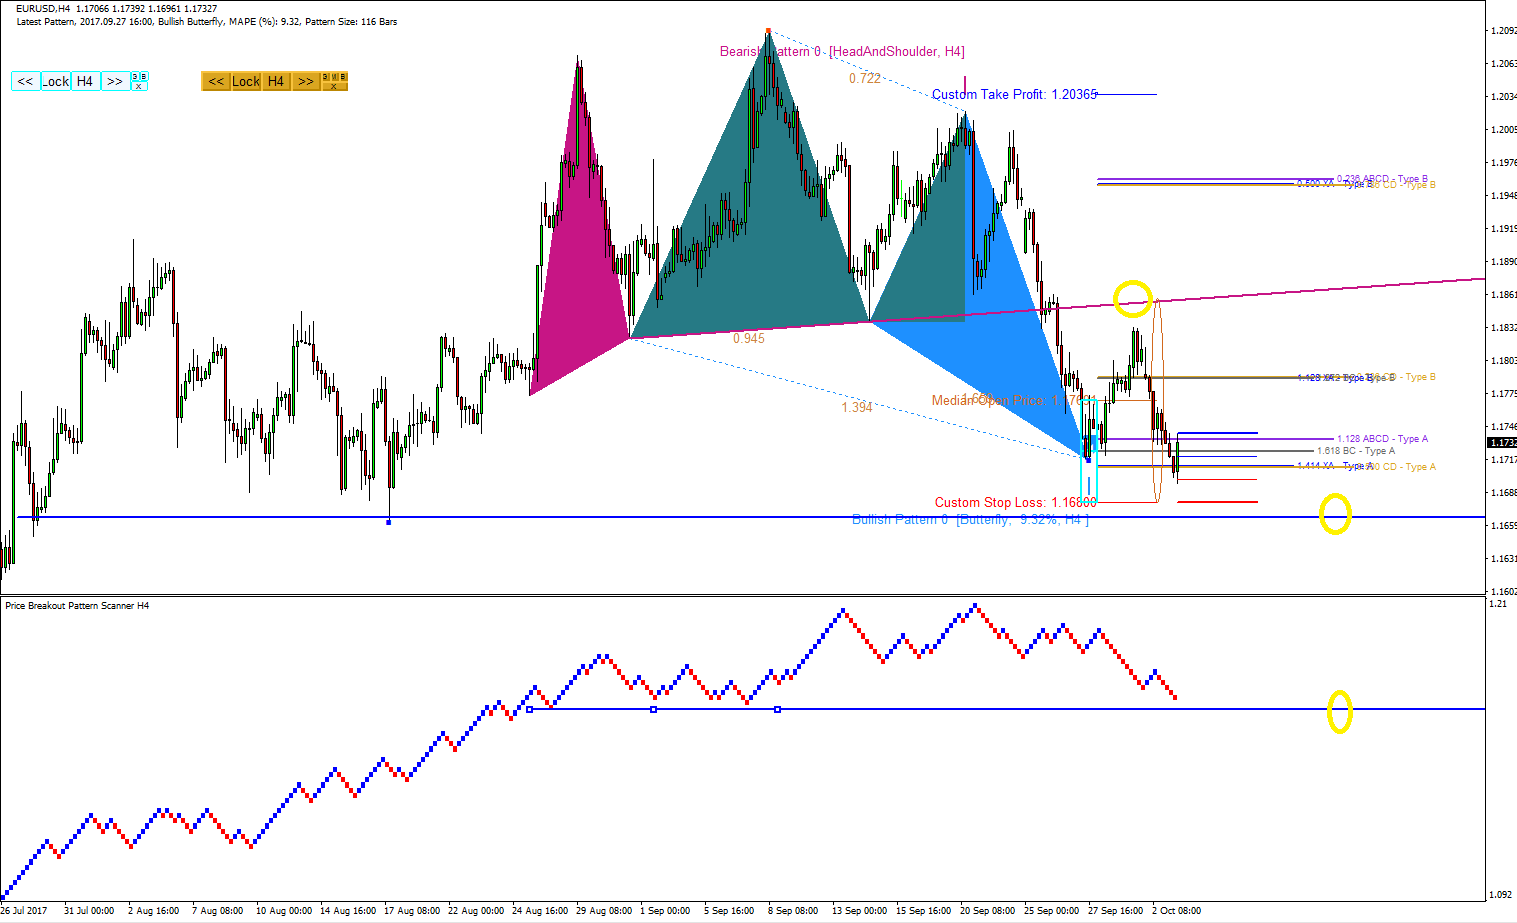
EURUSD Market Outlook
In regards to our last EURUSD analysis, EURUSD could not penetrate the neck line of the head and shoulder pattern. But EURUSD rather went down completing its correction phase started with Butterfly pattern. We have outlined its next important trading levels derived from our Smart Renko in the screenshot for your trading. Watch out this level carefully.
If you are really serious about trading and investment, visit our site:
https://www.mql5.com/en/users/financeengineer/seller#products
http://www.algotrading-investment.com/

Young Ho Seo
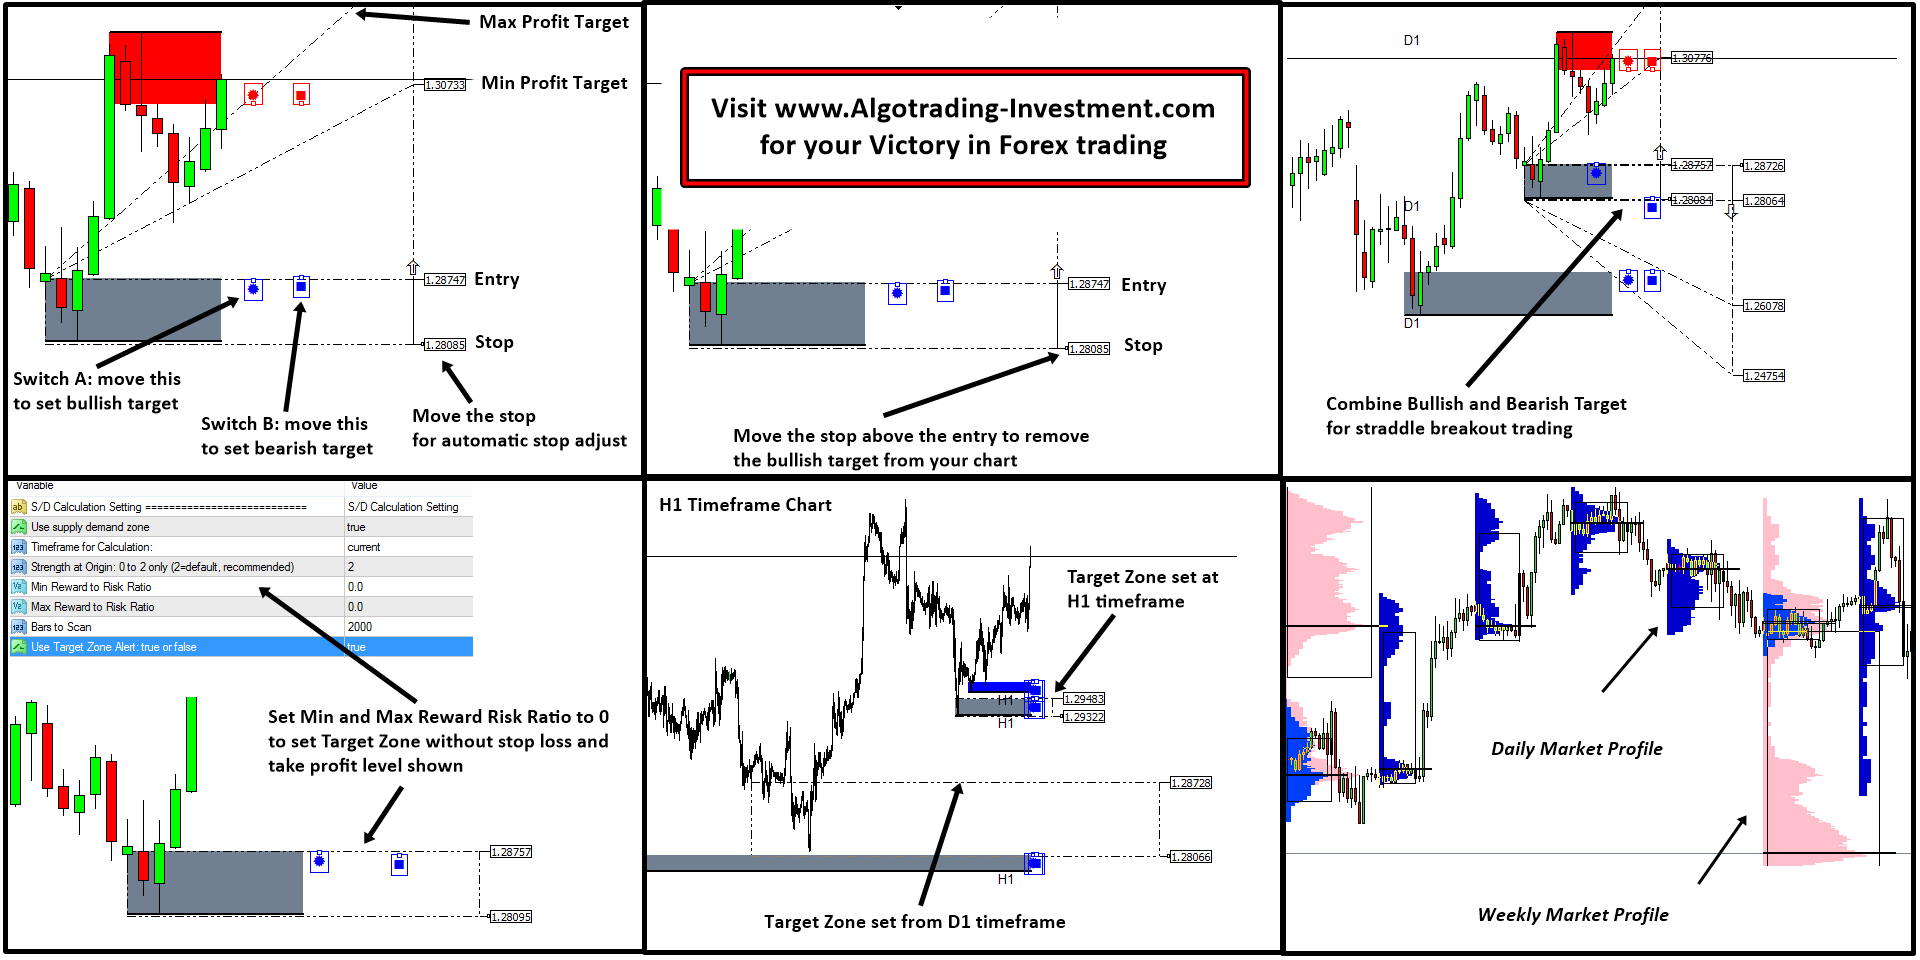
Mean Reversion Supply Demand
We have many sophisticated trading system to construct the sound portfolio of your investment and trading.
Mean Reversion Supply Demand is one of those powerful tool you can add in your collection. With the built in Market Profile indicator, the tool provide flexible and accurate control of your entry and risk management especially around the significant trading zone in your chart.
Highly automated feature can help you to readily set your profit target and even more sophisticated analysis in your chart.
http://algotrading-investment.com/portfolio-item/mean-reversion-supply-demand/
Meet the unique and powerful trading system at our sites:
http://algotrading-investment.com/
https://www.mql5.com/en/users/financeengineer/seller#products

Young Ho Seo
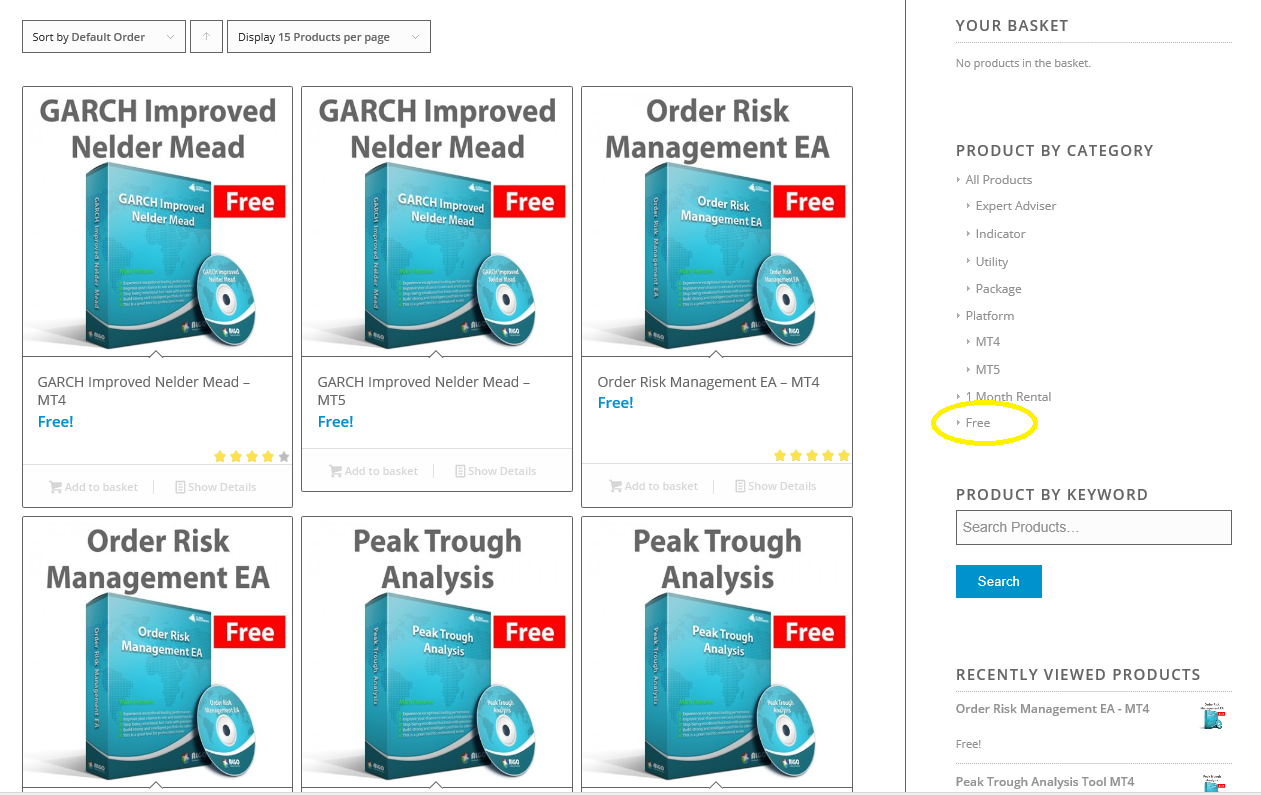
Free Products Links for your Trading & Investment
We offer many useful free products for your trading. Please feel free to access to this free products. They are totally free of charge and nothing is attached for you.
Yet, if you are an our existing customers, then you can also use these free tools together with our paid products too.
http://algotrading-investment.com/product-category/free/
https://www.mql5.com/en/users/financeengineer/seller#products

Young Ho Seo
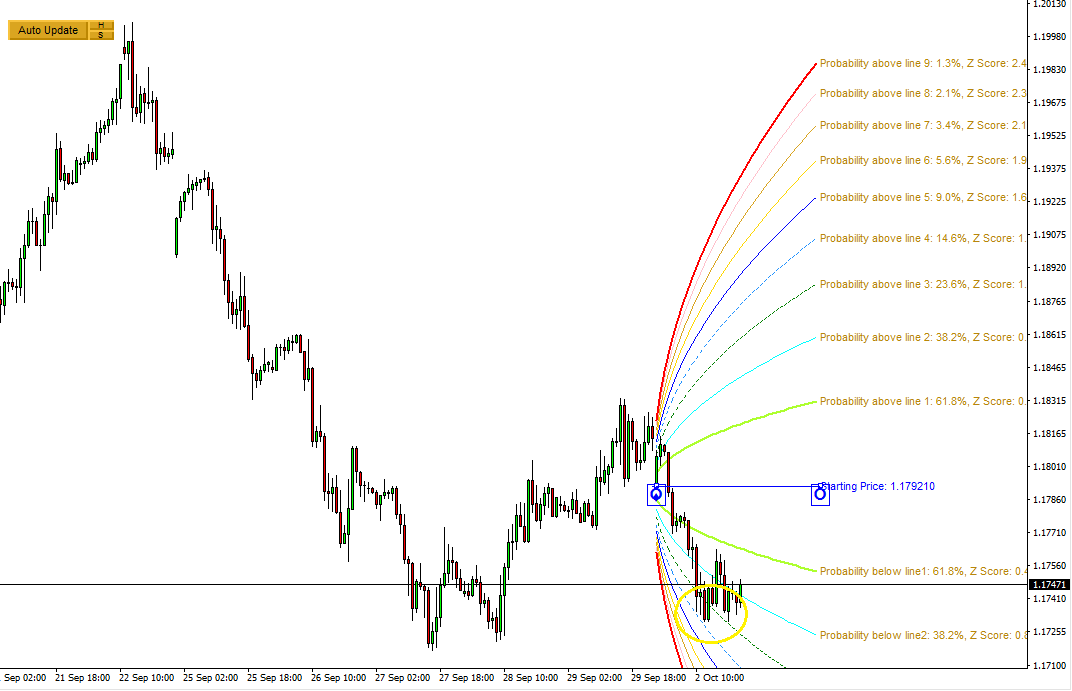
Harmonic Volatility Indicator Example 1
With our Double Harmonic Volatility Indicator, when you just start, it is better to use simple weekly and daily mode for your trading.
However, when you get used the system, you might use it for double harmonic mode. (that is using two harmonic volatility indicator at the same time like Daily + weekly, etc.).
For example, today we can see that EURUSD could not penetrate Probability Line 4. Then EURUSD gone up for about 30 pips. Come down again testing Probability Line 3. But it did not penetrate and gone up again.
This is the typical behaviour of the price around the support and resistance levels.
Plus you hardly do not need to know the concept of Probability if you do not want to. Probability lines are derived geometric lines in our double harmonic volatility indicator by us. Therefore, you just use them like other support and resistance levels.
However, note that the lines are curvy instead of straight line. This HVI is one of the very few Support and resistance indicator providing you the curvy support and resistance lines. The usage of them are exactly same as straight line derived support and resistance levels. We have mentioned about the characteristics of curvy and straight line support and resistance in our book "Introduction to Price Action and Pattern Trading course". Of course, book is only there if you really want to dig deeper with price action and pattern trading. Use of support and resistance levels only takes common sense for any type of traders.
Watching out volatility hardly will not do any thing bad to your trading in general. It is good thing to check volatility at any time for traders.
Kind regards.

Young Ho Seo
USDJPY Market Outlook
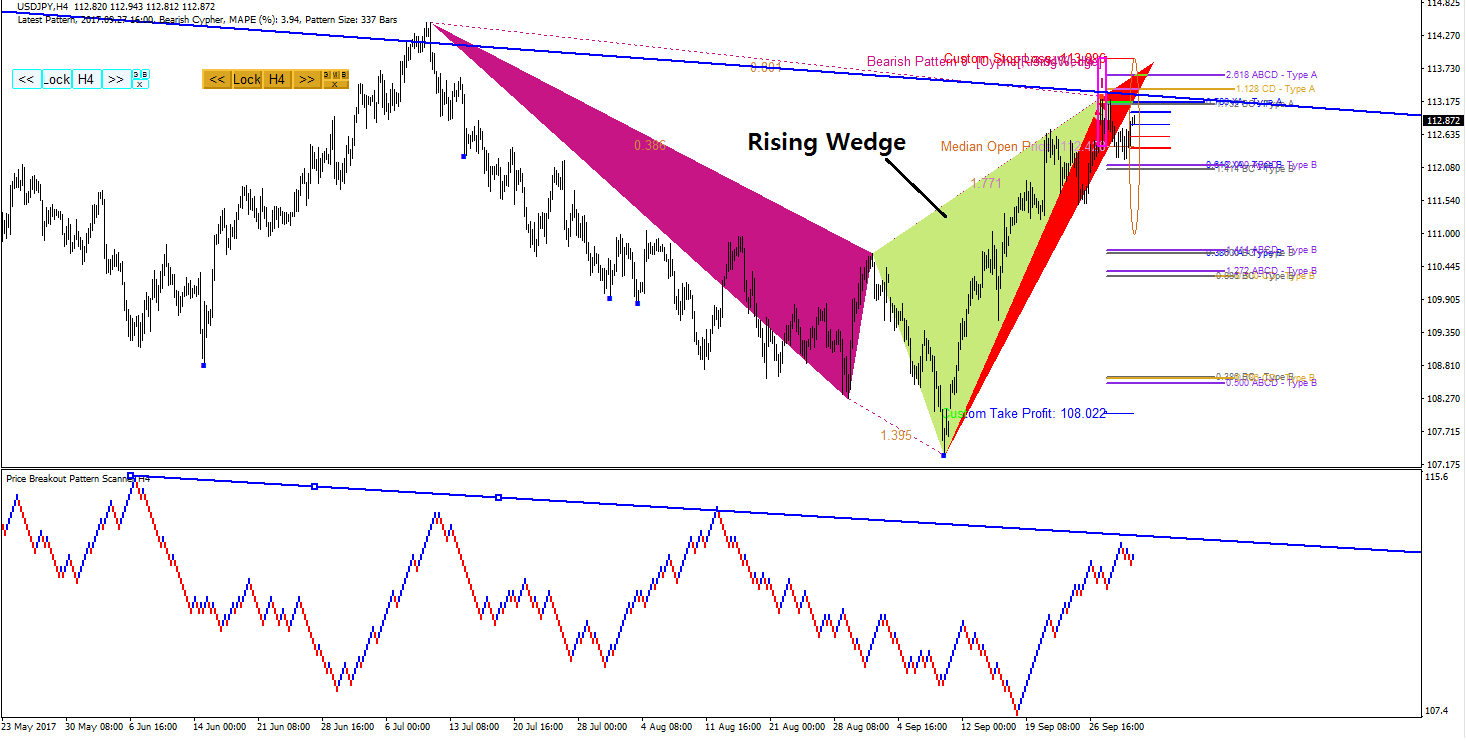
From the beginning of September, USD favoured to be bullish against Japanese yen. USDJPY rose by nearly 600 pips. Currently USDJPY look for its corrective phase. We have the Cypher pattern with MAPE = 3.4%. At the same time, the rising wedge pattern was formed earlier before Cypher pattern.
Visit our website for powerful trading system and strategy.
http://algotrading-investment.com/
https://www.mql5.com/en/users/financeengineer/seller#products

Young Ho Seo
How to Use Auto Chart Alert
In your trading, alert is one important tool that helps you not to miss the important trading opportunity. In addition, alert can save your time for sitting in front of your screen. Auto Chart Alert is very flexible alert solution where you can set your alert for geometric location. You can extend your alert for push notification or email with our Auto Chart Alert.
http://algotrading-investment.com/portfolio-item/auto-chart-alert-2/
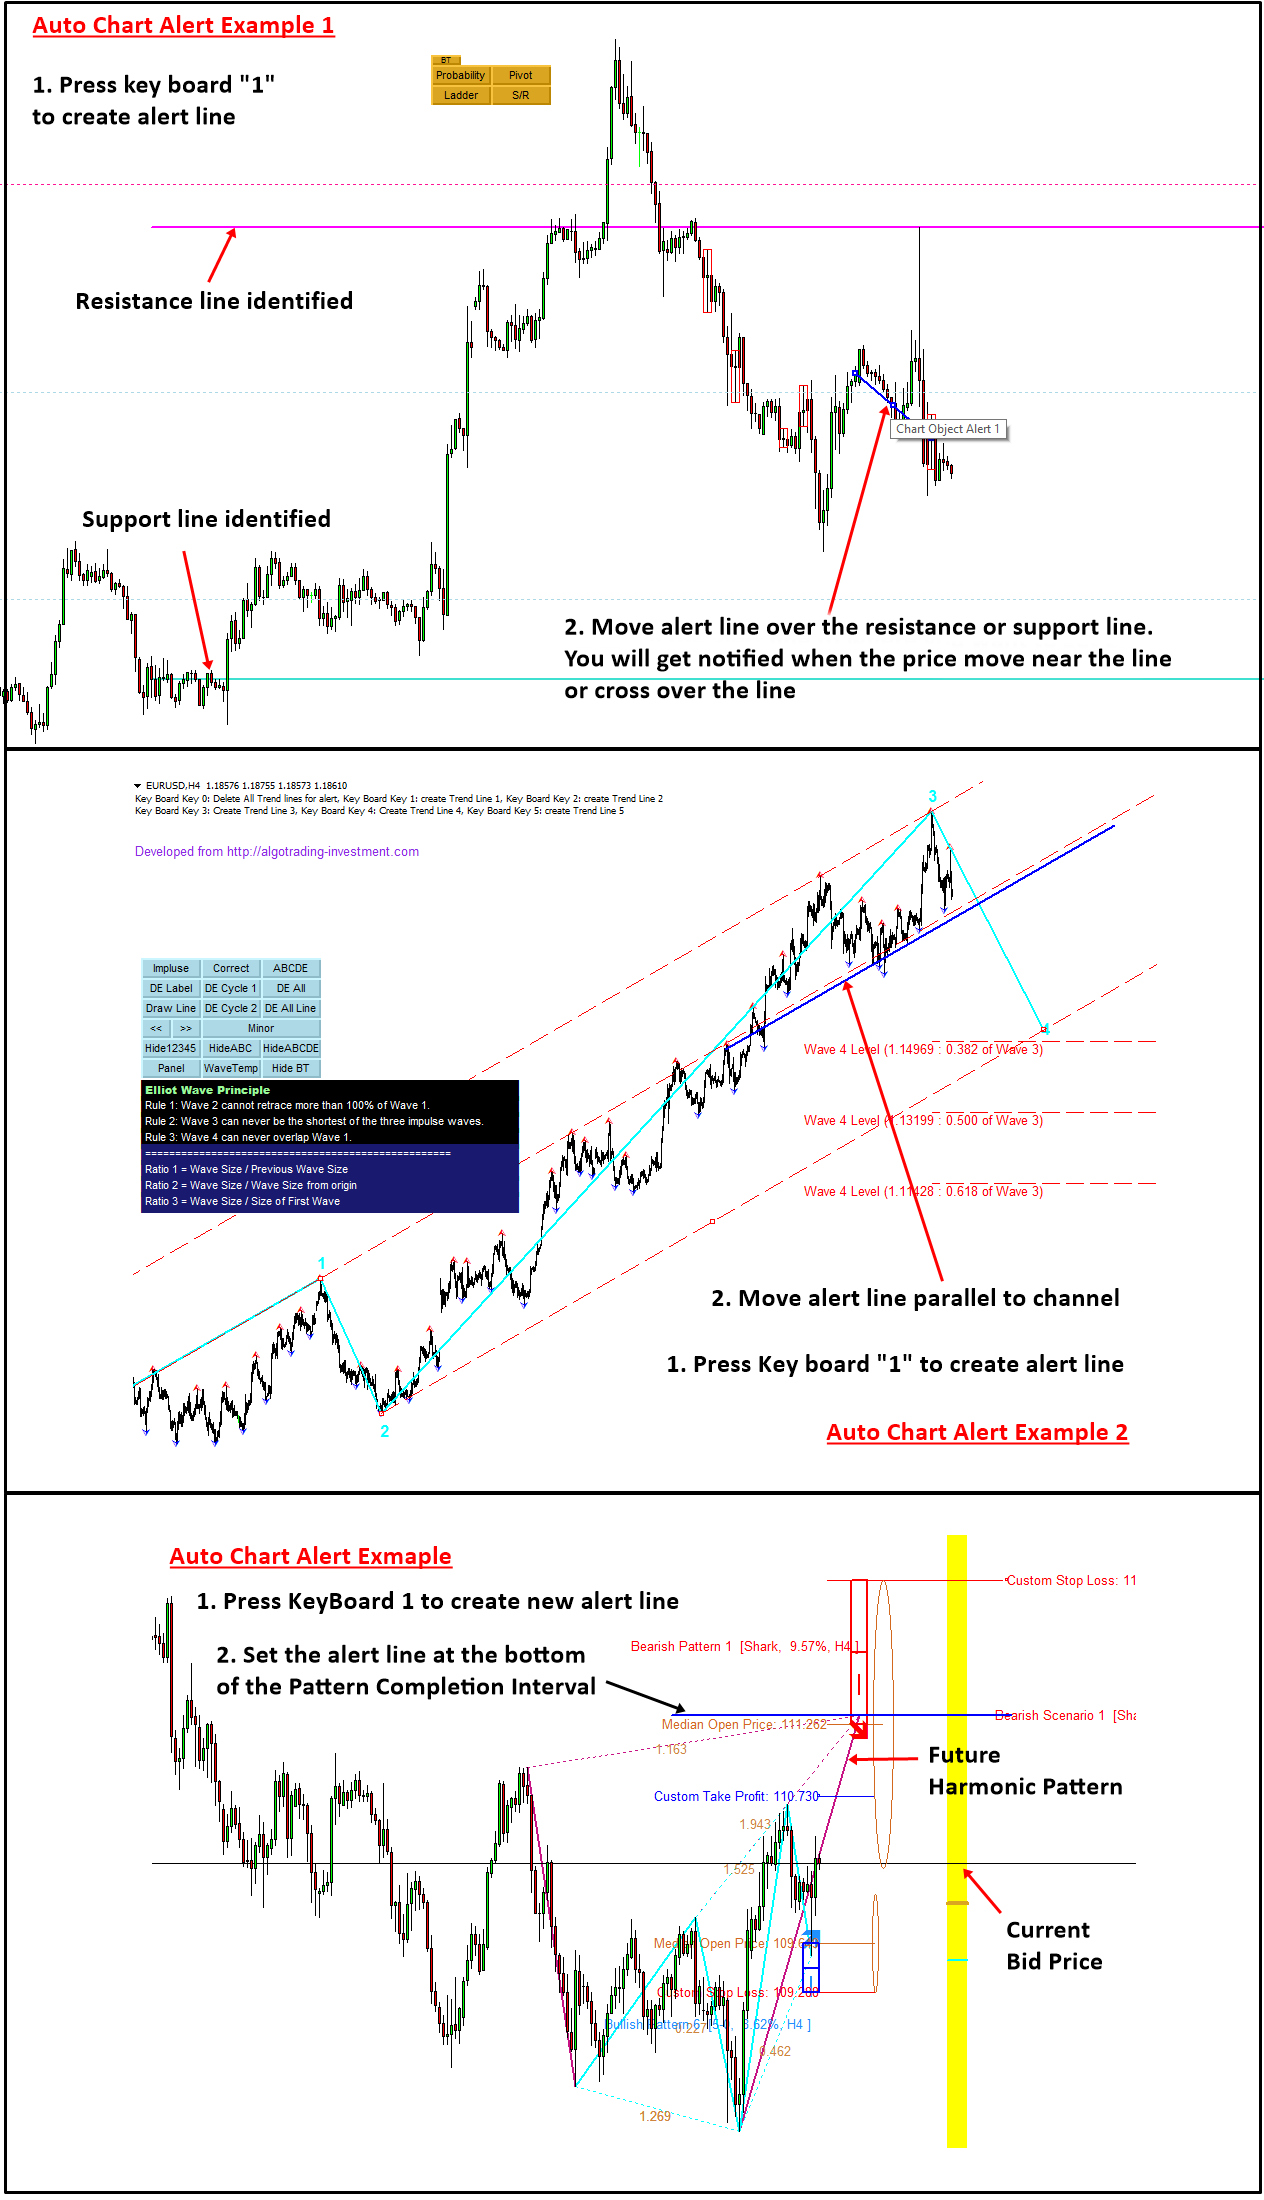
There are many ways you can incorporate this useful alert tool in your trading. In one of the simple example, you can use this tool for simple support resistance trading. You can simply set one of the alert line around support or resistance lines by following the steps:
1.Press Keyboard "1" to create new alert line
2.Move the alert line to support or resistance line in your chart. So you will get alert when price move near the alert line.
If you wish you can set multiple alert lines in your chart. For example, to create 2nd and 3rd alert line, Press Keyboard "2" and "3". Make sure that you are creating another one after moving the previous alert line to the desired location first. To delete all the alert lines, just Press Keyboard "0".
In another simple example, imagine that you are doing some Elliott Wave analysis to decide your trading. Assume that you have counted on Elliott Wave 123 pattern and you want to trade on Elliott Wave 4. Once analysis is done, set the alert line for your trading following the steps below:
•Press Keyboard "1" to create new alert line
•Move the alert line in parallel to channel. So you will get alerted when the price come near the channel line.
Likewise, you can apply Auto Chart Alert for any trading system including Price Breakout Pattern Scanner, Sideways Market Analyser, Harmonic Pattern Plus, etc. It can be even used for other trading system outside our market place. The screenshot show how to apply alert line for your favourite indicator.
One interesting application can be applying the alert line to the future Harmonic Pattern from Harmonic Pattern Scenario Planner. That way you can be notified when the future Harmonic Pattern become realized in your chart.
Here is the link towards Auto Chart Alert:
http://algotrading-investment.com/portfolio-item/auto-chart-alert-2/

Young Ho Seo
GOLD Market Outlook
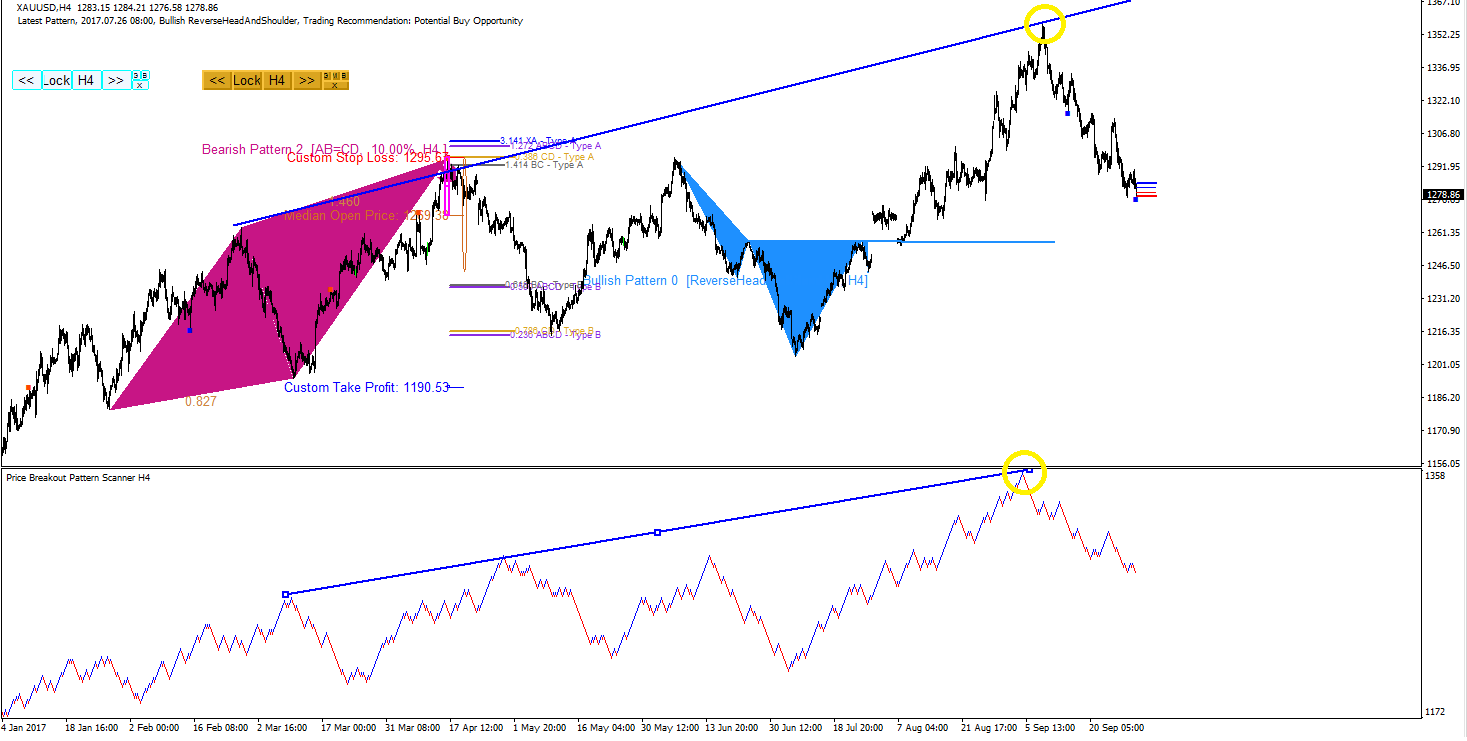
Gold have a bullish momentum with many great uncertainty imposed on the financial market since mid July. The formation of the reverse head and shoulder pattern coincide with the rising movement. However, since mid September, Gold price was gone through the sharp correction. Before the correction, it touched 1357 level by extending those peaks made during March and April. Since then we are nearly 80 dollar down with Gold.
Visit our website for powerful trading system and strategy for your trading and investment.
http://algotrading-investment.com/
https://www.mql5.com/en/users/financeengineer/seller#products

: