Young Ho Seo / Perfil
- Información
|
11+ años
experiencia
|
62
productos
|
1192
versiones demo
|
|
4
trabajos
|
0
señales
|
0
suscriptores
|
Harmonic Pattern Indicator - Repainting + Japanese Candlestick Pattern Scanner + Automatic Channel + Many more
https://www.mql5.com/en/market/product/4488
https://www.mql5.com/en/market/product/4475
https://algotrading-investment.com/portfolio-item/harmonic-pattern-plus/
Non Repainting and Non Lagging Harmonic Pattern Indicator – Customizable Harmonic + Japanese Candlestic Pattern Scanner + Advanced Channel + Many more
https://www.mql5.com/en/market/product/41993
https://www.mql5.com/en/market/product/41992
https://algotrading-investment.com/portfolio-item/profitable-pattern-scanner/
Supply Demand Indicator – Multiple Timeframe Scanning Added + Non Repainting + Professional Indicator
https://www.mql5.com/en/market/product/40076
https://www.mql5.com/en/market/product/40075
https://algotrading-investment.com/portfolio-item/ace-supply-demand-zone/
Momentum Indicator – Path to Volume Spread Analysis
https://www.mql5.com/en/market/product/30641
https://www.mql5.com/en/market/product/30621
https://algotrading-investment.com/portfolio-item/excessive-momentum-indicator/
Elliott Wave Indicator for the Power User
https://www.mql5.com/en/market/product/16479
https://www.mql5.com/en/market/product/16472
https://algotrading-investment.com/portfolio-item/elliott-wave-trend/
Forex Prediction - Turn Support and Resistance to the Advanced Strategy
https://www.mql5.com/en/market/product/49170
https://www.mql5.com/en/market/product/49169
https://algotrading-investment.com/portfolio-item/fractal-pattern-scanner/
MetaTrader 4 and MetaTrader 5 Product Page: https://www.mql5.com/en/users/financeengineer/seller#products
Free Forex Prediction with Fibonacci Analysis: https://algotrading-investment.com/2020/10/23/forex-prediction-with-fibonacci-analysis/
Free Harmonic Pattern Signal: https://algotrading-investment.com/2020/12/17/harmonic-pattern-signal-for-forex-market/
============================================================================================================================
Here are the trading education books. We recommend reading these books if you are a trader or investor in Forex and Stock market. In the list below, we put the easy to read book on top. Try to read the easy to read book first and try to read the harder book later to improve your trading and investment.
First Link = amazon.com, Second Link = Google Play Books, Third Link = algotrading-investment.com, Fourth Link = Google Books
Technical Analysis in Forex and Stock Market (Supply Demand Analysis and Support Resistance)
https://www.amazon.com/dp/B09L55ZK4Z
https://play.google.com/store/books/details?id=pHlMEAAAQBAJ
https://algotrading-investment.com/portfolio-item/technical-analysis-in-forex-and-stock-market/
https://books.google.co.kr/books/about?id=pHlMEAAAQBAJ
Science Of Support, Resistance, Fibonacci Analysis, Harmonic Pattern, Elliott Wave and X3 Chart Pattern (In Forex and Stock Market Trading)
https://www.amazon.com/dp/B0993WZGZD
https://play.google.com/store/books/details?id=MME3EAAAQBAJ
https://algotrading-investment.com/portfolio-item/science-of-support-resistance-fibonacci-analysis-harmonic-pattern/
https://books.google.co.kr/books/about?id=MME3EAAAQBAJ
Profitable Chart Patterns in Forex and Stock Market (Fibonacci Analysis, Harmonic Pattern, Elliott Wave, and X3 Chart Pattern)
https://www.amazon.com/dp/B0B2KZH87K
https://play.google.com/store/books/details?id=7KrQDwAAQBAJ
https://algotrading-investment.com/portfolio-item/profitable-chart-patterns-in-forex-and-stock-market/
https://books.google.com/books/about?id=7KrQDwAAQBAJ
Guide to Precision Harmonic Pattern Trading (Mastering Turning Point Strategy for Financial Trading)
https://www.amazon.com/dp/B01MRI5LY6
https://play.google.com/store/books/details?id=8SbMDwAAQBAJ
http://algotrading-investment.com/portfolio-item/guide-precision-harmonic-pattern-trading/
https://books.google.com/books/about?id=8SbMDwAAQBAJ
Scientific Guide to Price Action and Pattern Trading (Wisdom of Trend, Cycle, and Fractal Wave)
https://www.amazon.com/dp/B073T3ZMBR
https://play.google.com/store/books/details?id=5prUDwAAQBAJ
https://algotrading-investment.com/portfolio-item/scientific-guide-to-price-action-and-pattern-trading/
https://books.google.com/books/about?id=5prUDwAAQBAJ
Predicting Forex and Stock Market with Fractal Pattern: Science of Price and Time
https://www.amazon.com/dp/B086YKM8BW
https://play.google.com/store/books/details?id=VJjiDwAAQBAJ
https://algotrading-investment.com/portfolio-item/predicting-forex-and-stock-market-with-fractal-pattern/
https://books.google.com/books/about?id=VJjiDwAAQBAJ
Trading Education Book 1 in Korean (Apple, Google Play Book, Google Book, Scribd, Kobo)
https://books.apple.com/us/book/id1565534211
https://play.google.com/store/books/details?id=HTgqEAAAQBAJ
https://books.google.co.kr/books/about?id=HTgqEAAAQBAJ
https://www.scribd.com/book/505583892
https://www.kobo.com/ww/en/ebook/8J-Eg58EDzKwlpUmADdp2g
Trading Education Book 2 in Korean (Apple, Google Play Book, Google Book, Scribd, Kobo)
https://books.apple.com/us/book/id1597112108
https://play.google.com/store/books/details?id=shRQEAAAQBAJ
https://books.google.co.kr/books/about?id=shRQEAAAQBAJ
https://www.scribd.com/book/542068528
https://www.kobo.com/ww/en/ebook/X8SmJdYCtDasOfQ1LQpCtg
About Young Ho Seo
Young Ho Seo is an Engineer, Financial Trader, and Quantitative Developer, working on Trading Science and Investment Engineering since 2011. He is the creator of many technical indicators, price patterns and trading strategies used in the financial market. He is also teaching the trading practice on how to use the Supply Demand Analysis, Support, Resistance, Trend line, Fibonacci Analysis, Harmonic Pattern, Elliott Wave Theory, Chart Patterns, and Probability for Forex and Stock Market. His works include developing scientific trading principle and mathematical algorithm in the work of Benjamin Graham, Everette S. Gardner, Benoit Mandelbrot, Ralph Nelson Elliott, Harold M. Gartley, Richard Shabacker, William Delbert Gann, Richard Wyckoff and Richard Dennis. You can find his dedicated works on www.algotrading-investment.com . His life mission is to connect financial traders and scientific community for better understanding of this world and crowd behaviour in the financial market. He wrote many books and articles, which are helpful for understanding the technology and application behind technical analysis, statistics, time series forecasting, fractal science, econometrics, and artificial intelligence in the financial market.
If you are interested in our software and training, just visit our main website: www.algotrading-investment.com
Young Ho Seo
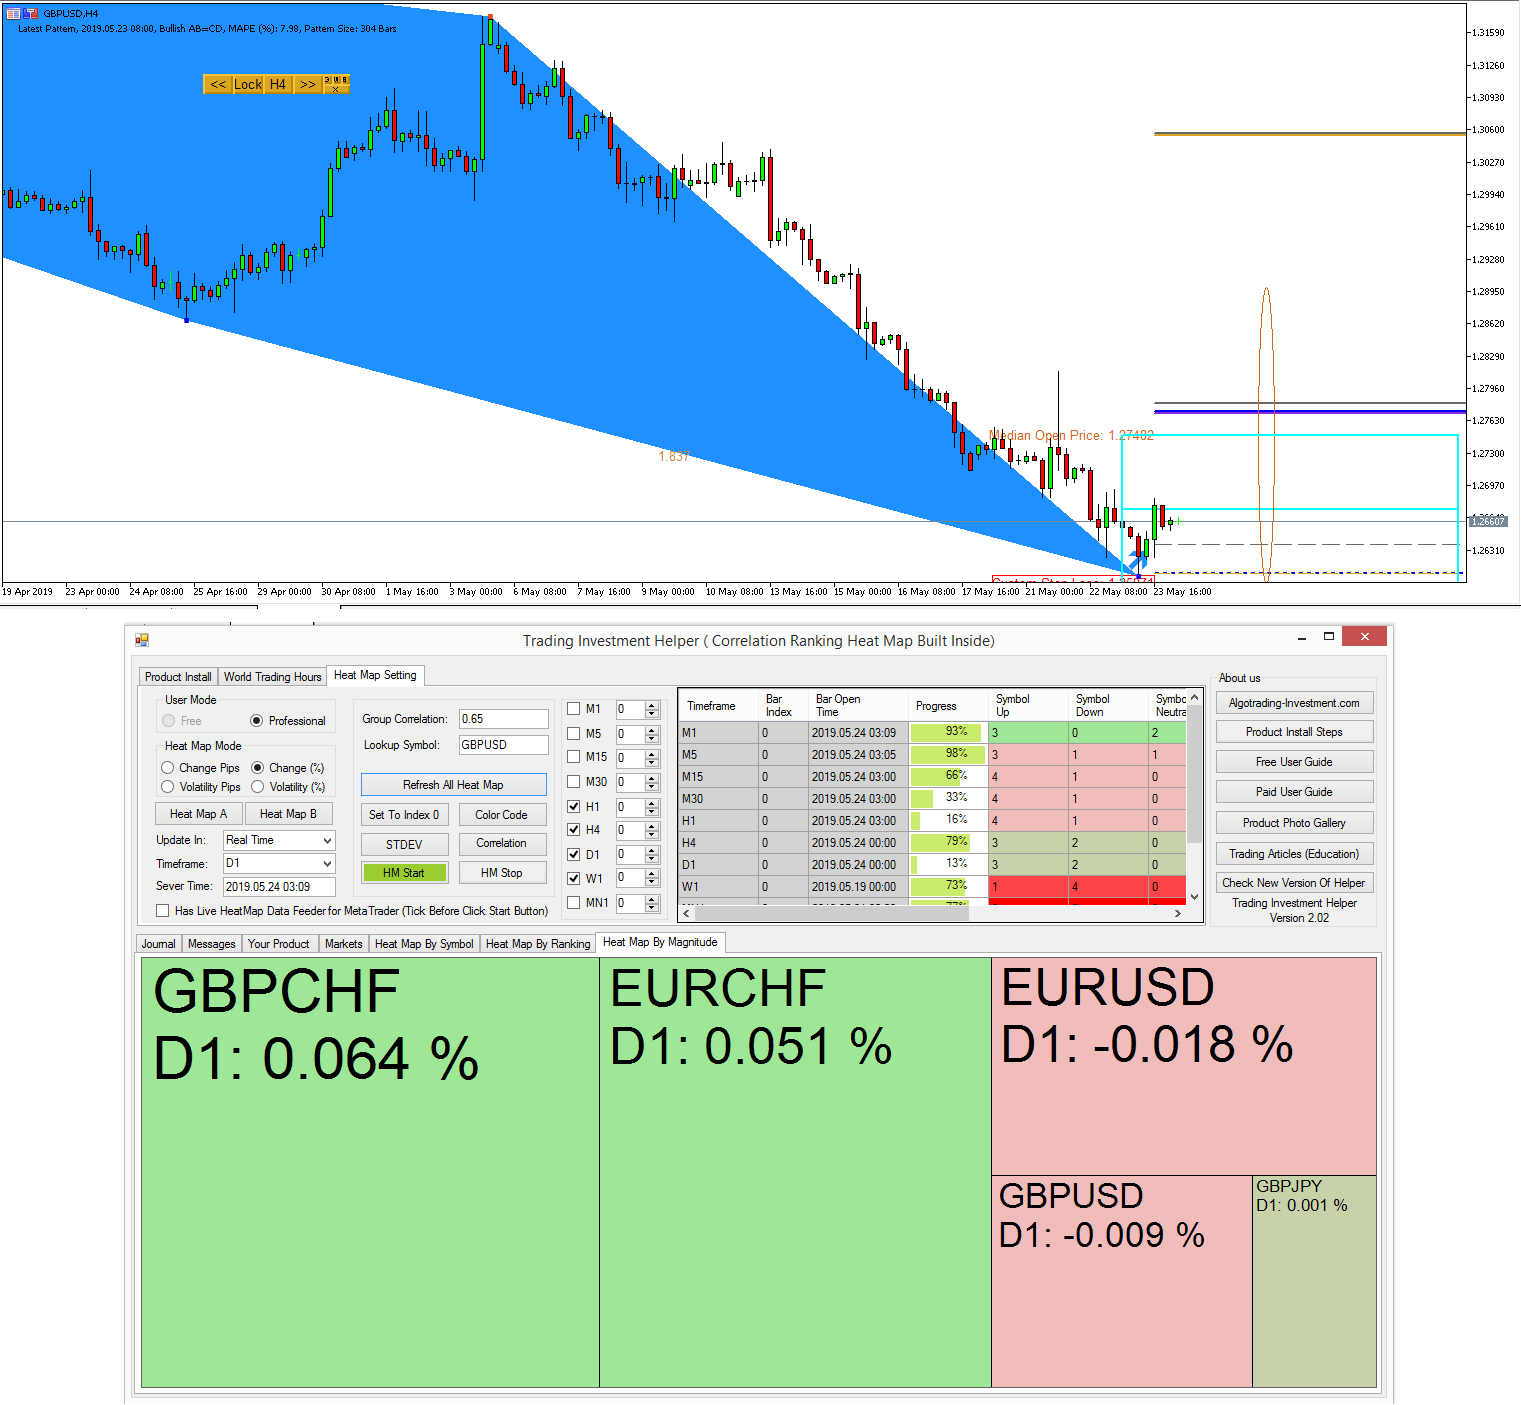
GBPUSD Market Outlook- 23 May 2019
After nearly 560 pips fall, GBPUSD got to take some correction. It is taking now little rest from its heavy fall. The formation of AB=CD pattern is coincided with the correction for GBPUSD.
Here is the link to our Excellent Harmonic Pattern Indicators for MetaTrader.
http://algotrading-investment.com/portfolio-item/harmonic-pattern-scenario-planner/
https://www.mql5.com/en/market/product/6101
https://www.mql5.com/en/market/product/6240

Young Ho Seo
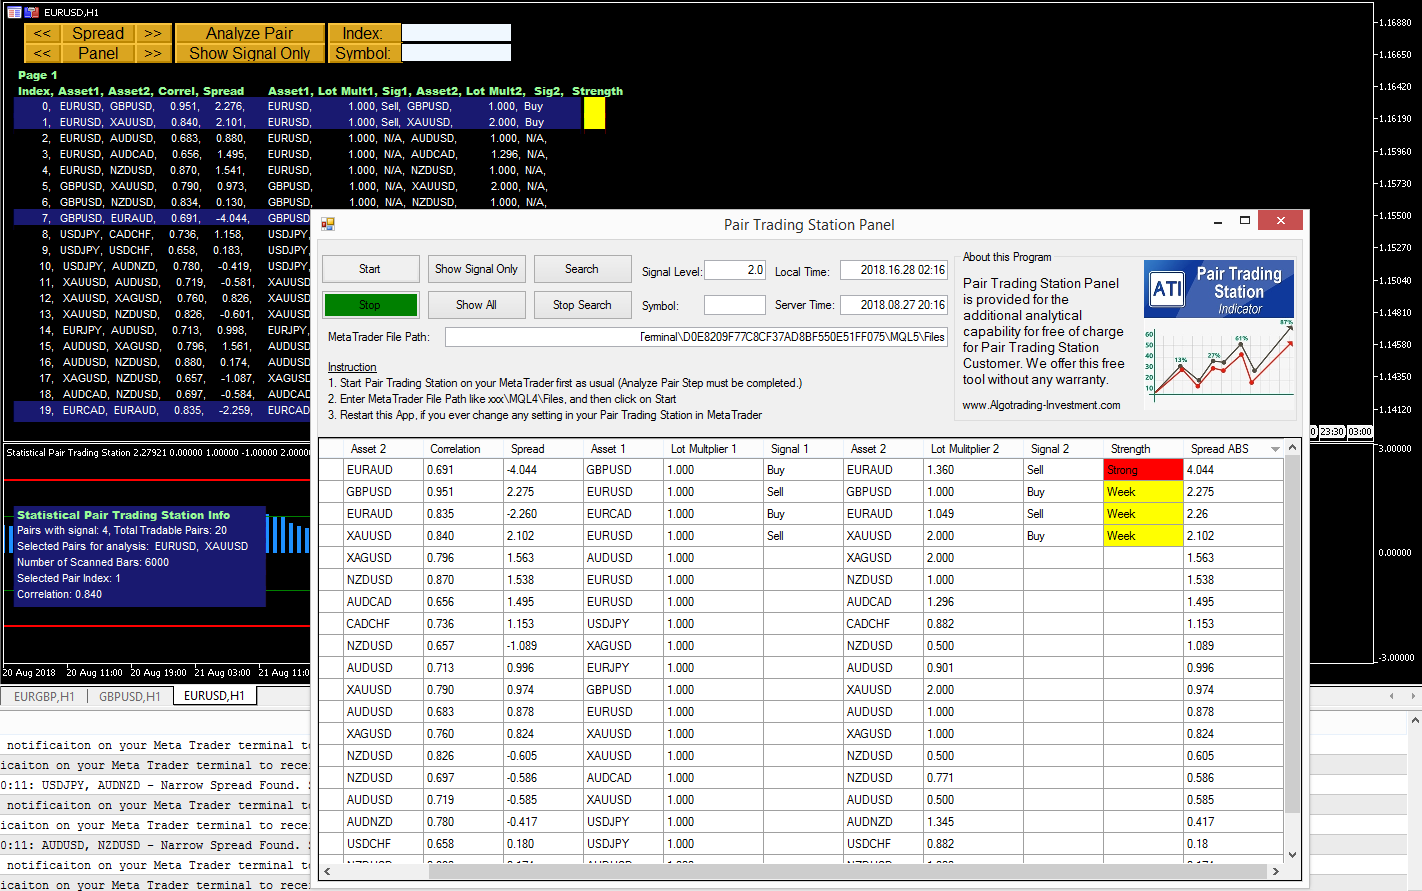
Manual For Pair Trading Station
Pair Trading Station is a powerful MetaTrader Indicator. Its decision making algorithm is based on Pairs trading (a.k.a Statistical arbitrage or spread analysis). This manual was written already few years ago for our Pair Trading Station. I think this is still very useful if your trading is based on correlation and spread. This is pdf manual, so please download it into your hard drive and read them. Below is the link to the pdf manual:
https://algotrading-investment.com/2015/11/14/introduction-to-pair-trading-station_ati/
Do not forget to visit our website to look for powerful trading system and tools based on the secret recipes not available to public.
https://algotrading-investment.com
https://www.mql5.com/en/users/financeengineer/seller#products

Young Ho Seo
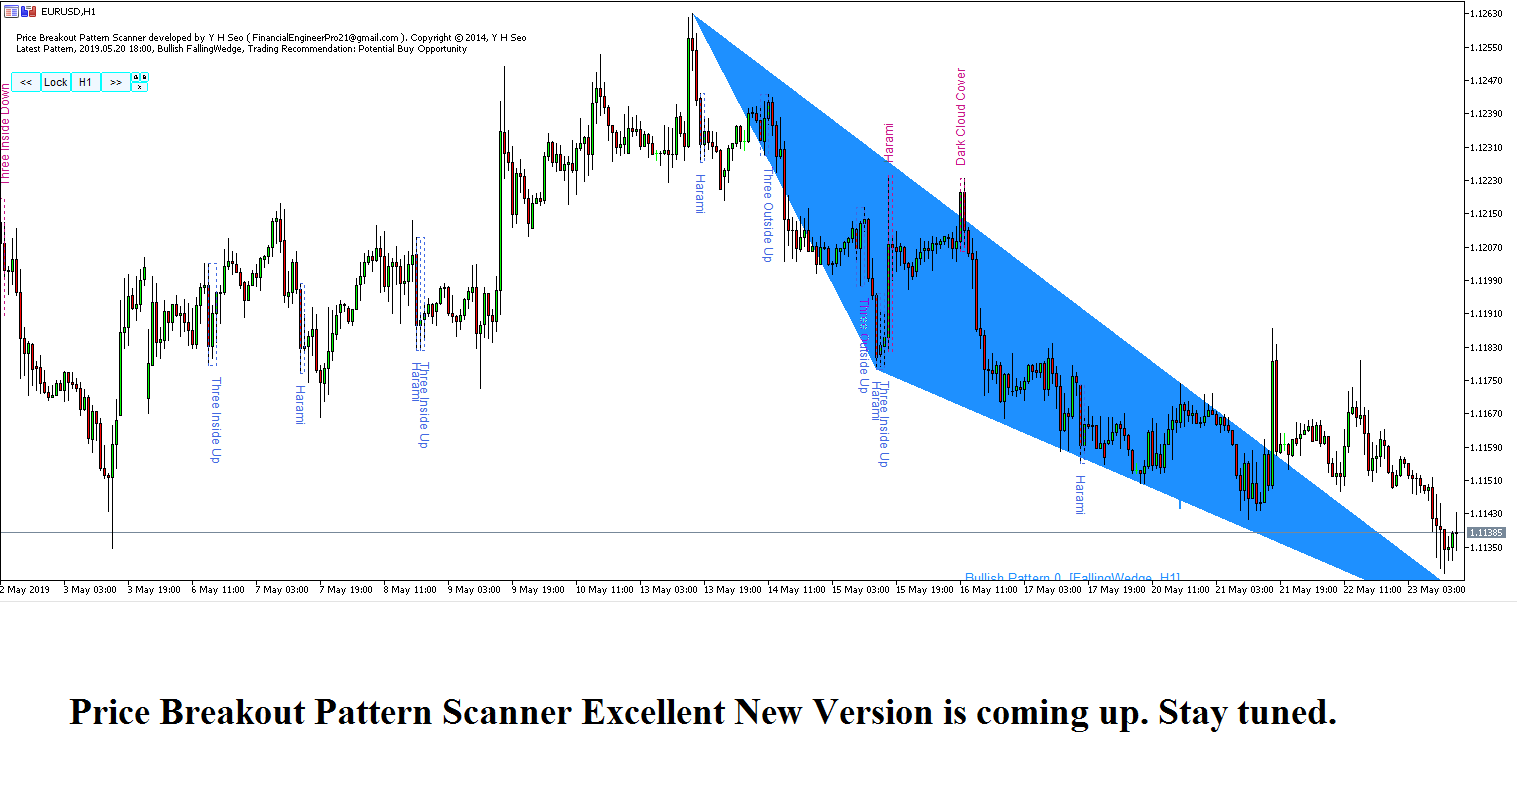
Price Breakout Pattern Scanner New Version coming – 23 May 2019
We always thrive to deliver better and better products to our customers. At the moment, we are working on the price breakout pattern scanner new version.
In the new version, we are trying to improve the readability of candlestick patterns. In fact, with price breakout pattern scanner, there is no need for you to have any other candlestick pattern detector because it provides very good one within.
So Price Breakout Pattern Scanner is all in one system really.
Anyway, we are working on now, so stay tuned for further new about this new version.
https://www.mql5.com/en/market/product/4859
https://www.mql5.com/en/market/product/4858
https://algotrading-investment.com/portfolio-item/price-breakout-pattern-scanner/

Young Ho Seo
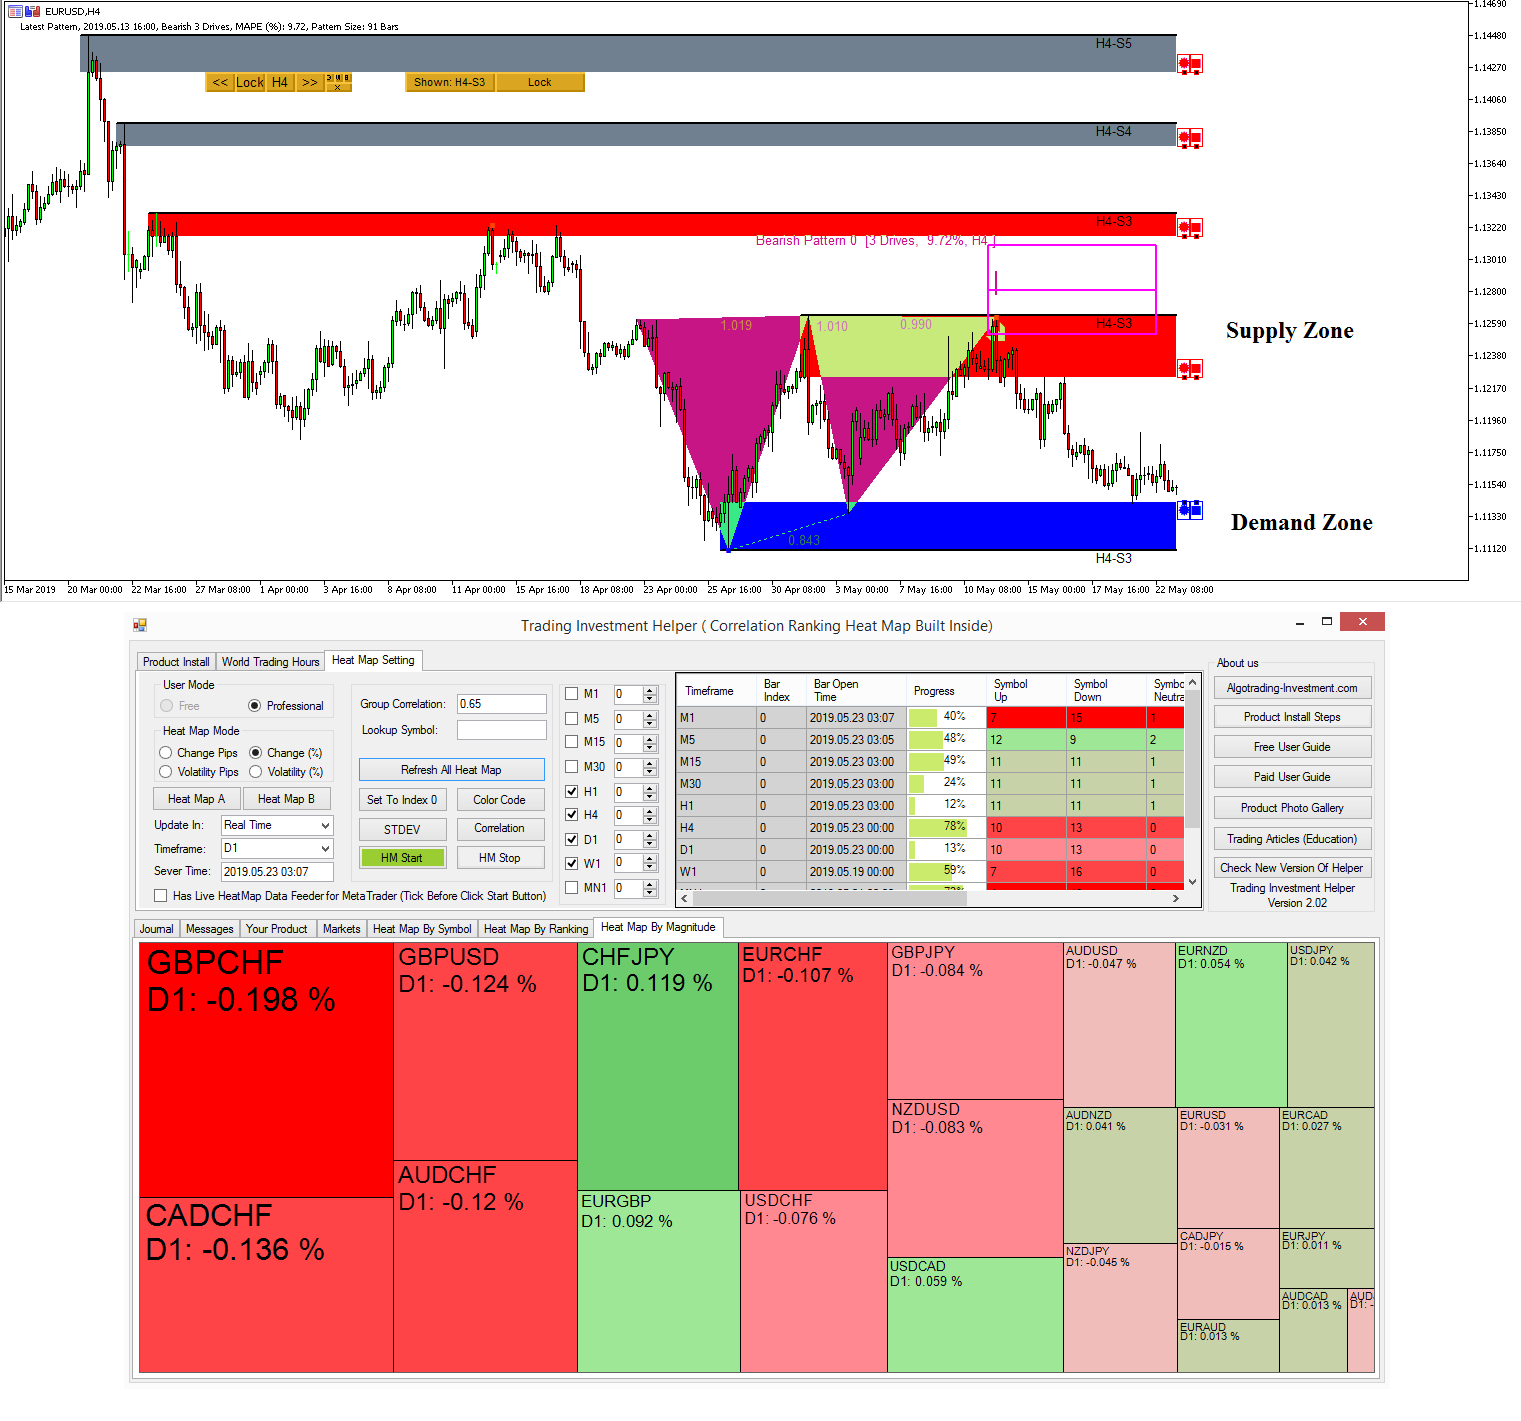
EURUSD Market Outlook - 22 May 2019
Still bearish sentiment is bit stronger than bullish sentiment in overall market. Bearish 3 drives pattern drove EURUSD nearly 100 pips but in moderate way. EURUSD is currently making the ranging movement between the supply and demand zone marked. Watch out the demand zone which is tested at the moment.
http://algotrading-investment.com/portfolio-item/harmonic-pattern-plus/
https://www.mql5.com/en/market/product/4488
https://www.mql5.com/en/market/product/4475

Young Ho Seo
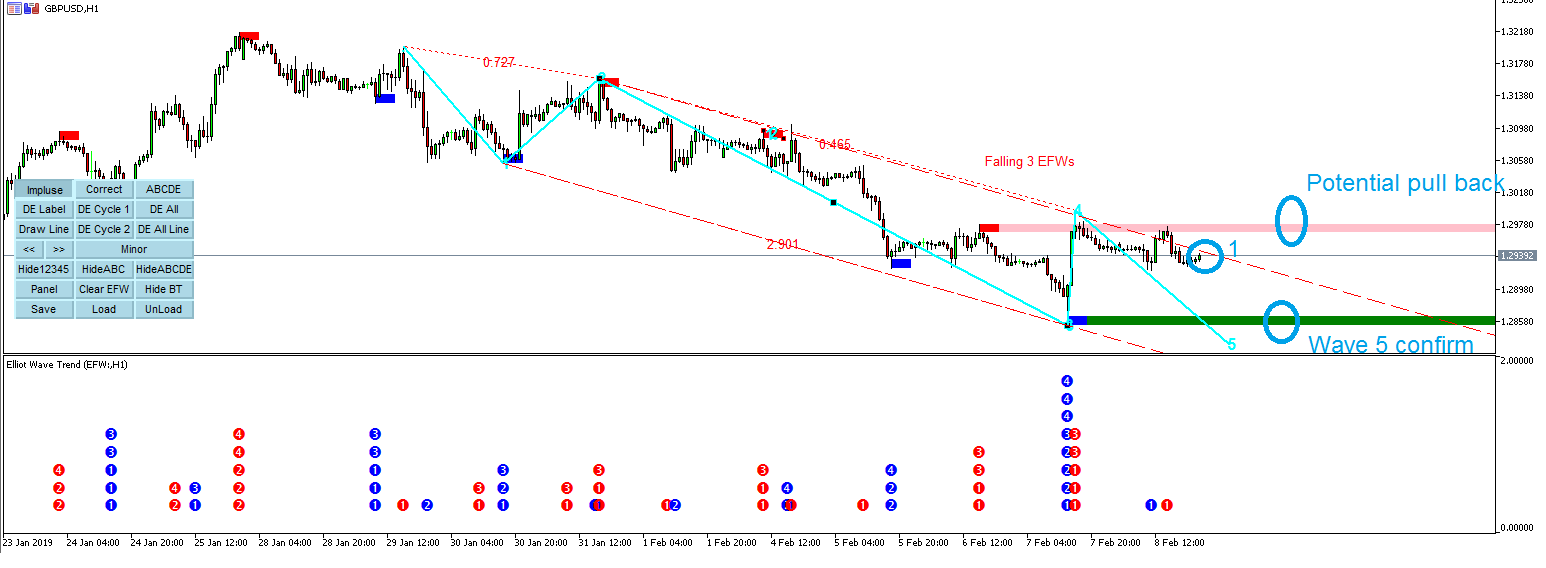
Most advanced Elliott Wave Software for your Trading
Elliott Wave Trend is the most advanced Elliott Wave Trading software, which helps you to trade with various Elliott Wave patterns like Wave .12345 pattern and Wave .ABC and Wave .ABCDE, etc. Elliott Wave Trend was built on the concept of Precision Trading with Elliott Wave Structure Score. Our Elliott Wave Trend is professional tool for professional trader. Yet, the price of it is affordable.
With Elliott Wave Trend, you can also share your analysis with your Friend and clients through Elliott Wave Reader.
Our Elliott Wave Trend is available in both MetaTrader 4 and MetaTrader 5 version.
https://algotrading-investment.com/2018/10/25/how-elliott-wave-can-improve-your-trading-performance/
Link to Elliott Wave Trend.
http://algotrading-investment.com/portfolio-item/elliott-wave-trend/
https://www.mql5.com/en/market/product/16472
https://www.mql5.com/en/market/product/16479

Young Ho Seo
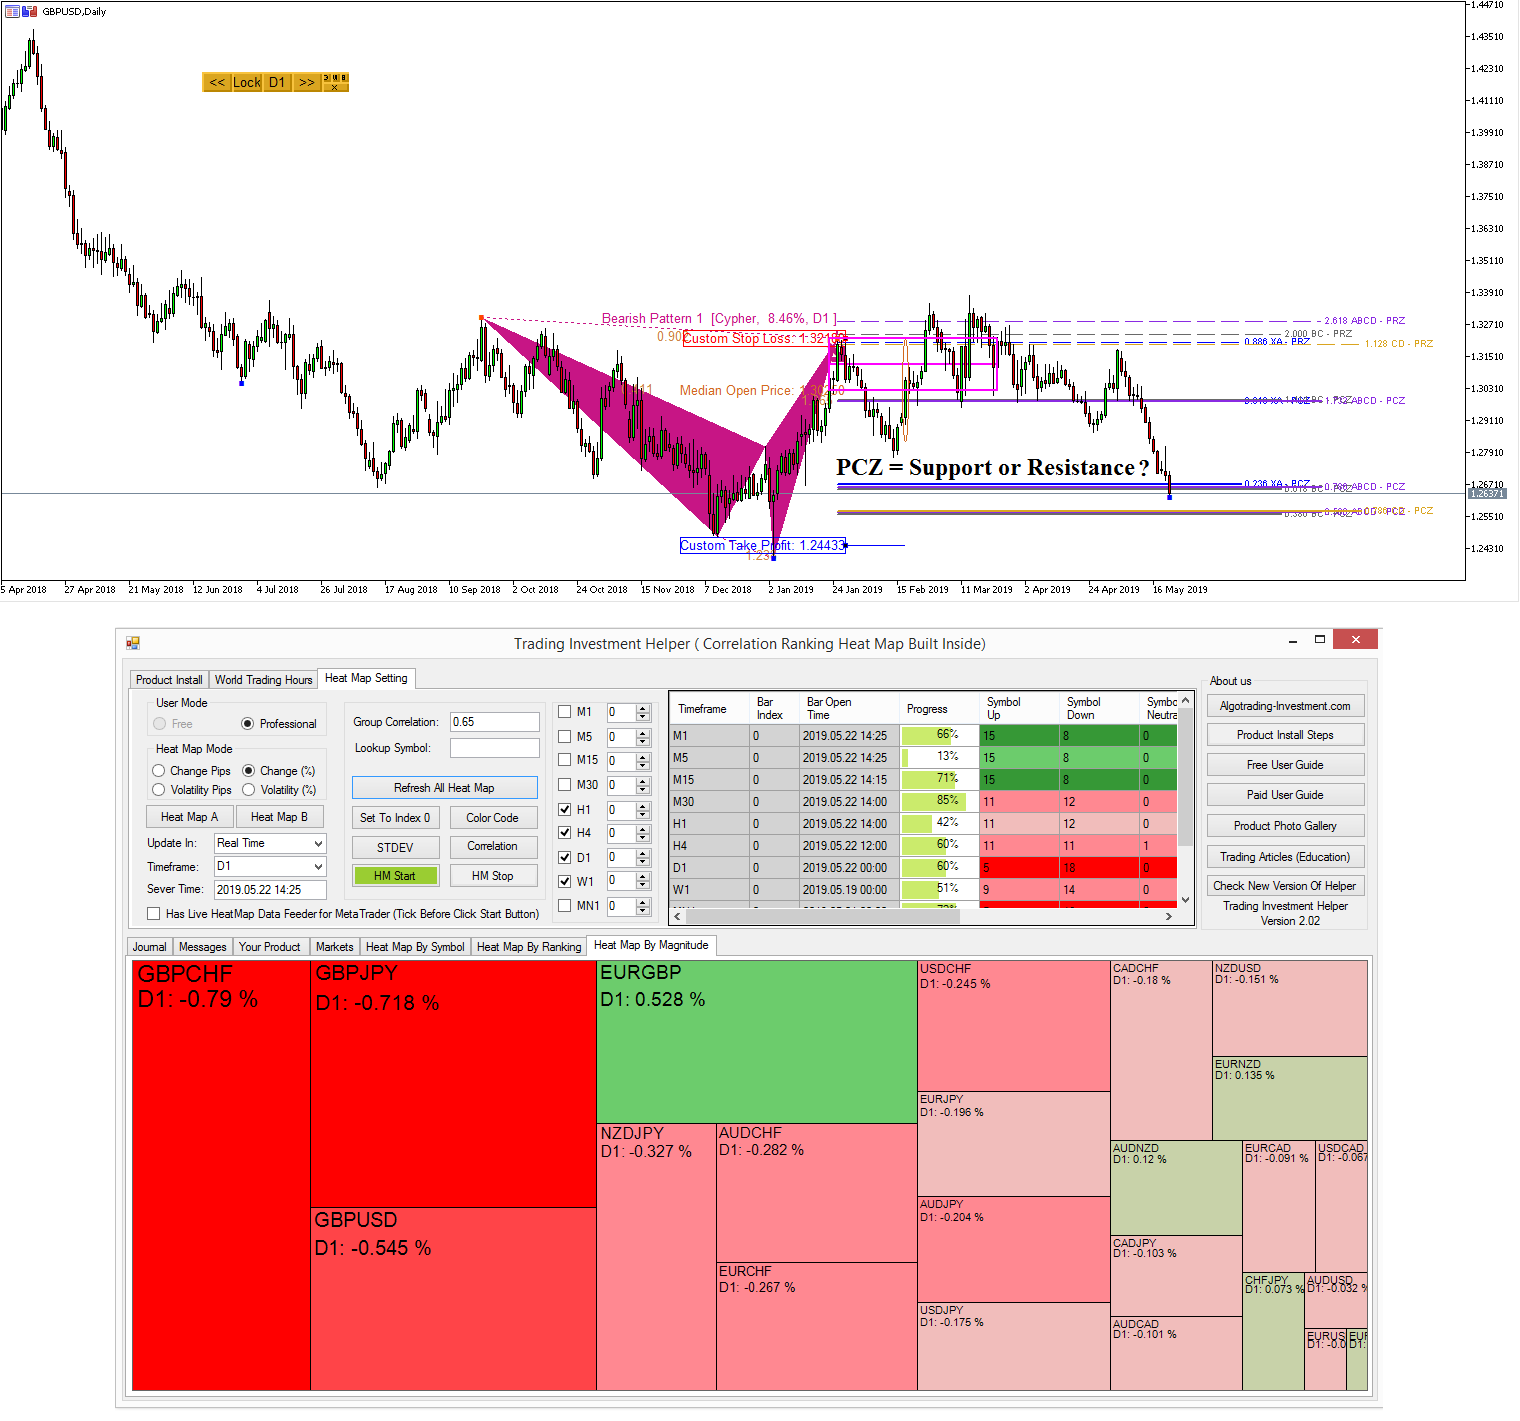
GBPUSD Market Outlook 2 - 21 May 2019
So it is not surprizing that GBPUSD is coming down this far after testing the Potential Continuation Zone of Cypher pattern. We have been already given you this hints for few weeks now. We hope you are squeezing more profits.
Here is the link to our Excellent Harmonic Pattern Indicators for MetaTrader 4/MetaTrader 5.
http://algotrading-investment.com/portfolio-item/harmonic-pattern-scenario-planner/
https://www.mql5.com/en/market/product/6101
https://www.mql5.com/en/market/product/6240

Young Ho Seo
How to Stop Bad Harmonic Pattern Trading with Correlation Analysis
In this article, we will be discussing how to filter out some of bad harmonic pattern trading with the relationship between different instruments. When I use Harmonic Pattern alone for my trading, probably with some technical indicators together, I feel pretty guilty. It is because many text books will recommend you to use the inter-market analysis as part of our prediction.
Including myself, most of readers reading this article will probably not able to go that far with the inter-market analysis. I will explain the reason why in step by step.
Firstly, this is the simple definition of inter market analysis from:
https://stockcharts.com/school/doku.php?id=chart_school:market_analysis:intermarket_analysis
"Inter-market analysis is a branch of technical analysis that examines the correlations between four major asset classes: stocks, bonds, commodities and currencies."
I think this definition is brief and practical too. I like it personally. However, can any one practice this inter-market analysis readily ? Maybe yes or no? Which side are you on? Probably more Nos, I guess.
To use this sort of analysis in our trading, we need to have both the market data in real time plus skills to analyze them. So having skills and the real time market data is the first obstacle for us.
Then what is next obstacle ? Let's say that we have real time market data in Excel or Matlab or SAS, or SPSS, etc? What then ? You need to start to create bunch of Excel formula or try to write scripts in Matlab to setup data streaming from whatever sources.
Then you need to decide on how to deal with those missing data because Stock, exchange rate and bonds data are never clean. It is just headache after headache.
To just get started, we need a lot of hard efforts. If you are trained proficiently in using one of those script language or Excel formula is another significant matter.
Understanding correlation is one thing but if your technical skills does not support you, then your understanding on correlation is probably useless. So your technical skills might be your second obstacle in going forward with inter-market analysis.
I think there are more obstacles here but let us just move on because these obstacles are enough to give us headache anyway.
I think most of us are not ready to use the inter-market analysis.
However, everyone want to produce more profits. We know that relying on just one currency symbol or one stock market symbol is not sufficient, or at least if you want to go ahead of other trader.
Harmonic pattern trading is good but still its signal is based on one symbol data (or time series) without looking other data.
This is exactly why I created the concept of Correlation Ranking Heat Map. The concept is probably not exactly same as the inter market analysis. But still it is similar in a way it uses multiple symbols as part of our strategy.
This is totally different type of information from technical indicators or patterns, etc based on the price series of one symbol.
So let us see how this fresh piece of information can improve our harmonic pattern trading. In Correlation Ranking Heat Map, you can quickly search how other correlated symbols are doing in regards to your trading symbol.
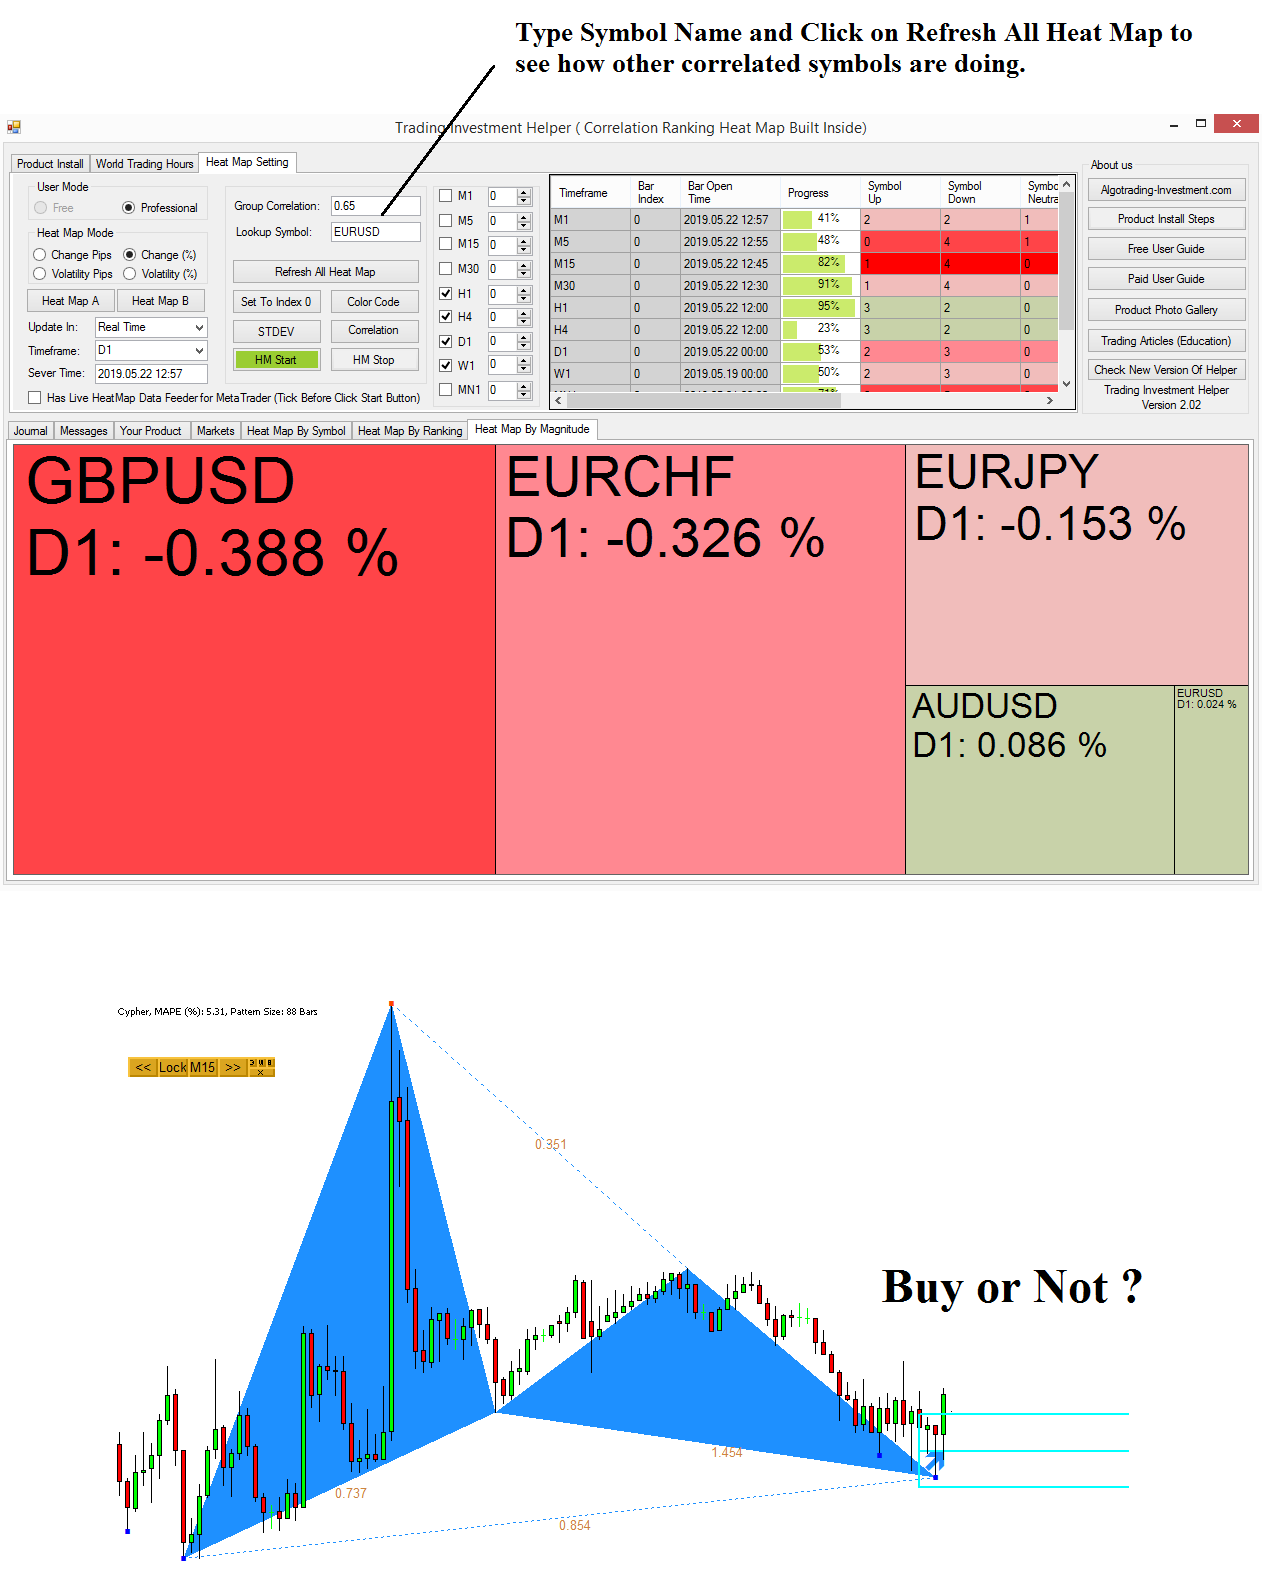
Say that you have the bullish harmonic pattern in EURUSD in M15 Chart as shown in screenshot. Now you are thinking to buy or not. After you have applied other technical indicators, there is still room for improvement.
Then you will check how other correlated symbols like GBPUSD, EURCHF, EURJPY, AUDUSD, etc are doing with EURUSD.
If these symbols (i.e. correlated group) are more of bearish, then at least you should not aiming to hold your buy position long. If the correlated symbols of GBPUSD, EURCHF, EURJPY, AUDUSD are strongly bearish, then it is better to skip your buy trade.
Then what is the logic behind this ? In the financial market, any news or economic data release affect part of the market instead of just one single symbol.
Hence, highly correlated symbols will move in the same direction together when there is influencing news or during any economic data release.
In fact, using correlation, we are checking what part of the market was influenced or moved by these financial news or economic data release.
Typically this type of analysis can be done manually using some sort of supply and demand relationship by professionals. They will start to collect the highly influential news or economic data release first, then they will start to analyze how those news or data will affect the supply and demand of the symbol they want to trade.
We know that well. Once again, who would go through all the hassle of this manual economic analysis ? Just getting degree in that will take 5 to 6 years and another 5 years on adding some work experience on to it.
So let this mechanical tool, Correlation Ranking Heat Map do the same job automatically instead.
Currently, you can get it as MetaTrader add-On ( = built inside Trading Investment Helper)
https://algotrading-investment.com/portfolio-item/correlation-ranking-heat-map/
or in our Optimum Chart, you can access to the full version of correlation Ranking Heat Map without incurring another separate payment. In our Optimum Chart, you can use Correlation Ranking Heat Map for US Stock market too if you buy US stock market license.
https://algotrading-investment.com/2019/04/02/optimum-chart/
Here is the link to our Excellent Harmonic Pattern Indicators for MetaTrader.
http://algotrading-investment.com/portfolio-item/harmonic-pattern-scenario-planner/
https://www.mql5.com/en/market/product/6101
https://www.mql5.com/en/market/product/6240

Young Ho Seo
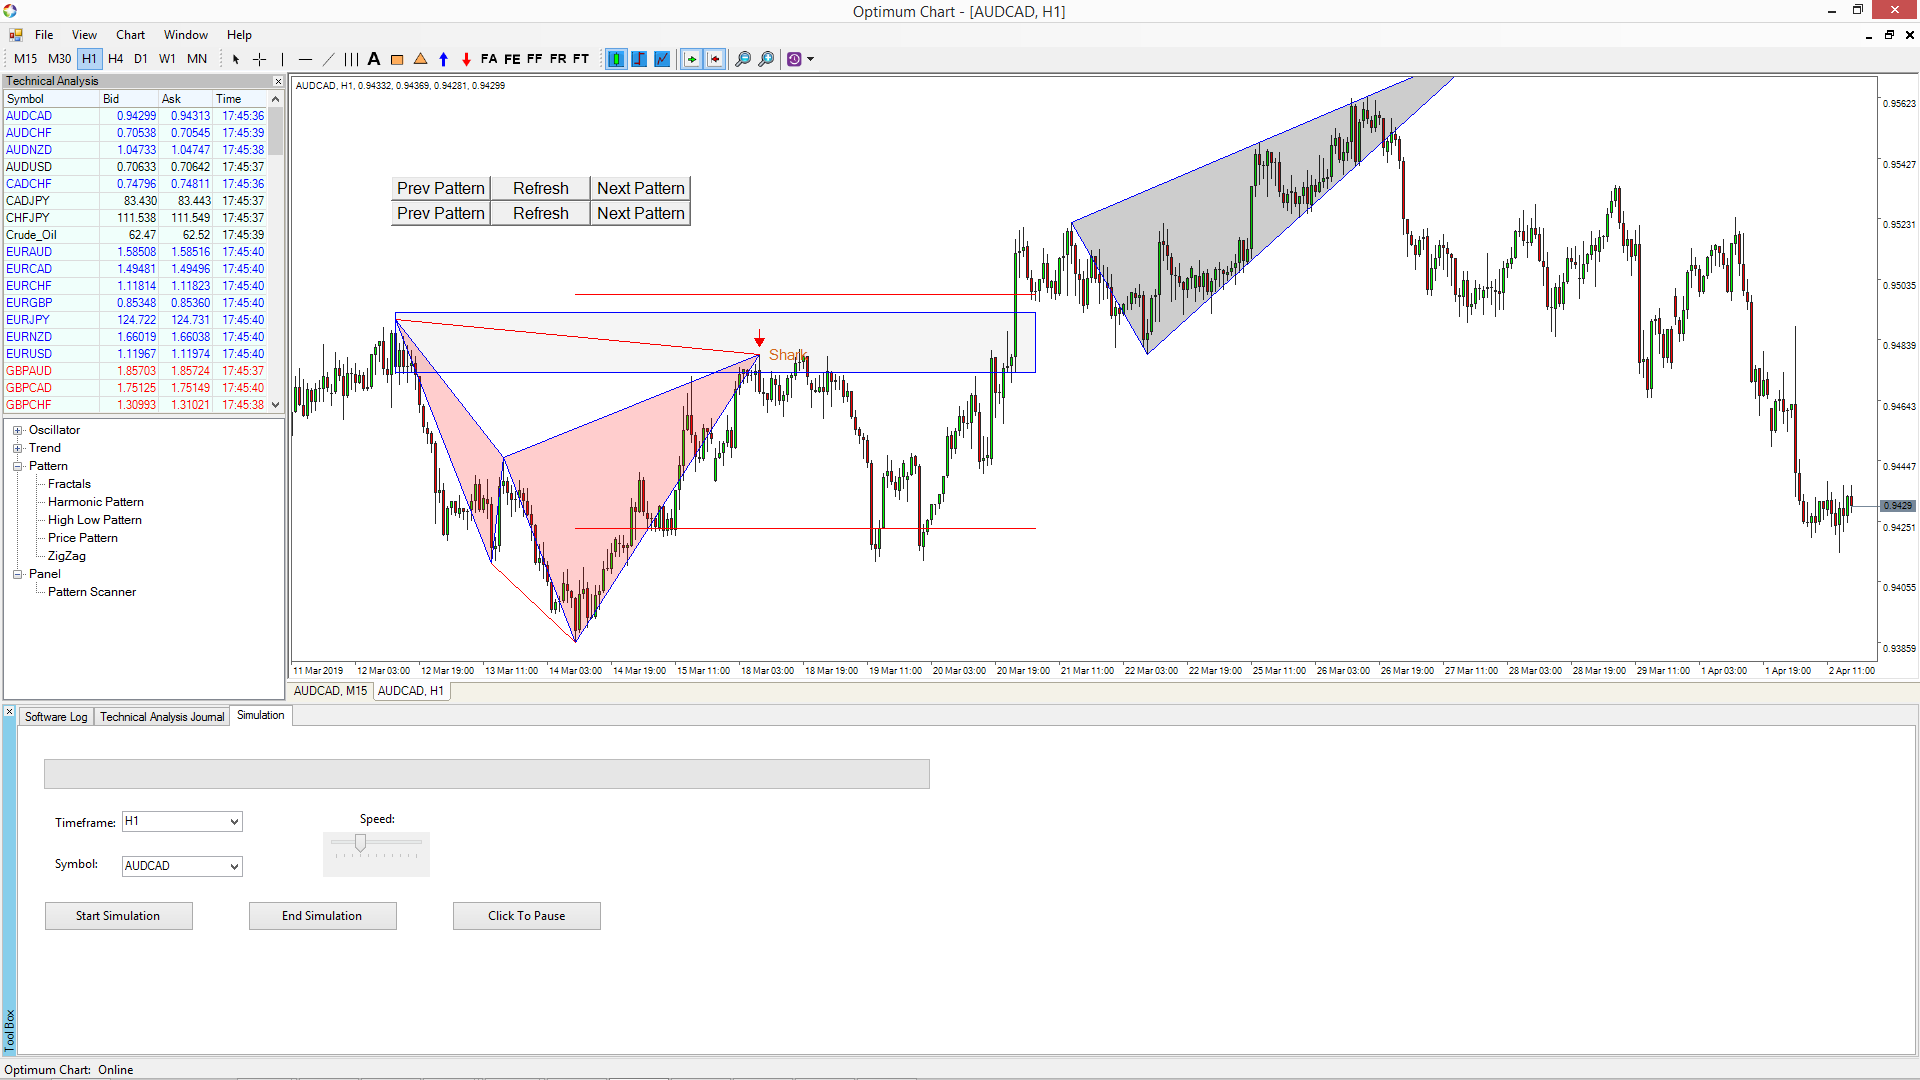
Optimum Chart Simple Intro 1 Video
Optimum Chart is the Standalone Charting and Signal Platform for Forex and Stock Market. It is all in one platform helping you to access all the powerful buy and sell signals in one payment. Simple introduction video can be found here:
YouTube Video link: https://www.youtube.com/watch?v=qaxYVryvo4c
https://algotrading-investment.com/2019/04/02/optimum-chart/

Young Ho Seo
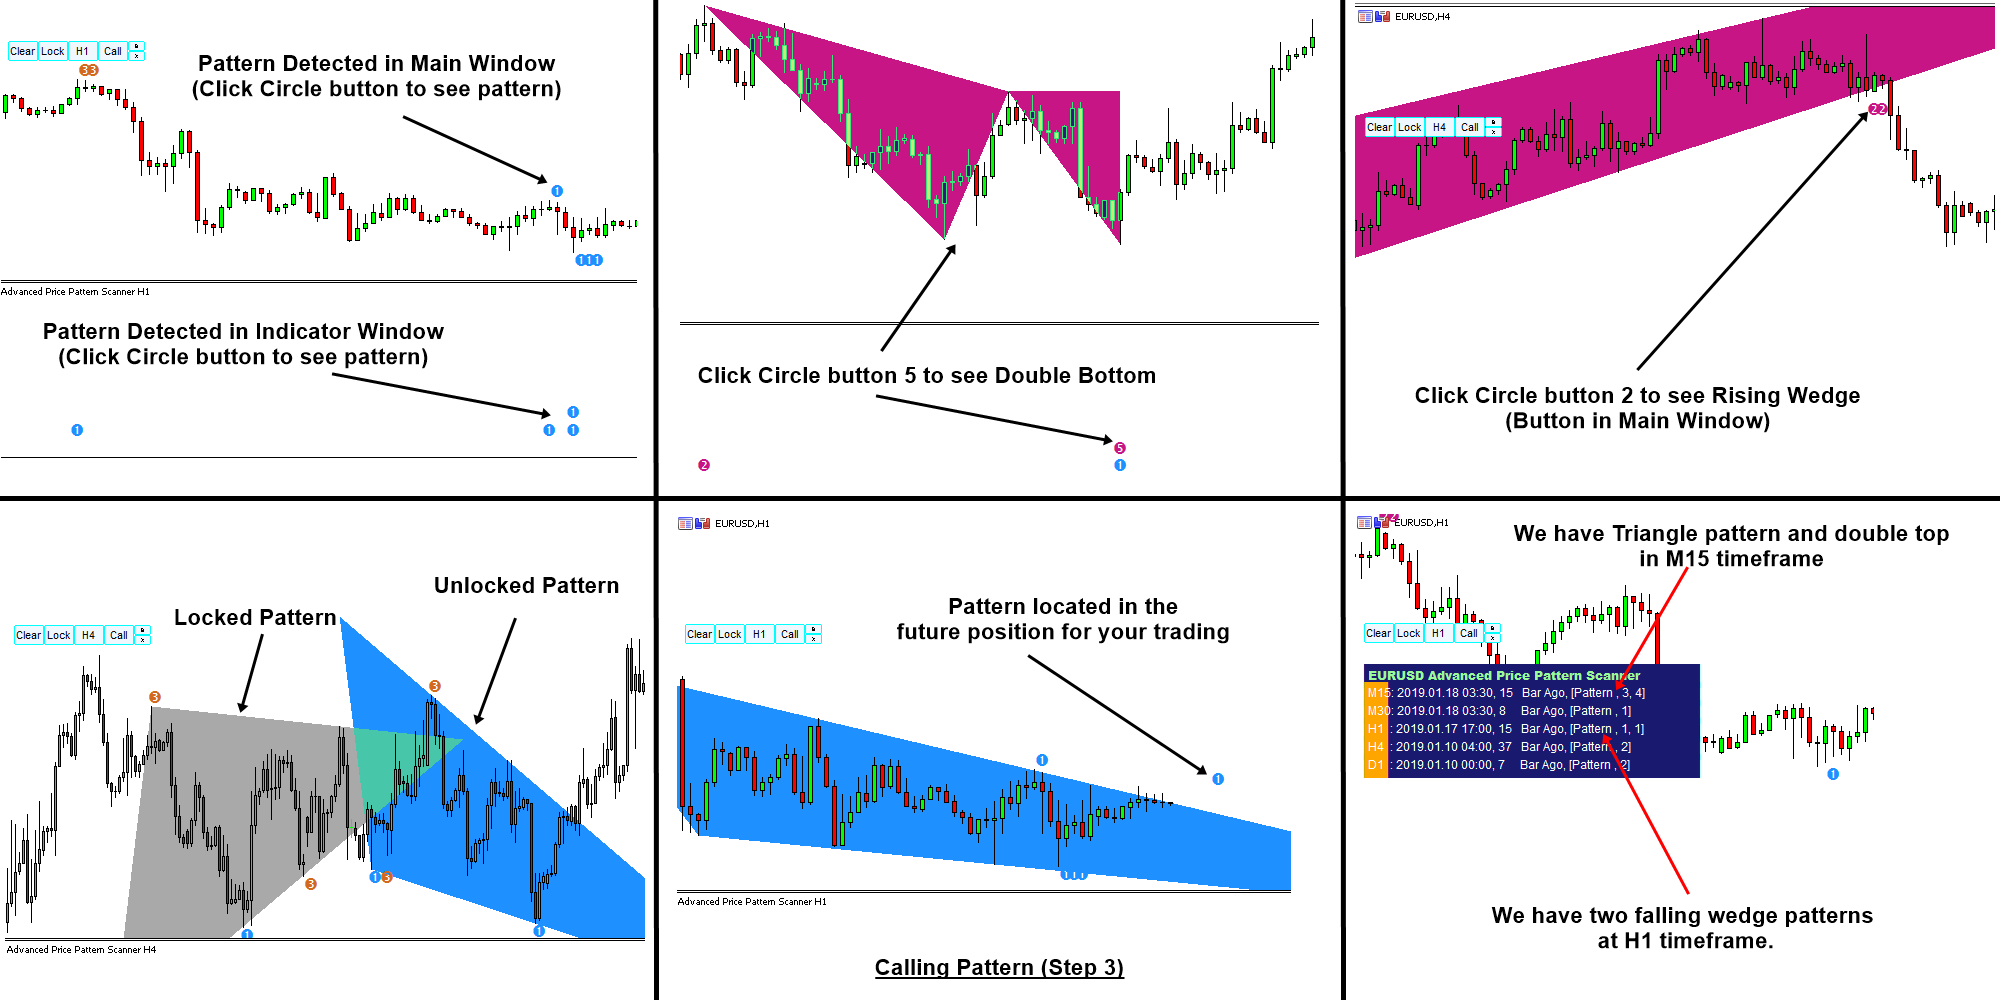
Introduction
Advanced Price Pattern Scanner is the pattern scanner built upon our accumulative knowledge and insight from our financial market research many years. Advanced Price Pattern Scanner uses highly sophisticated pattern detection algorithm. However, we have designed it in the easy to use and intuitive manner. Advanced Price Pattern Scanner will show all the patterns in your chart in the most efficient format for your trading.
Detectable Patterns
Following pattern can be detected.
Triangle (Pattern Code = 0)
Falling Wedge (Pattern Code = 1)
Rising Wedge (Pattern Code = 2)
Double Top (Pattern Code = 3)
Double Bottom (Pattern Code = 4)
Head and Shoulder (Pattern Code = 5)
Reverse of Head and Shoulder (Pattern Code = 6)
Cup and Handle or Cup with Handle (Pattern Code = 7)
Reverse of Cup and Handle or Cup with Handle (Pattern Code = 8)
Main Functionality
Pattern Detection in Indicator Window: Detected Patterns are located in the indicator window for your market analysis. To view or hide, just click the Circle button in the indicator window.
Pattern Detection in Main Window: Detected patterns are also located in the main window for your market analysis. To view or hide, just click the circle button in the main window.
Call Patterns: You can also call any patterns at the desired location in your chart. To access Call Pattern feature, click call button. Now you will have pointer in your chart. Move the pointer anywhere in your chart to located patterns, then click “Call” button again. You will see patterns corresponding to the location of pointer.
Multiple Timeframe Pattern Detection: You can also scan above patterns across different timeframe from one indicator. You can also switch on and off any specific timeframe per your need. Please note that Multiple Timeframe Pattern Detection requires much heavier computation.
Pattern Locking: You can also lock any patterns in your chart for your future use. Just click over Lock button to lock patterns in your chart.
https://algotrading-investment.com/portfolio-item/advanced-price-pattern-scanner/
https://www.mql5.com/en/market/product/24679
https://www.mql5.com/en/market/product/24678

Young Ho Seo
GBPUSD Market Outlook - 21 May 2019
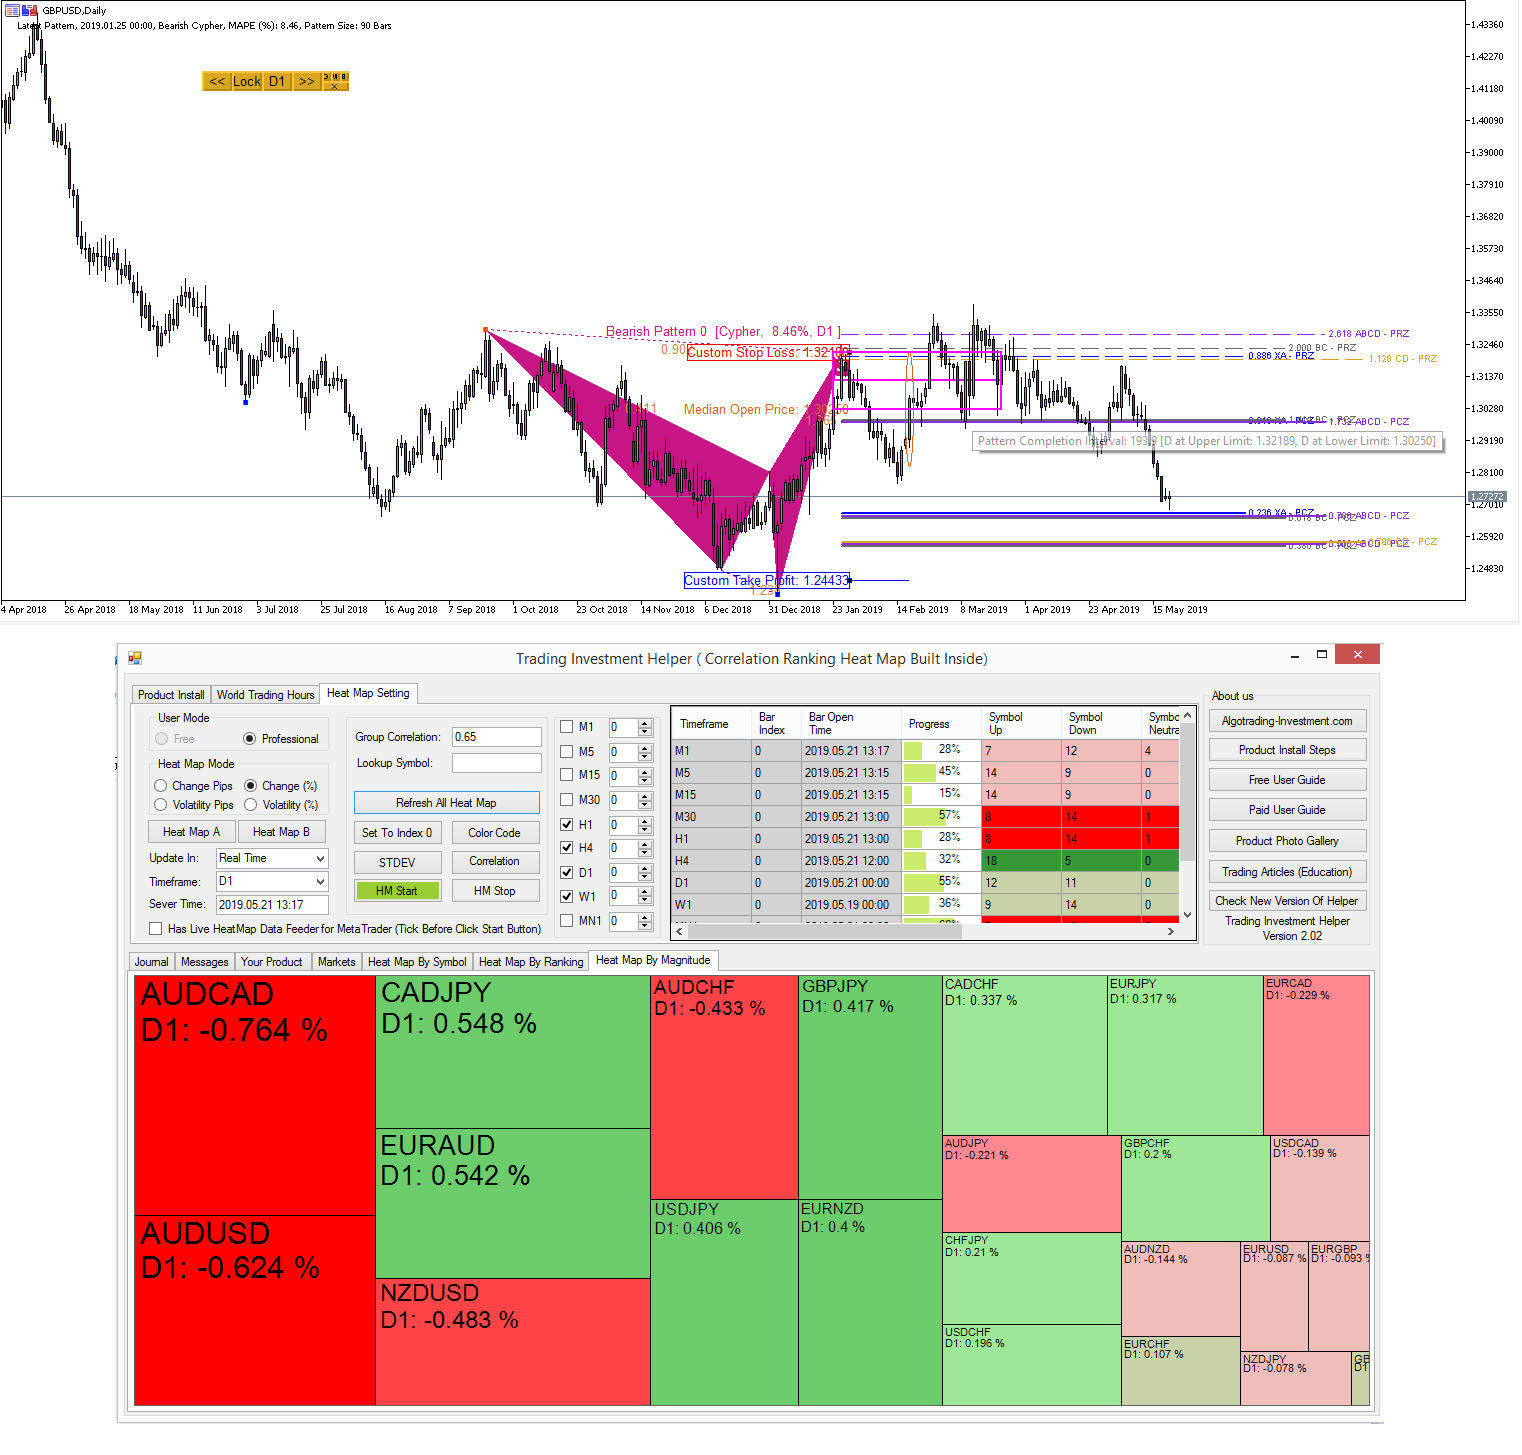
I am closely watching any further new with Iranian situation further. This could be another bomb in the market. At the moment, both parties are quite. Hope things are not getting worse. Today, market is pretty even between bull and bear. As we were expected, GBPUSD made its first test on Potential Continuation Zone. We were counting this level some days for now.
By the way, potential continuation zones are only provided inside our harmonic pattern plus, harmonic pattern scenario planner and optimal turning point pattern scanner.
http://algotrading-investment.com/portfolio-item/harmonic-pattern-plus/
https://www.mql5.com/en/market/product/4488
https://www.mql5.com/en/market/product/4475

Young Ho Seo
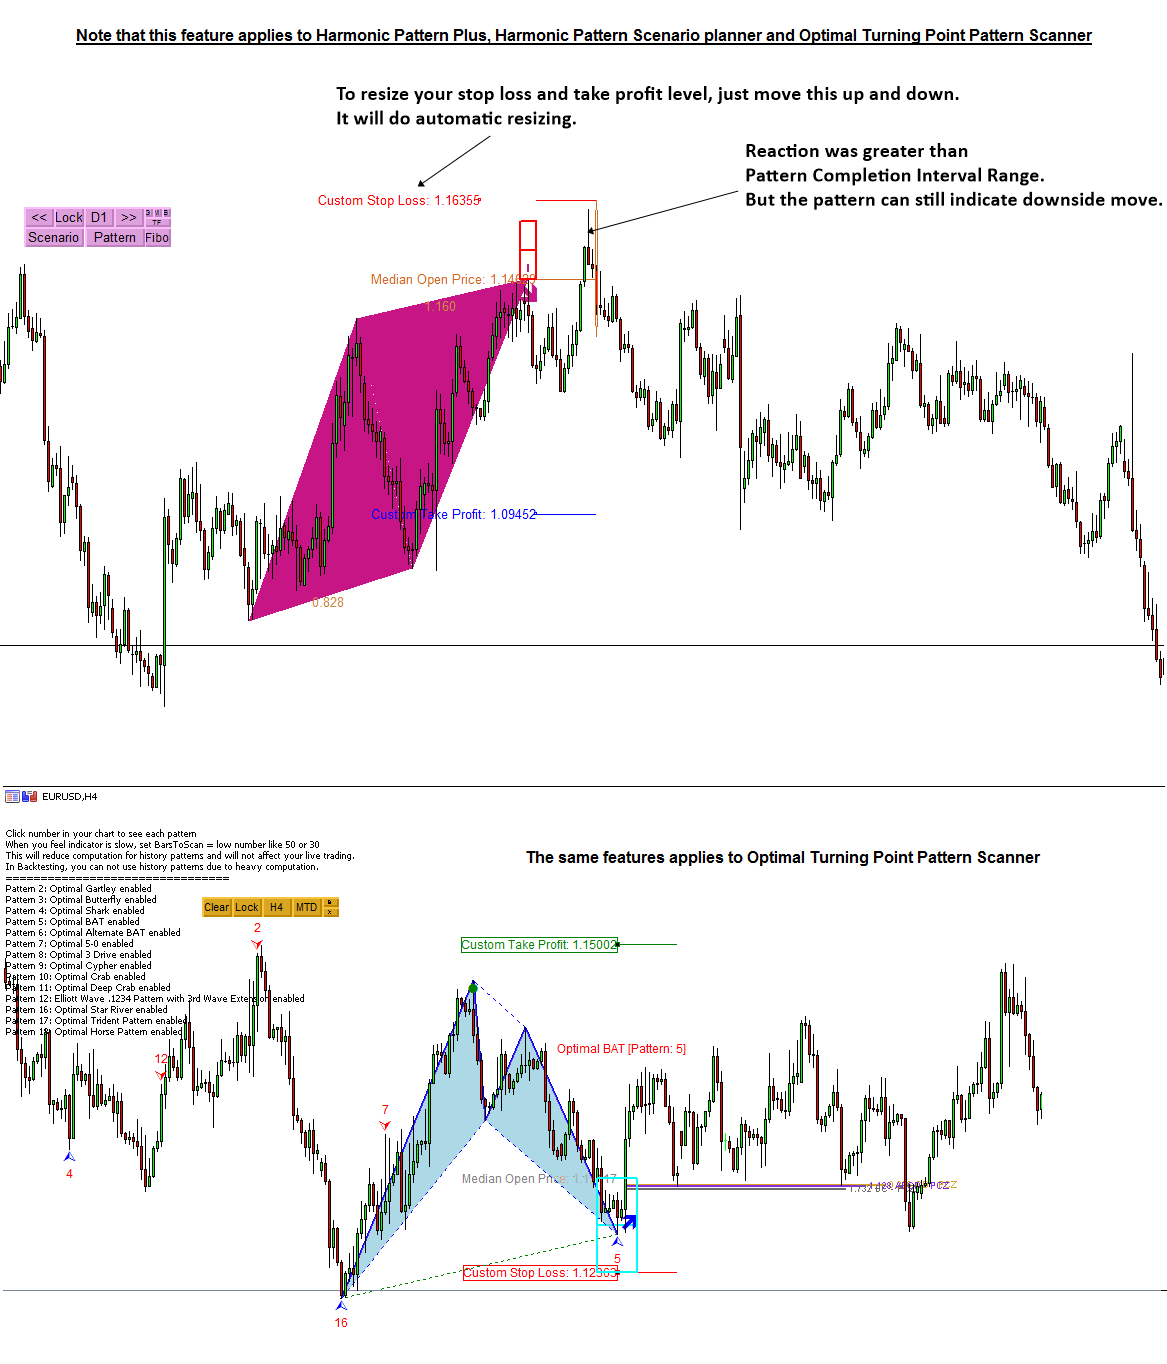
Automatic Resizing your Stop Loss and Take Profit Level with Harmonic Pattern Plus (Harmonic Pattern Scenario Planner)
Having understood all the concept behind the Pattern Completion Interval, you might observe that sometime price can react outside the pattern completion interval. Sure, there is nothing perfect in the world. As long as you understand the pros and cons of using large stop loss size, it is still fine to control your own stop loss size.
However, we still prefer to express stop loss size in terms of pattern completion interval range for convenience. For example, if the original stop loss size was equal to 1 x pattern completion interval, you can certainly use 1.5 x pattern completion interval or 2 x pattern completion interval.
Another consideration before you are using pattern completion interval, if you can enter the market at the competitive price, then you can feel less guilty when you increase your stop loss size because you are still remaining good rewards/Risk ratio. On the other hands, if you have entered market at not so competitive price, then you might be cautious when you increase your stop loss size.
The same feature applies to Optimal Turning Point Pattern Scanner (Non Repainting and Non Lagging Harmonic Pattern and Elliott Wave pattern scanner.)
Hope this less is helpful for junior traders.
To visit our website, follow the links below:
https://www.mql5.com/en/market/product/4488
https://www.mql5.com/en/market/product/4475
https://www.mql5.com/en/market/product/6240
https://www.mql5.com/en/market/product/6101
http://algotrading-investment.com/portfolio-item/harmonic-pattern-plus/
http://algotrading-investment.com/portfolio-item/harmonic-pattern-scenario-planner/

Young Ho Seo
GBPUSD Market Outlook - 20 May 2019
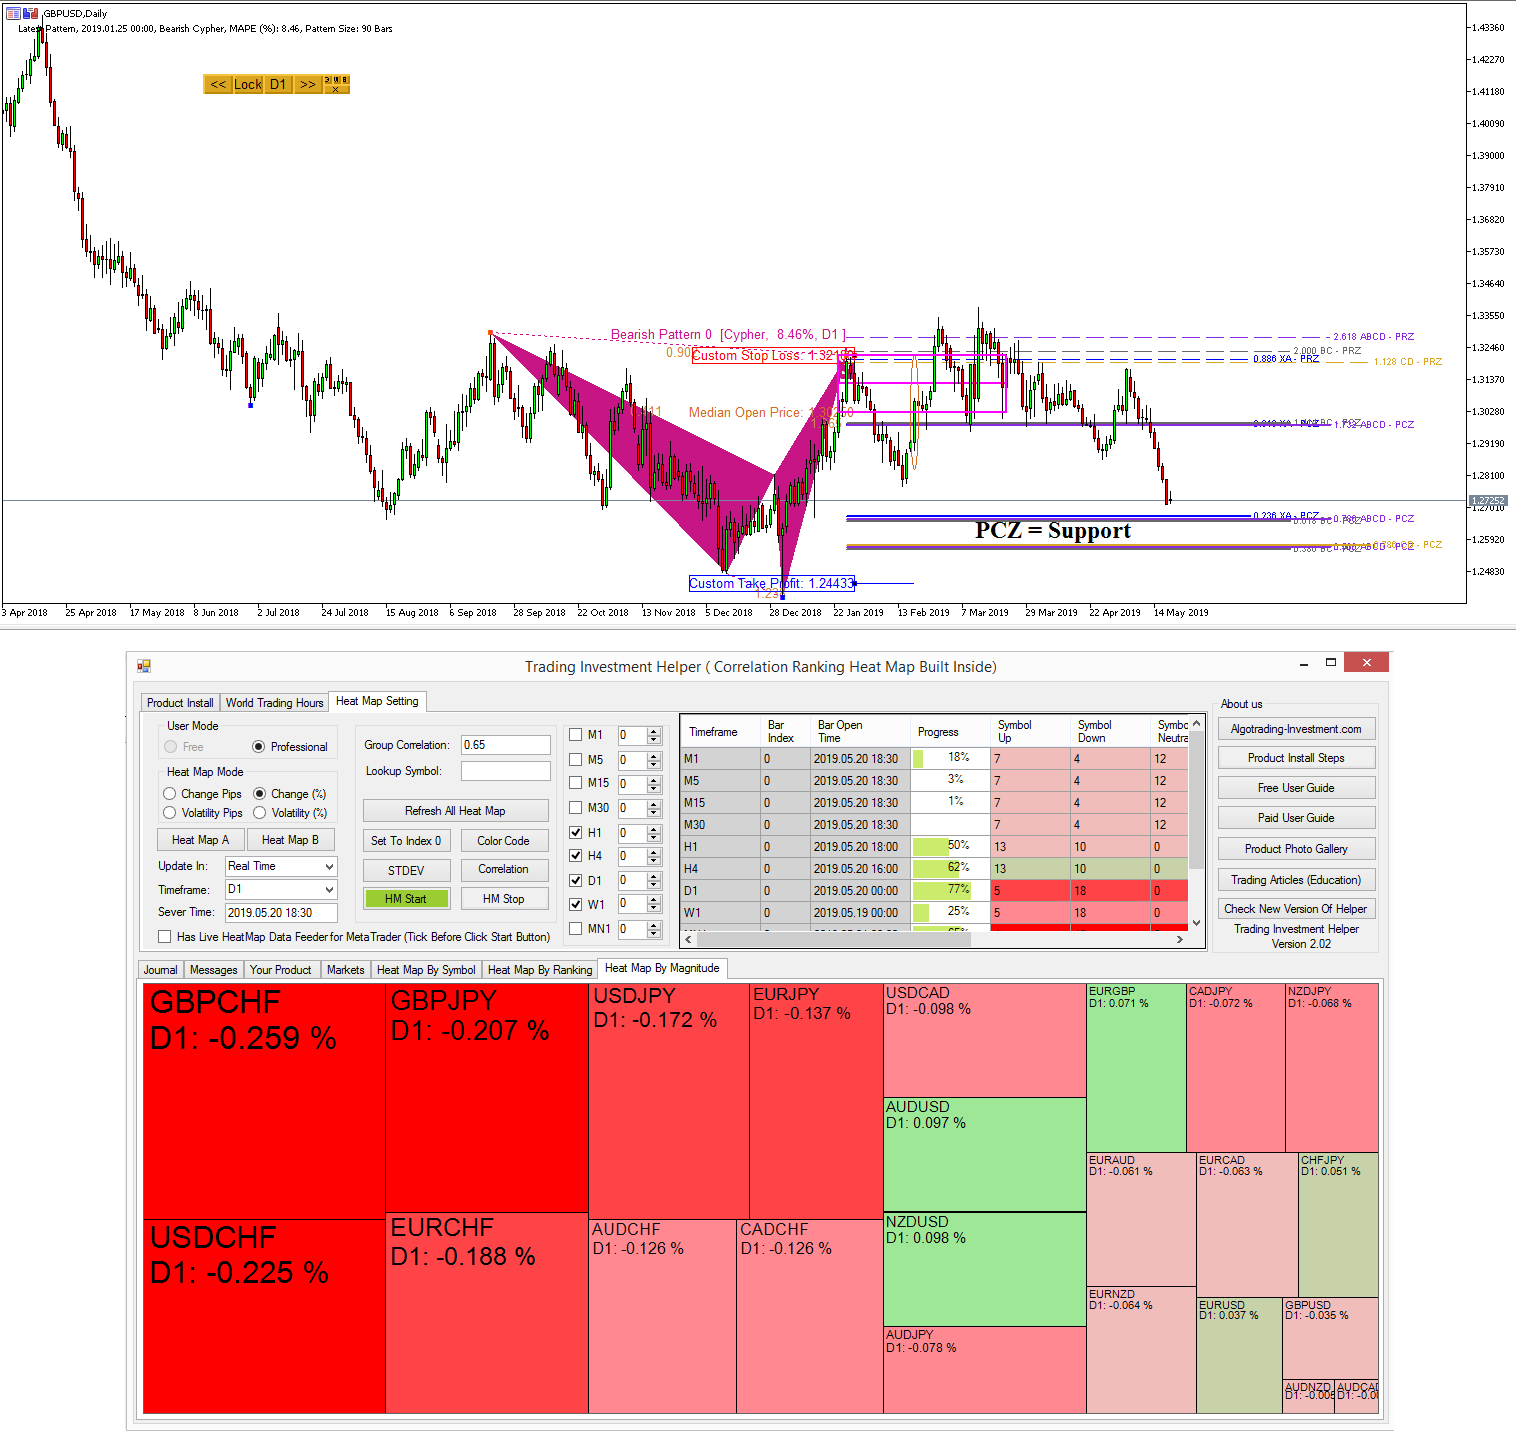
Gradually bearish sentiment was growing last few hours. Most of Forex symbols are experiencing some bearish fall. It is mild for GBPUSD. We still think the potential continuation zone of Cypher pattern is important for your trading. Check the screenshot.
http://algotrading-investment.com/portfolio-item/harmonic-pattern-plus/
https://www.mql5.com/en/market/product/4488
https://www.mql5.com/en/market/product/4475

Young Ho Seo

Variations of Gartley Pattern Explained
As you have demonstrated in our research, each pattern will give you absolutely different performance per each symbol and per each timeframe. To meed this need, the patterns in Optimal Turning Point Pattern Scanner is modifiable. This is simple tutorial demonstrating how to create variations of Gartley Pattern.
1) Gartley Pattern with 0.618 shape ratio
Gartley pattern with 0.618 ratio can be expressed in two lines:
Structure – N: 3, C0: 0.618 to T0: 3
Ideal Ratio – S0: 1.272, S1: 0.382 -0.886, S2: 0.618
What does above two lines say ? Here is detailed description.
N: 3 ==> This pattern consists of 3 small triangles.
C0: 0.618 to T0: 3 ==> The ratio of big triangle made up from first three small triangle is 0.618.
That is it. Now ideal ratio part describe the ratio of each small triangle inside the big triangle.
S0: 1.272, S1: 0.382 -0.886, S2: 0.618 ==> ratio of first small triangle is 1.272 and ratio of second small triangle is between 0.382 and 0.886. Finally, ratio of third triangle is 0.618.
I hope you are following up here. Now next, you want to fine tune your Garltey pattern because you believe 0.650 of overall ratio and the 1.618 ratio can perform better (= better profit). So how do we create new pattern with 0.650 overall ratio with 1.618 ratio (=ratio of first triangle). It is as simple as that.
Structure – N: 3, C0: 0.650 to T0: 3
Ideal Ratio – S0: 1.618, S1: 0.382 -0.886, S2: 0.618
C0: 0.650 to T0: 3 ==> Now, overall shape ratio is 0.650 instead of 0.618.
S0: 1.618, S1: 0.382 -0.886, S2: 0.618 ==> We have changed first rato to 1.618 from 1.272.
What is even more ? You want to add one more triangle to Gartley Pattern structure. So you want to have four triangles instead of three triangles. It is simple and easy to do so.
Structure – N: 4, C0: 0.618 to T0: 3
Ideal Ratio – S0: 1.618, S1: 0.382 -0.886, S2: 0.618, S3: 0.382-0.886
N: 4 ==> now we have four triangles
S0: 1.618, S1: 0.382 -0.886, S2: 0.618, S3: 0.618 ==> this line ensure that we have ratios for each of four triangle. Our last triangle will have the ratio between 0.382 and 0.886.
This article demonstrates the application of X3 pattern language ( = profit pattern language). In the Optimal Turning Point Pattern Scanner, you have the full freedom to create any pattern. You simply choose more profitable pattern for your trading. That is the mathematical meaning of optimization.
With optimal Turning point pattern scanner, you can also optimize Elliott Wave Pattern for better profits in scientific way.
Here is the full instruction of X3 pattern framework:
https://algotrading-investment.com/2019/05/15/x3-pattern-framework-for-profitable-patterns-in-the-financial-market/
Here is the link to Optimal Turning Point Pattern Scanner.
https://algotrading-investment.com/portfolio-item/optimal-turning-point-pattern-scanner/
https://www.mql5.com/en/market/product/35602
https://www.mql5.com/en/market/product/35603

Young Ho Seo
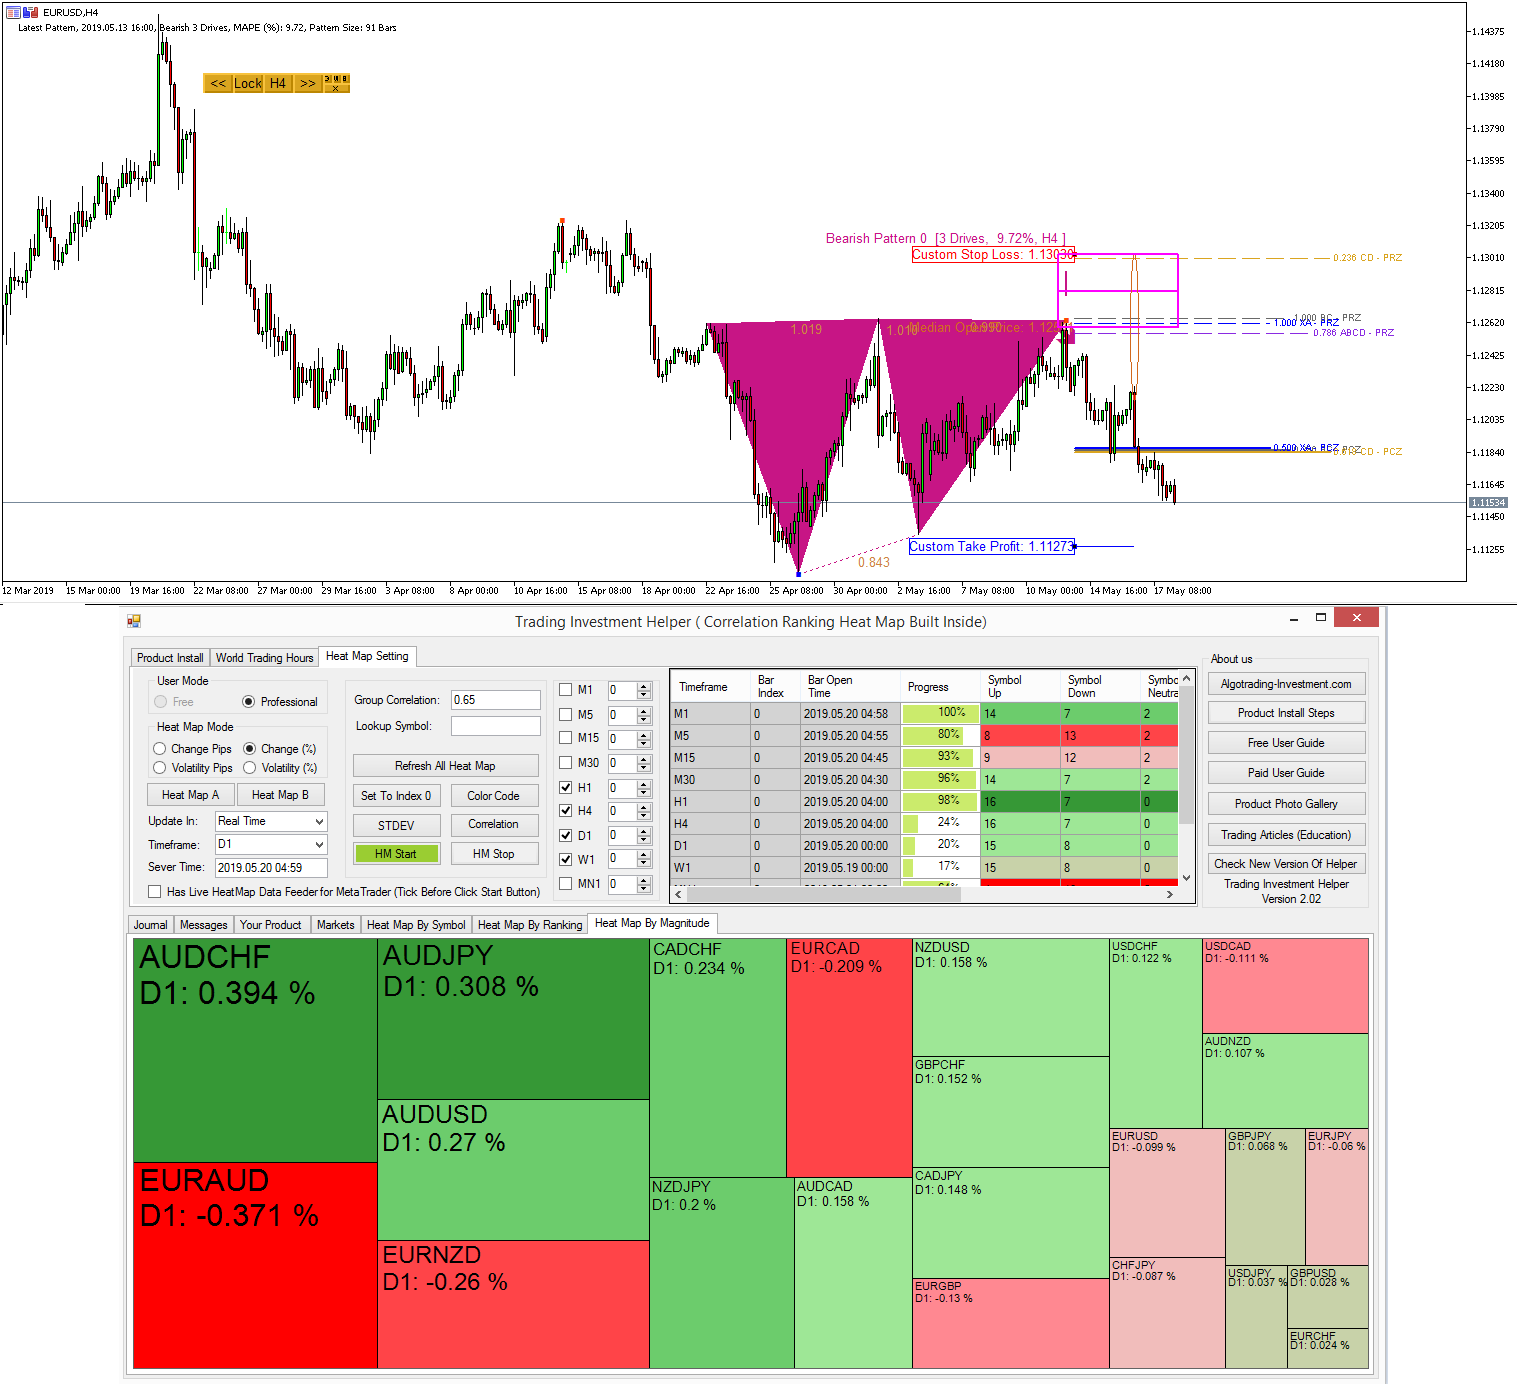
EURUSD Market Outlook - 20 May 2019
Overall, market is mixed state. Of course, last few weeks of bearish fall would react with some sort of correction phase. The question is how long the correction can be. EURUSD is pretty moderate in terms of volatility at its start.
http://algotrading-investment.com/portfolio-item/harmonic-pattern-plus/
https://www.mql5.com/en/market/product/4488
https://www.mql5.com/en/market/product/4475

Young Ho Seo
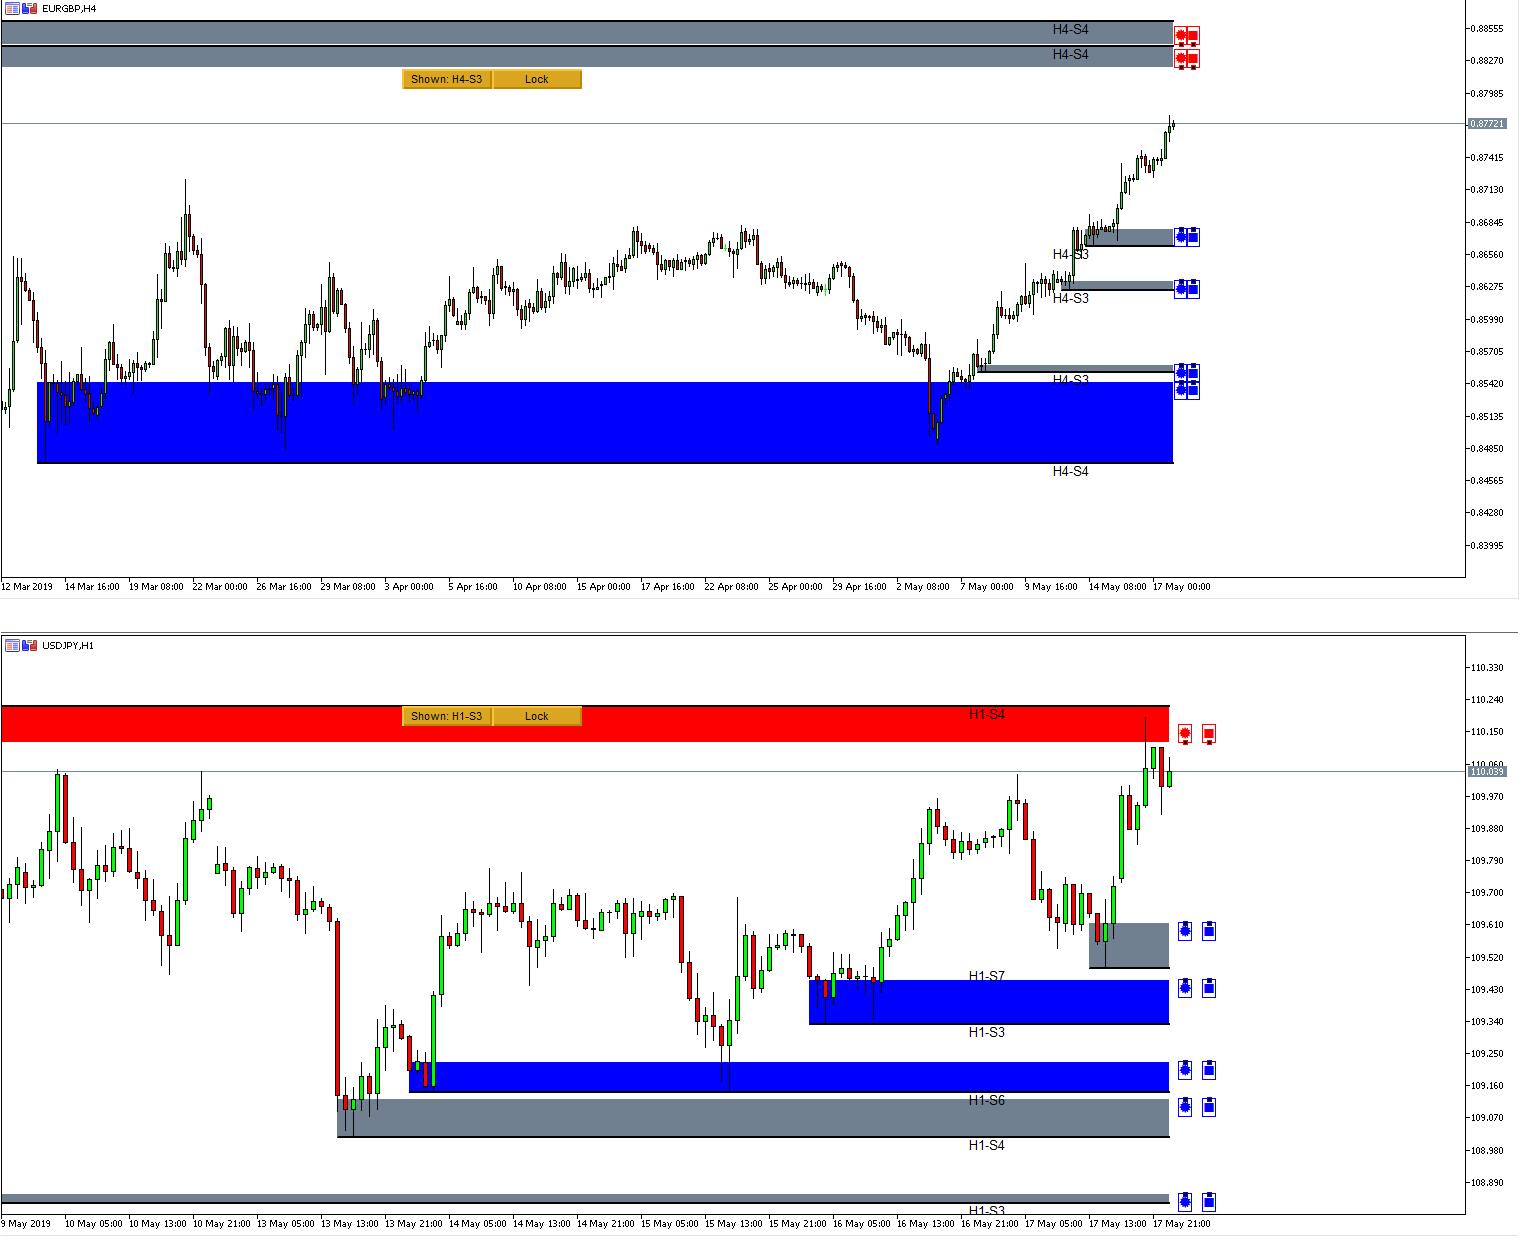
Supply and Demand Zone Analysis for EURGBP and USDJPY – 19 May 2019
Here is the supply and demand zone analysis for EURGBP and USDJPY. I have used H4 timeframe for EURGBP and H1 timeframe for USDJPY. These levels are important to watch next week for your trading.
Here are link to Mean Reversion Supply Demand:
https://www.mql5.com/en/market/product/16851
https://www.mql5.com/en/market/product/16823
http://algotrading-investment.com/portfolio-item/mean-reversion-supply-demand/

Young Ho Seo
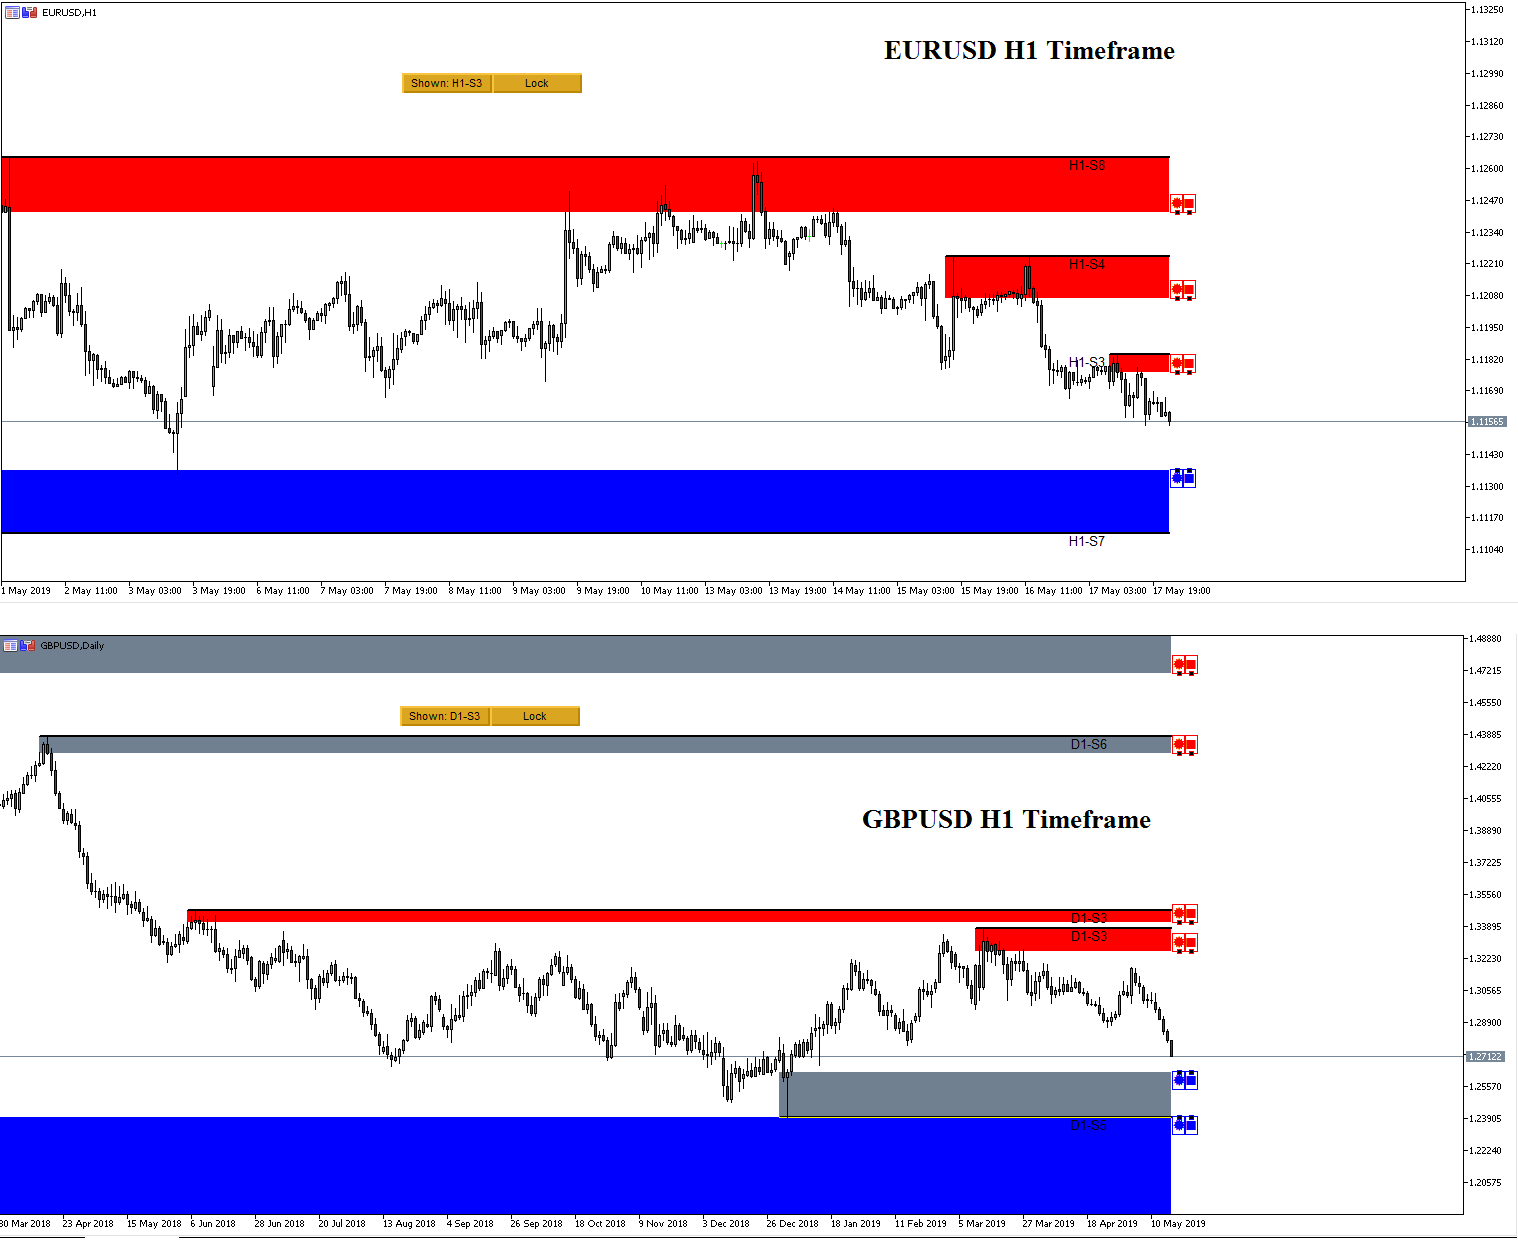
Supply and Demand Zone Analysis for EURUSD and GBPUSD - 19 May 2019
Here is the supply and demand zone analysis for EURUSD and GBPUSD. EURUSD is just 20 pips away to test one of the major demand zone in H1 timeframe. For GBPUSD, it is just 70 pips away to test the demand zone in daily timeframe.
Here are link to Mean Reversion Supply Demand:
https://www.mql5.com/en/market/product/16851
https://www.mql5.com/en/market/product/16823
http://algotrading-investment.com/portfolio-item/mean-reversion-supply-demand/

Young Ho Seo
Mean Reversion Supply Demand Guidelines
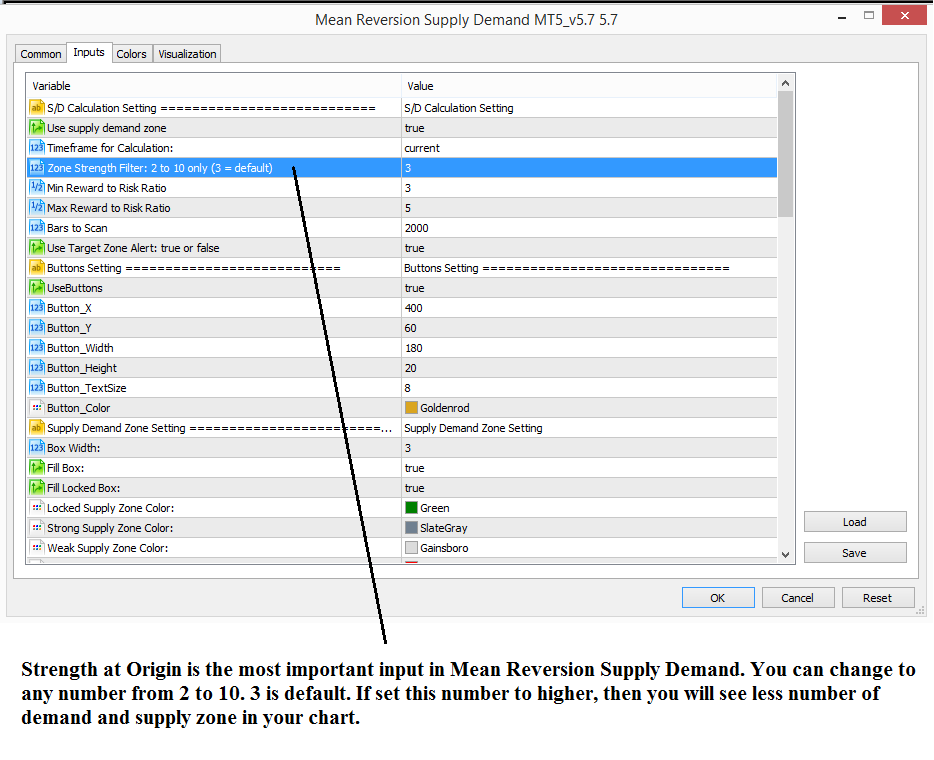
Here are some guidelines for mean reversion supply demand. Mean Reversion Supply Demand is an excellent tool to trade supply demand zone trading. You can use the tool with multiple timeframe format or it will automatically set stop loss and take profit target for you interactively.
Plus our Mean Reversion Supply Demand trading does have “Strength at Origin” input. This input is the same and corresponding input described by Sam Seiden.
In fact we have put it to use between 0 and 2 initially but this input can go over 2.
When it goes over 3, 4 or 5, this means that it more accuarte supply demand trading zone. You can use up to 5 at your own judgement but you might just stay between 0 and 2.
Below is some other guidelines for Mean Reversion Supply Demand. Please read this guides for your own goods:
https://algotradinginvestment.wordpress.com/2017/03/13/simple-instruction-of-mean-reversion-supply-demand/
https://algotradinginvestment.wordpress.com/2017/12/23/mean-reversion-supply-demand-shown-hidden-timeframe-button/
https://algotradinginvestment.wordpress.com/2018/01/25/mean-reversion-supply-demand-multiple-timeframe-analysis/
Here are link to Mean Reversion Supply Demand:
https://www.mql5.com/en/market/product/16851
https://www.mql5.com/en/market/product/16823
http://algotrading-investment.com/portfolio-item/mean-reversion-supply-demand/

Young Ho Seo
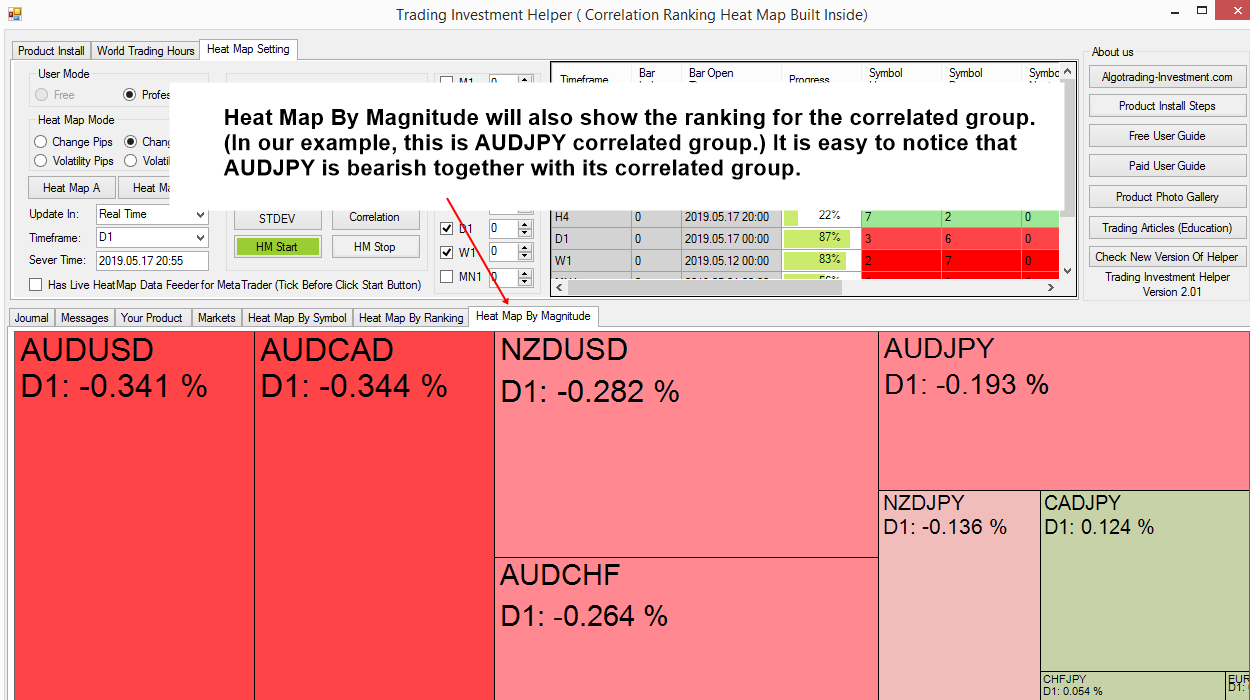
Correlation Ranking Heat Map Version 2.02 Released -18 May 2019
As we have mentioned, we have added many new features to our Correlation Reanking Heat Map new version. The latest version 2.02 can be downloaded from the same link as usual in this link:
https://algotrading-investment.com/download/125329/
Make sure to download new version to access all the latest feature of Correlation Ranking Heat Map, Correlation matrix based trend strength indicator.
https://algotrading-investment.com/portfolio-item/correlation-ranking-heat-map/
https://www.mql5.com/en/users/financeengineer/seller#products

Young Ho Seo
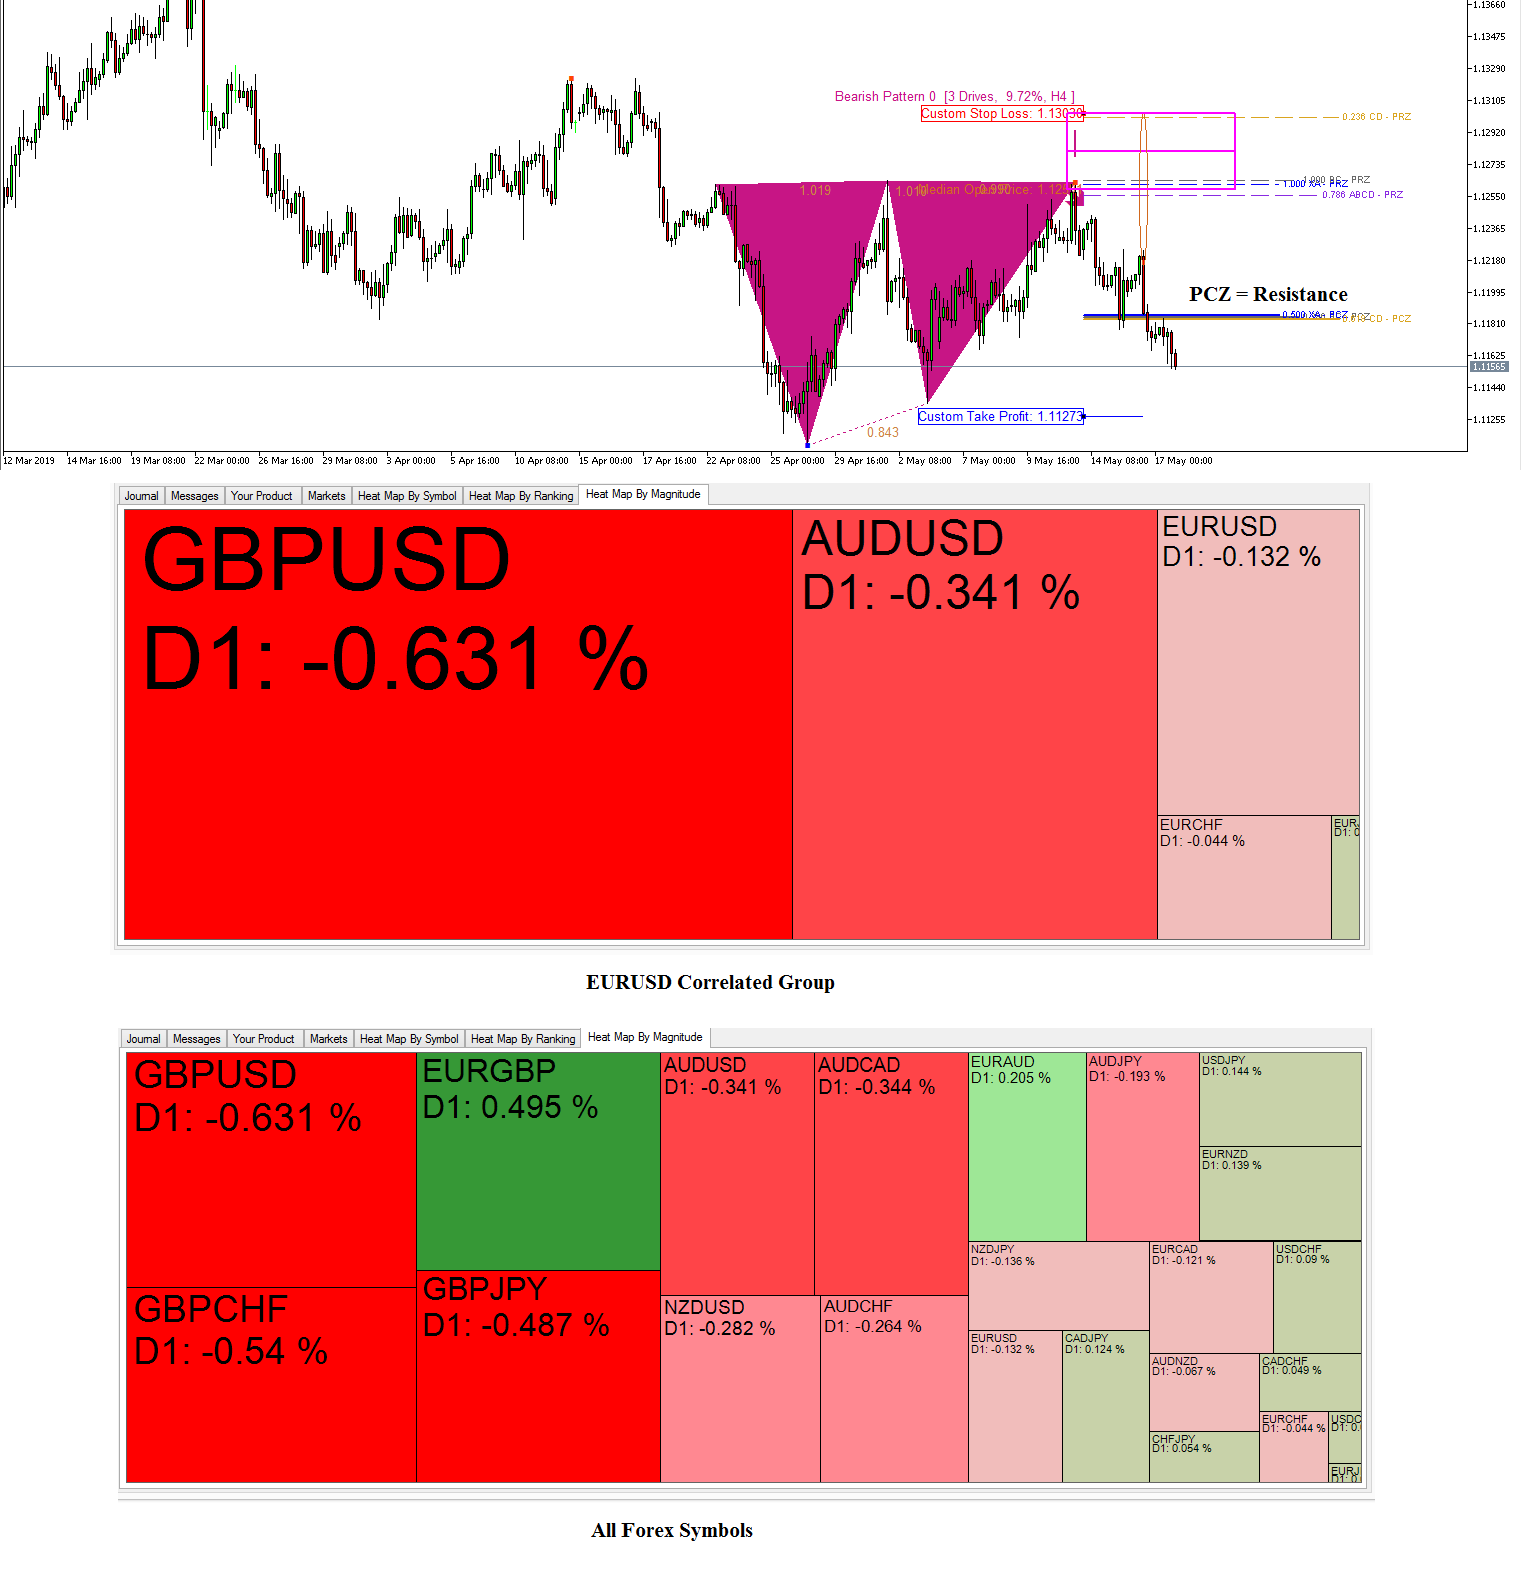
EURUSD Market Outlook- 18 May 2019
3 Drives patterns are still in position for EURUSD. It is moderate but EURUSD is still falling. GBPUSD is still the most concerning symbol in the market.
http://algotrading-investment.com/portfolio-item/harmonic-pattern-plus/
https://www.mql5.com/en/market/product/4488
https://www.mql5.com/en/market/product/4475

Young Ho Seo
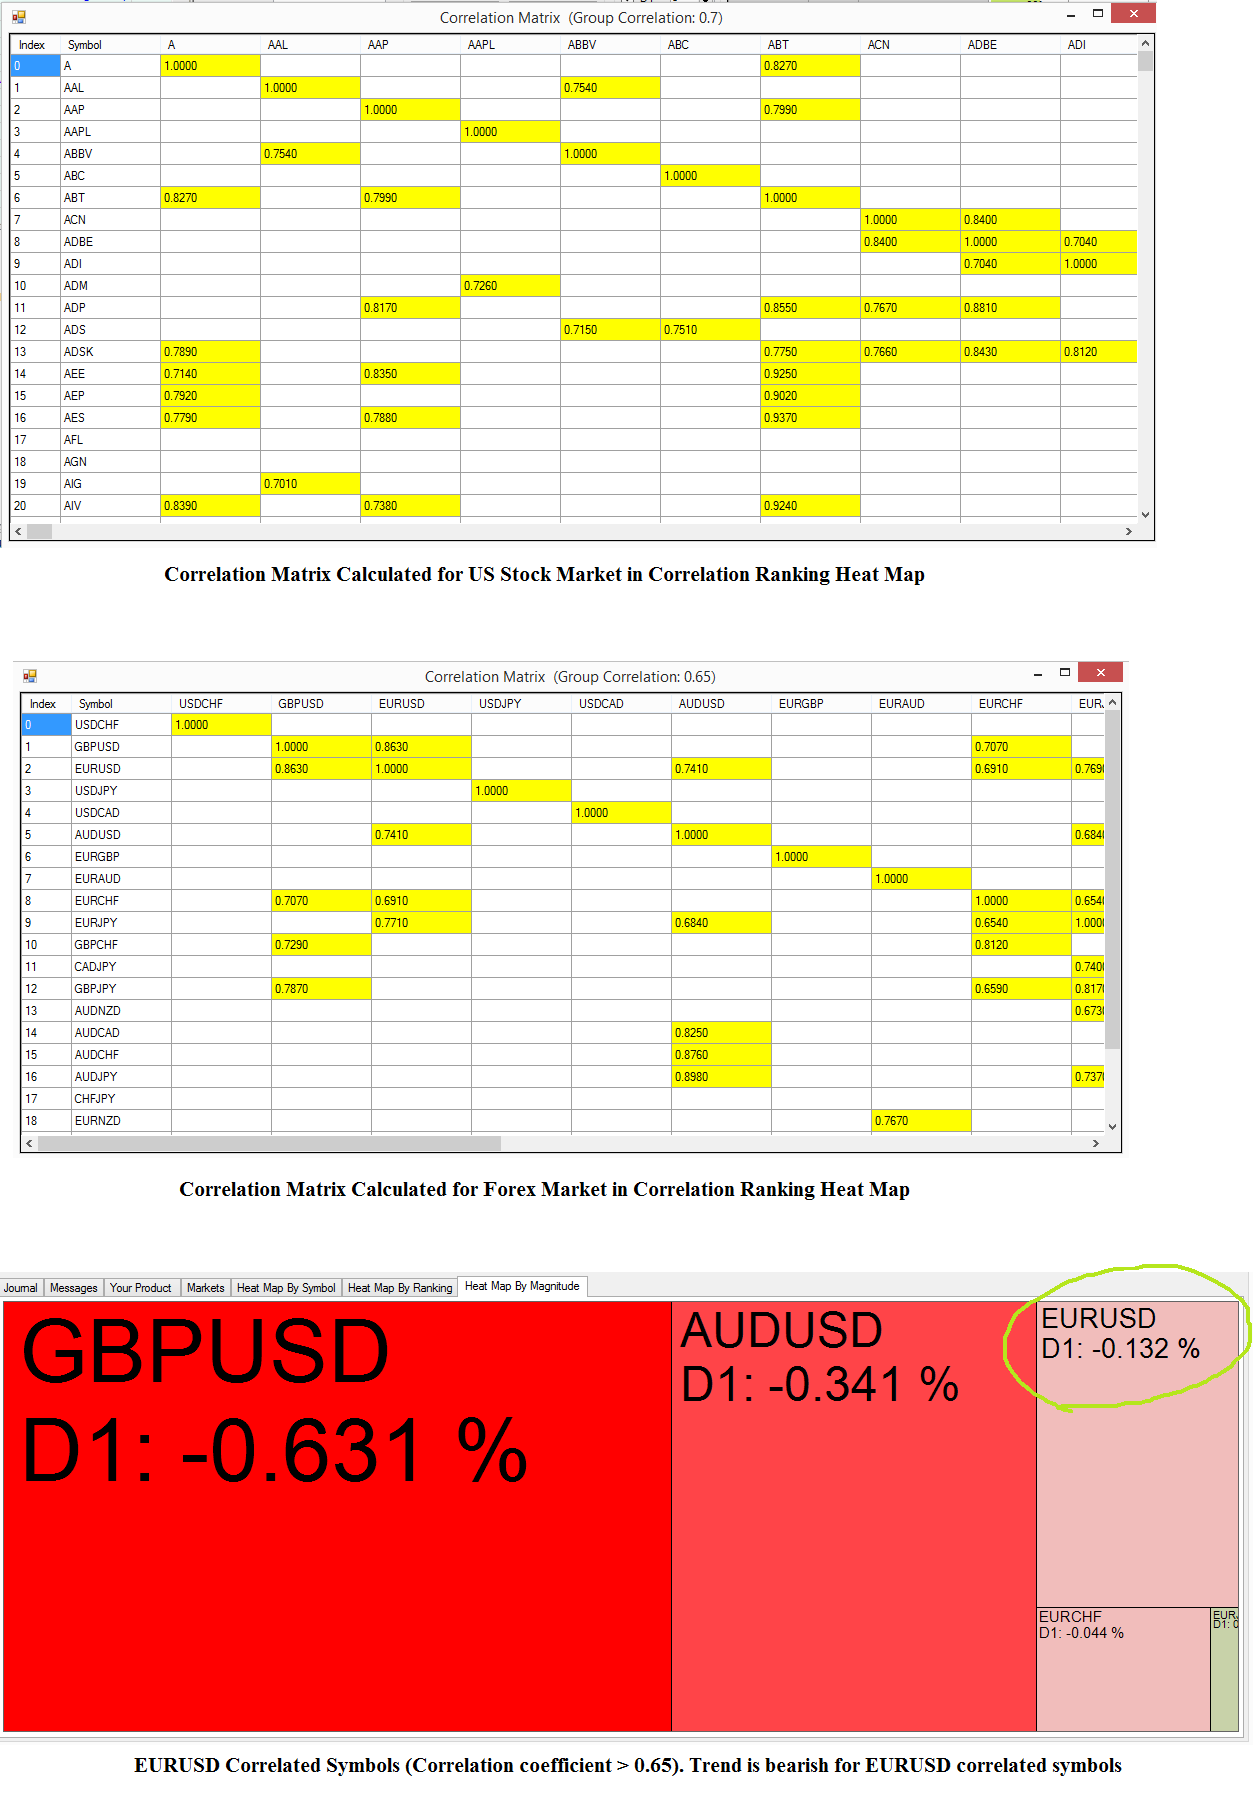
Correlation Matrix Based Trend Indicator
Correlation Ranking Heat Map is the Correlation Matrix based Trend indicator. Correlation Ranking Heat Map calculates the cross correlation of all possible combination of entire market data. Then after, you can use these useful relationship among symbols to identify the potential market direction of any symbol you want. Yet, the rigorous calculation is done at the background. For your trading, you just need to press few buttons to bring the essential information for your trading.
Then how do we use the cross correlation to find out the trend or trend strength of each symbol. Correlation basically find out the relationship or co-movement of two or more symbols. When they are highly correlated, we can group these similar behaving symbols in one basket. What does this mean for your trading ?
To explain in layman’s term, say that, John is first year student in the Aspire Primary School. Now, you know that Mary, also another first year student in the Aspire Primary School, is going to picnic to Disney land tomorrow. Then without even asking to John, we can guess or predict that John is also in the group going to Disney land tomorrow.
Of course, the chance of John joining to the picnic group is subject to some probability because he might be sick on the day. But still, the chance of John joining to the picnic group is higher than not. In summary, correlation helps us to predict the behavior of individual.
This is the underlying idea behind this Correlation Matrix Based Trend Indicator. Instead of looking at one symbol, you are looking at multiple of highly related symbols to find out their trading direction.
Considering most of technical indicator is calculated on one symbol data, this correlation strategy utilizes multiple of symbol data to find out more accurate trend direction than typical technical indicator. In correlation ranking heat map, we do not mix it up with other lagging indicator but we just make the direct use of price movement itself in deciding trend direction. So the strategy is also partly related to the price action across multiple symbols.
For your information, Correlation Ranking Heat Map is the exclusively developed propriety trend indicator in house from concept to application. The Correlation Ranking Heat Map is the first and only one technical indicator fully utilizing the power of correlation matrix.
Here is the link to our Correlation Ranking Heat Map.
https://algotrading-investment.com/portfolio-item/correlation-ranking-heat-map/
https://algotrading-investment.com

: