Young Ho Seo / Perfil
- Información
|
11+ años
experiencia
|
62
productos
|
1192
versiones demo
|
|
4
trabajos
|
0
señales
|
0
suscriptores
|
Harmonic Pattern Indicator - Repainting + Japanese Candlestick Pattern Scanner + Automatic Channel + Many more
https://www.mql5.com/en/market/product/4488
https://www.mql5.com/en/market/product/4475
https://algotrading-investment.com/portfolio-item/harmonic-pattern-plus/
Non Repainting and Non Lagging Harmonic Pattern Indicator – Customizable Harmonic + Japanese Candlestic Pattern Scanner + Advanced Channel + Many more
https://www.mql5.com/en/market/product/41993
https://www.mql5.com/en/market/product/41992
https://algotrading-investment.com/portfolio-item/profitable-pattern-scanner/
Supply Demand Indicator – Multiple Timeframe Scanning Added + Non Repainting + Professional Indicator
https://www.mql5.com/en/market/product/40076
https://www.mql5.com/en/market/product/40075
https://algotrading-investment.com/portfolio-item/ace-supply-demand-zone/
Momentum Indicator – Path to Volume Spread Analysis
https://www.mql5.com/en/market/product/30641
https://www.mql5.com/en/market/product/30621
https://algotrading-investment.com/portfolio-item/excessive-momentum-indicator/
Elliott Wave Indicator for the Power User
https://www.mql5.com/en/market/product/16479
https://www.mql5.com/en/market/product/16472
https://algotrading-investment.com/portfolio-item/elliott-wave-trend/
Forex Prediction - Turn Support and Resistance to the Advanced Strategy
https://www.mql5.com/en/market/product/49170
https://www.mql5.com/en/market/product/49169
https://algotrading-investment.com/portfolio-item/fractal-pattern-scanner/
MetaTrader 4 and MetaTrader 5 Product Page: https://www.mql5.com/en/users/financeengineer/seller#products
Free Forex Prediction with Fibonacci Analysis: https://algotrading-investment.com/2020/10/23/forex-prediction-with-fibonacci-analysis/
Free Harmonic Pattern Signal: https://algotrading-investment.com/2020/12/17/harmonic-pattern-signal-for-forex-market/
============================================================================================================================
Here are the trading education books. We recommend reading these books if you are a trader or investor in Forex and Stock market. In the list below, we put the easy to read book on top. Try to read the easy to read book first and try to read the harder book later to improve your trading and investment.
First Link = amazon.com, Second Link = Google Play Books, Third Link = algotrading-investment.com, Fourth Link = Google Books
Technical Analysis in Forex and Stock Market (Supply Demand Analysis and Support Resistance)
https://www.amazon.com/dp/B09L55ZK4Z
https://play.google.com/store/books/details?id=pHlMEAAAQBAJ
https://algotrading-investment.com/portfolio-item/technical-analysis-in-forex-and-stock-market/
https://books.google.co.kr/books/about?id=pHlMEAAAQBAJ
Science Of Support, Resistance, Fibonacci Analysis, Harmonic Pattern, Elliott Wave and X3 Chart Pattern (In Forex and Stock Market Trading)
https://www.amazon.com/dp/B0993WZGZD
https://play.google.com/store/books/details?id=MME3EAAAQBAJ
https://algotrading-investment.com/portfolio-item/science-of-support-resistance-fibonacci-analysis-harmonic-pattern/
https://books.google.co.kr/books/about?id=MME3EAAAQBAJ
Profitable Chart Patterns in Forex and Stock Market (Fibonacci Analysis, Harmonic Pattern, Elliott Wave, and X3 Chart Pattern)
https://www.amazon.com/dp/B0B2KZH87K
https://play.google.com/store/books/details?id=7KrQDwAAQBAJ
https://algotrading-investment.com/portfolio-item/profitable-chart-patterns-in-forex-and-stock-market/
https://books.google.com/books/about?id=7KrQDwAAQBAJ
Guide to Precision Harmonic Pattern Trading (Mastering Turning Point Strategy for Financial Trading)
https://www.amazon.com/dp/B01MRI5LY6
https://play.google.com/store/books/details?id=8SbMDwAAQBAJ
http://algotrading-investment.com/portfolio-item/guide-precision-harmonic-pattern-trading/
https://books.google.com/books/about?id=8SbMDwAAQBAJ
Scientific Guide to Price Action and Pattern Trading (Wisdom of Trend, Cycle, and Fractal Wave)
https://www.amazon.com/dp/B073T3ZMBR
https://play.google.com/store/books/details?id=5prUDwAAQBAJ
https://algotrading-investment.com/portfolio-item/scientific-guide-to-price-action-and-pattern-trading/
https://books.google.com/books/about?id=5prUDwAAQBAJ
Predicting Forex and Stock Market with Fractal Pattern: Science of Price and Time
https://www.amazon.com/dp/B086YKM8BW
https://play.google.com/store/books/details?id=VJjiDwAAQBAJ
https://algotrading-investment.com/portfolio-item/predicting-forex-and-stock-market-with-fractal-pattern/
https://books.google.com/books/about?id=VJjiDwAAQBAJ
Trading Education Book 1 in Korean (Apple, Google Play Book, Google Book, Scribd, Kobo)
https://books.apple.com/us/book/id1565534211
https://play.google.com/store/books/details?id=HTgqEAAAQBAJ
https://books.google.co.kr/books/about?id=HTgqEAAAQBAJ
https://www.scribd.com/book/505583892
https://www.kobo.com/ww/en/ebook/8J-Eg58EDzKwlpUmADdp2g
Trading Education Book 2 in Korean (Apple, Google Play Book, Google Book, Scribd, Kobo)
https://books.apple.com/us/book/id1597112108
https://play.google.com/store/books/details?id=shRQEAAAQBAJ
https://books.google.co.kr/books/about?id=shRQEAAAQBAJ
https://www.scribd.com/book/542068528
https://www.kobo.com/ww/en/ebook/X8SmJdYCtDasOfQ1LQpCtg
About Young Ho Seo
Young Ho Seo is an Engineer, Financial Trader, and Quantitative Developer, working on Trading Science and Investment Engineering since 2011. He is the creator of many technical indicators, price patterns and trading strategies used in the financial market. He is also teaching the trading practice on how to use the Supply Demand Analysis, Support, Resistance, Trend line, Fibonacci Analysis, Harmonic Pattern, Elliott Wave Theory, Chart Patterns, and Probability for Forex and Stock Market. His works include developing scientific trading principle and mathematical algorithm in the work of Benjamin Graham, Everette S. Gardner, Benoit Mandelbrot, Ralph Nelson Elliott, Harold M. Gartley, Richard Shabacker, William Delbert Gann, Richard Wyckoff and Richard Dennis. You can find his dedicated works on www.algotrading-investment.com . His life mission is to connect financial traders and scientific community for better understanding of this world and crowd behaviour in the financial market. He wrote many books and articles, which are helpful for understanding the technology and application behind technical analysis, statistics, time series forecasting, fractal science, econometrics, and artificial intelligence in the financial market.
If you are interested in our software and training, just visit our main website: www.algotrading-investment.com
Young Ho Seo
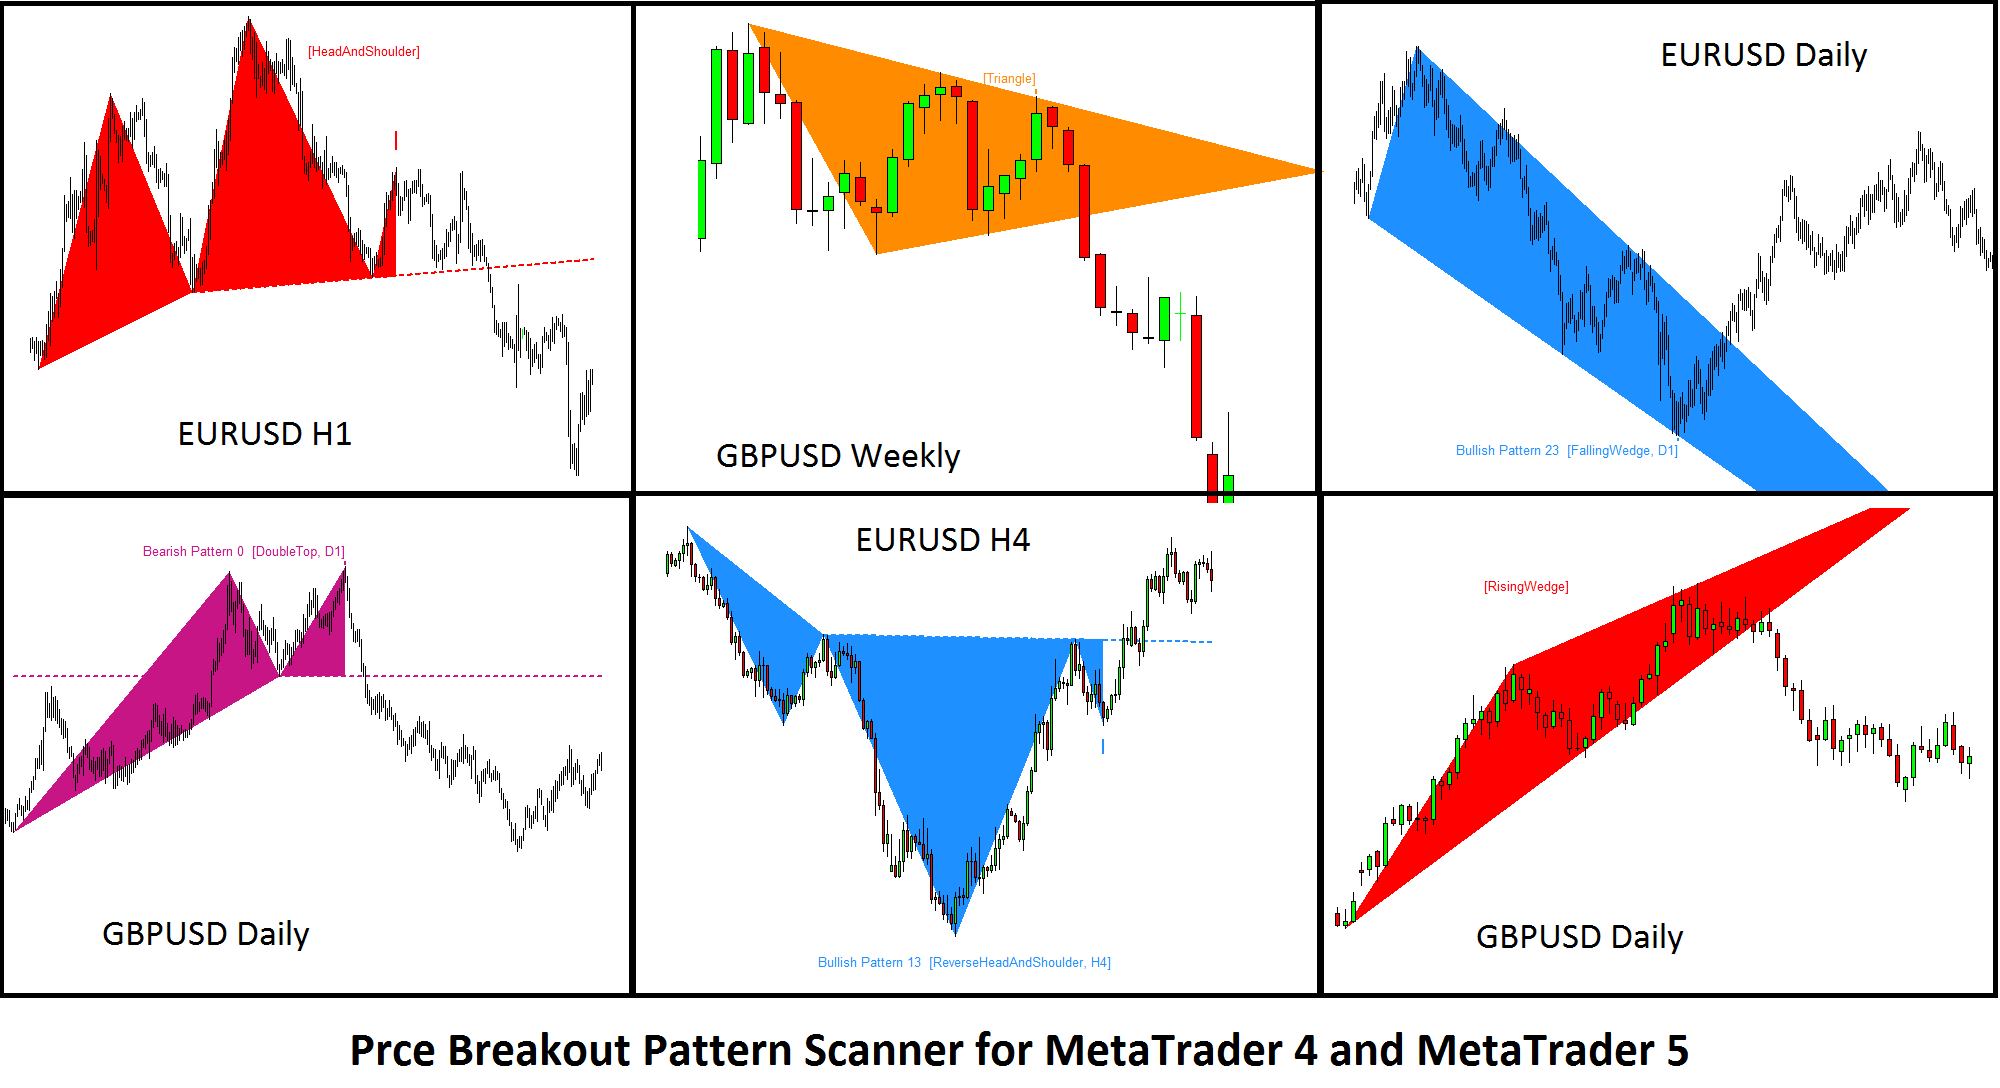
Price Breakout Pattern Scanner for Metatrader
Price Breakout Pattern Scanner is the powerful pattern scanner designed to solve the puzzle of the market geometry beyond the technical indicators. With built in Japanese candlestick patterns + Smart Renko features together, Price Breakout pattern scanner can help you to define the accurate market entry for your breakout trading. Here is some screenshots from Price Breakout Pattern Scanner.
Below are the links to Price breakout Pattern Scanner
https://www.mql5.com/en/market/product/4859
https://www.mql5.com/en/market/product/4858
https://algotrading-investment.com/portfolio-item/price-breakout-pattern-scanner/
In addition, we provide the YouTube Video for Price Breakout Pattern Scanner. With the video, you can see some basic operation of the price breakout pattern scanner. This video is applicable to both MetaTrader 4 and MetaTrader 5 platforms.
YouTube Video “How To Use Price Breakout Pattern Scanner”: https://www.youtube.com/watch?v=aKeSmi_Di2s

Young Ho Seo
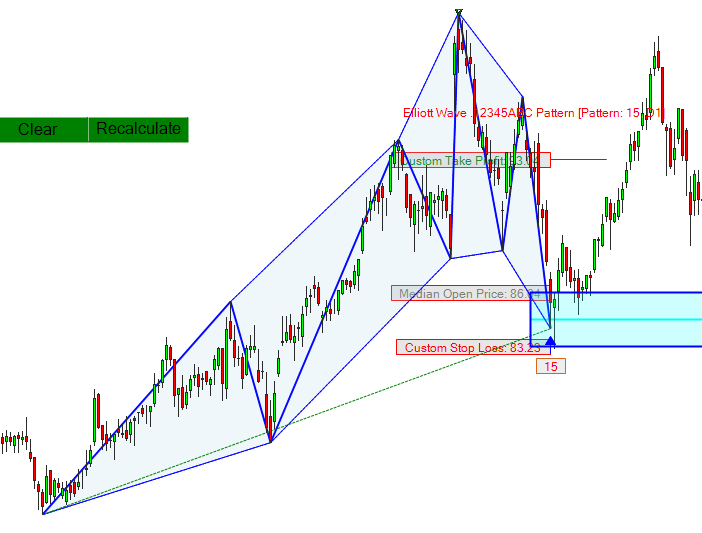
Elliott Wave 12345 ABC
We provide the testing results for Elliott Wave 12345 ABC in Forex and stock market. Elliott Wave 12345 ABC is the Elliott Wave pattern used by technical analyst. This study uses non repainting and non lagging Elliott Wave detection algorithm and the detection algorithm is synchrozined between history and live trading. Hence, this study will show both failed and successful pattern to provide the unbiased results, which is close to the real performance. Typically, a repainting indicator will show the successful pattern only making it hard to check the real performance of your strategy. Hence, you can not check the real performance of the strategy using the repainting indicator. With our Pattern Detection algorithm, you can trade what you see. That can be done by only one button click.
If you want to become a profitable trader, you should study the strategy in the scientific manner. It basically involves checking the repeatability or reproducibility. We provide this study to enhance the forex and stock trading for the trading community. We also want to add some scientific value for the Fibonacci pattern, Harmonic Pattern, X3 Chart Pattern and Elliott Wave Pattern too.
We used the Optimum Chart to test this pattern. You can also use X3 Chart Pattern Scanner in MetaTrader 4 and MetaTrader 5 to get similar results. Elliott Wave 12345 ABC Pattern in this study has the following Structure:
N: 7, C0: 0.618 to T0: 7
R0: 1.272-1.618, R1: 0.618, R2, R3: 1.272-3.141, R4: 0.382-0.886, R5: 2.000-3.618, R6: 0.382-0.886
Points to watch out in this study:
Price movement around the Pattern Completion Zone (= Trading Zone) in the Gartley Pattern
Risk management around the Trading Zone. Look for the trading entry, where at least, Reward greater than Risk x 2
Possibility for breakout trading around the trading zone (=use them as support and resistance)
Look for continuation pattern vs reversal pattern
You can use this Reference to find out how to use these price patterns for your trading.
Science Of Support, Resistance, Fibonacci Analysis, Harmonic Pattern, Elliott Wave and X3 Chart Pattern (In Forex and Stock Market Trading)
Guide to Precision Harmonic Pattern Trading (Mastering Turning Point Strategy for Financial Trading)
Technical Analysis in Forex and Stock Market (Supply Demand Analysis and Support Resistance)
Profitable Chart Patterns in Forex and Stock Market (Fibonacci Analysis, Harmonic Pattern, Elliott Wave, and X3 Chart Pattern)
Scientific Guide to Price Action and Pattern Trading (Wisdom of Trend, Cycle, and Fractal Wave)
Here is the PDF document presenting Elliott Wave 12345 ABC Pattern In Forex and Stock Market.
https://algotrading-investment.com/manual/pricepattern/Elliott%20Wave%2012345%20ABC.pdf
Here is the YouTube Video for Elliott Wave 12345 ABC Pattern in Forex and Stock Market.
https://youtu.be/kqNOhXDfw8Y
Elliott Wave 12345 ABC pattern detection was performed using the Robo Advisor built inside Optimum Chart.
https://algotrading-investment.com/2019/07/23/optimum-chart/
You can also check the similar results using the X3 Chart Pattern Scanner in MetaTrader 4 and MetaTrader 5 platform (Non repainting and non lagging algorithm).
https://www.mql5.com/en/market/product/41993
https://www.mql5.com/en/market/product/41992
https://algotrading-investment.com/portfolio-item/profitable-pattern-scanner/
Harmonic Pattern Plus is the repainting Harmonic Pattern Scanner with tons of powerful features at affordable cost.
https://algotrading-investment.com/portfolio-item/harmonic-pattern-plus/
https://www.mql5.com/en/market/product/4488
https://www.mql5.com/en/market/product/4475
Harmonic Pattern Scenario Planner is the advanced repainting Harmonic Pattern Scanner with tons of powerful features at affordable cost.
https://algotrading-investment.com/portfolio-item/harmonic-pattern-scenario-planner/
https://www.mql5.com/en/market/product/6101
https://www.mql5.com/en/market/product/6240

Young Ho Seo
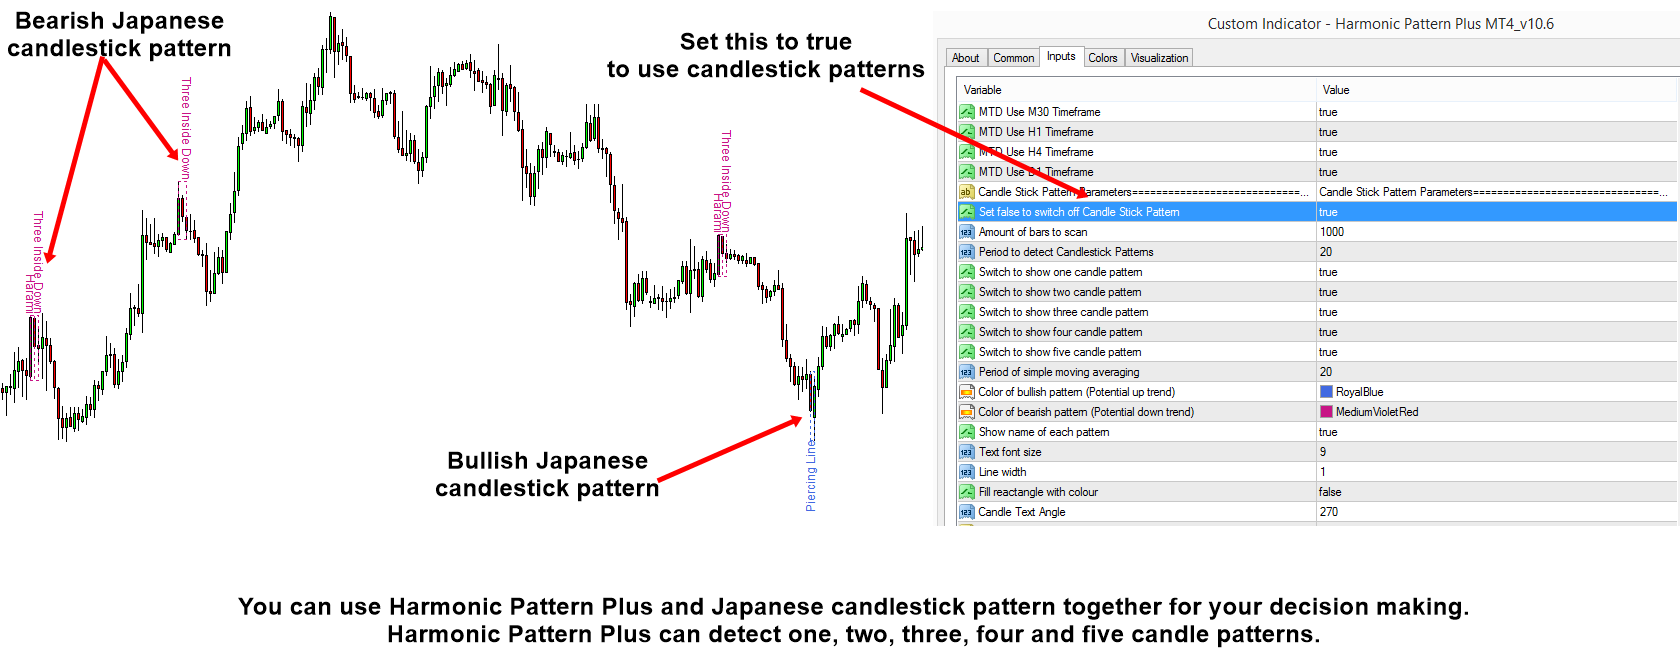
Harmonic Pattern Indicator with Japanese Candlestick Pattern
Apparently Japanese Candlestick patterns are popular and helpful tools to trader to predict the market direction. It is possible to use Japanese Candlestick patterns in your Harmonic Pattern Trading. These Japanese candlestick patterns include “Hammer”, “Doji Star”, “Harami”, “Inverted Hammer”, “Break away” and so on.
Here is some short article on how to use Japanese candlestick pattern with Harmonic Pattern Plus. This article meant to be quick guideline on enabling Japanese Candlestick pattern together with Harmonic Pattern. In addition, you can use the Japanese Candlestick Patterns from X3 Chart Pattern Scanner too.
https://algotrading-investment.com/2019/04/19/using-japanese-candlestick-patterns-with-harmonic-pattern-plus/
Link to Harmonic Pattern Plus
https://www.mql5.com/en/market/product/4488
https://www.mql5.com/en/market/product/4475
https://algotrading-investment.com/portfolio-item/harmonic-pattern-plus/
Link to X3 Chart Pattern Scanner
https://www.mql5.com/en/market/product/41993
https://www.mql5.com/en/market/product/41992
https://algotrading-investment.com/portfolio-item/profitable-pattern-scanner/

Young Ho Seo

Elliott Wave Indicator for Objective Elliott Wave Trading
Elliott Wave is popular Trading strategy in the trading world. The Elliott Wave Theory was originally developed by Ralph Nelson Elliott. It was populated by Robert Prechter.
In the original Elliott Wave Theory, Ralph Nelson Elliott left three Wave rules in counting Elliott Wave. A correct Elliott Wave counting must observe three rules:
Wave 2 never retraces more than 100% of wave 1.
Wave 3 cannot be the shortest of the three impulse waves, namely waves 1, 3 and 5.
Wave 4 does not overlap with the price territory of wave 1, except in the rare case of a diagonal triangle formation.
These three rules are the very general statement about the movement of the financial market. There are a lot of subjectivity when we apply these original rules in trading. Hence, we do not recommend you to trade with these general rules.
In practice, we need more specific and objective rules instead of above general rules. Yes, we will follow the general rules but we will measure the accuracy of Wave Pattern Structure to eliminate bad Elliott Wave patterns in trading.
Elliott Wave Trend is the first indicator that provides the objective measurement around the Elliott Wave pattern structure. Wave structural score will guide you to trade with more accurate and defined Elliott Wave pattern structure. Two Wave structural scores we are using are:
1) Impulse Wave Structure Score (IWS Score) – measure the accuracy of Impulsive Elliott Wave in percents. For example, IWS Score can be used to detect Elliott Wave 123, Elliott Wave 1234 or Elliott Wave 12345 patterns.
2) Corrective Wave Structure Score (CWS Score) – measure the accuracy of Corrective Elliott Wave in percents. For example, CWS Score can be used to detect Corrective Wave ABC patterns.
With these two Wave Structure Score, you can identify the correct Elliott wave patterns from many candidate Wave patterns.
Of course, in Elliott Wave Trend, these two Wave Score will be automatically calculated and presented for your trading. In addition, Elliott Wave Trend presents you candidate Wave patterns automatically so that you do not have to spend time on drawing these patterns manually.
In the screenshot below, we shows the Elliott Wave 12345 pattern with IWS Score of 89.9% (IWS Score > CWS Score). With this high Wave Structure score for Elliott Wave 12345 pattern, you have a high chance to spot the market turning point correctly.
Elliott Wave Trend is the Advanced Elliott Wave Indicator for your trading. Stay with Objective Elliott Wave Trading for the best possible trading performance.
Here are the links for Elliott Wave Trend.
https://algotrading-investment.com/portfolio-item/elliott-wave-trend/
https://www.mql5.com/en/market/product/16479
https://www.mql5.com/en/market/product/16472

Young Ho Seo
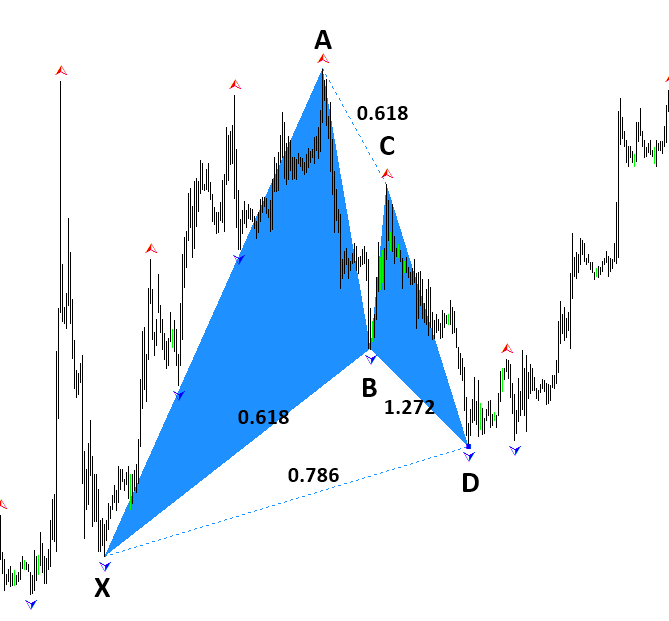
Harmonic Pattern Indicator List for MetaTrader 4
Harmonic Pattern Indicator provide a mean of detecting the turning point in the market. It is one way to solve the puzzle of market geometry, which is often not solvable with technical indicators. How about automatic harmonic pattern detection for your trading ?
We provide the list of Harmonic Pattern Indicator for your MetaTrader 4 platform. These harmonic pattern indicators are not only detecting harmonic pattern but they also provide the addtional features to help you to win in your trading.
1. Harmonic Pattern Plus for MetaTrader 4
Harmonic Pattern Plus is the harmonic pattern scanner. It can detect harmonic patterns with predefined trading entries and stops. Pattern Completion Interval, Potential Reversal Zone and Potential Continuation Zone are supported. In addition, other dozens of powerful features are added like Japanese candlestick detection, automatic channel, etc.
https://www.mql5.com/en/market/product/4488
https://algotrading-investment.com/portfolio-item/harmonic-pattern-plus/
2. X3 Chart Pattern Scanner for MetaTrader 4
X3 Chart Pattern Scanner is non repainting and non lagging pattern scanner for Harmonic Pattern, Elliott Wave pattern and X3 patterns. It is the most advanced but user friendly harmonic pattern indicator. As a bonus, this tool can detect around 52 bearish and bullish Japanese candlestick patterns + advanced Channel features. This is the most advanced Harmonic and Elliott wave scanner in the market. You must try.
https://www.mql5.com/en/market/product/41992
https://algotrading-investment.com/portfolio-item/profitable-pattern-scanner/
3. Harmonic Pattern Scenario Planner for MetaTrader 4
With additional features of predicting future harmonic patterns, this is the tactical harmonic pattern indicator with advanced simulation capability on top of many powerful features of harmonic pattern plus. Try it then you will know its power.
https://www.mql5.com/en/market/product/6240
https://algotrading-investment.com/portfolio-item/harmonic-pattern-scenario-planner/
In addition, you can watch the YouTube Video to feel what is the automated harmonic pattern indicator like. For your information, we provides two YouTube videos with title and links below.
YouTube “Harmonic Pattern Indicator”: https://youtu.be/CzYUwk5qeCk
YouTube “Non Repainting Non Lagging Harmonic Pattern Indicator”: https://youtu.be/uMlmMquefGQ

Young Ho Seo
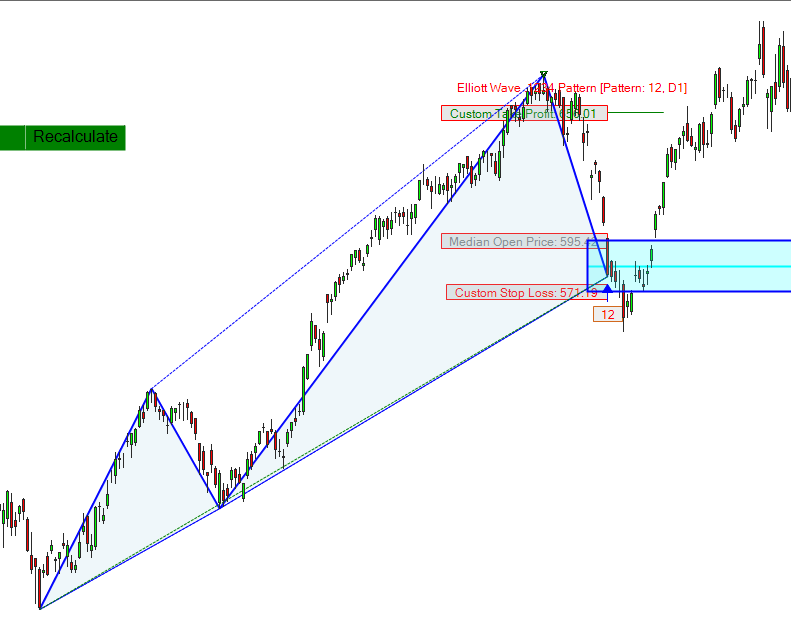
Elliott Wave 1234
We provide the testing results for Elliott Wave 1234 in Forex and stock market. Elliott Wave 1234 is the Elliott Wave pattern used by technical analyst. This study uses non repainting and non lagging Elliott Wave detection algorithm and the detection algorithm is synchrozined between history and live trading. Hence, this study will show both failed and successful pattern to provide the unbiased results, which is close to the real performance. Typically, a repainting indicator will show the successful pattern only making it hard to check the real performance of your strategy. Hence, you can not check the real performance of the strategy using the repainting indicator. With our Pattern Detection algorithm, you can trade what you see. That can be done by only one button click.
If you want to become a profitable trader, you should study the strategy in the scientific manner. It basically involves checking the repeatability or reproducibility. We provide this study to enhance the forex and stock trading for the trading community. We also want to add some scientific value for the Fibonacci pattern, Harmonic Pattern, X3 Chart Pattern and Elliott Wave Pattern too.
We used the Optimum Chart to test this pattern. You can also use X3 Chart Pattern Scanner in MetaTrader 4 and MetaTrader 5 to get similar results. Elliott Wave 1234 Pattern in this study has the following Structure:
N: 3
R0: 0.382-0.500, R1: 2.618-3.618, R2: 0.618
Points to watch out in this study:
Price movement around the Pattern Completion Zone (= Trading Zone) in the Gartley Pattern
Risk management around the Trading Zone. Look for the trading entry, where at least, Reward greater than Risk x 2
Possibility for breakout trading around the trading zone (=use them as support and resistance)
Look for continuation pattern vs reversal pattern
You can use this Reference to find out how to use these price patterns for your trading.
Science Of Support, Resistance, Fibonacci Analysis, Harmonic Pattern, Elliott Wave and X3 Chart Pattern (In Forex and Stock Market Trading)
Guide to Precision Harmonic Pattern Trading (Mastering Turning Point Strategy for Financial Trading)
Technical Analysis in Forex and Stock Market (Supply Demand Analysis and Support Resistance)
Profitable Chart Patterns in Forex and Stock Market (Fibonacci Analysis, Harmonic Pattern, Elliott Wave, and X3 Chart Pattern)
Scientific Guide to Price Action and Pattern Trading (Wisdom of Trend, Cycle, and Fractal Wave)
Here is the PDF document presenting Elliott Wave 1234 Pattern In Forex Market.
https://algotrading-investment.com/manual/pricepattern/Elliott%20Wave%201234%20in%20Forex.pdf
Here is the PDF document presenting Elliott Wave 1234 Pattern in Stock Market.
https://algotrading-investment.com/manual/pricepattern/Elliott%20Wave%201234%20in%20Stock%20Market.pdf
Here is the YouTube Video for Elliott Wave 1234 Pattern in Forex Market.
https://youtu.be/yeia6be2TKc
Here is the YouTube Video for Elliott Wave 1234 Pattern in Stock Market.
https://youtu.be/_avvZoLyM1o
Elliott Wave 1234 pattern detection was performed using the Robo Advisor built inside Optimum Chart.
https://algotrading-investment.com/2019/07/23/optimum-chart/
You can also check the similar results using the X3 Chart Pattern Scanner in MetaTrader 4 and MetaTrader 5 platform (Non repainting and non lagging algorithm).
https://www.mql5.com/en/market/product/41993
https://www.mql5.com/en/market/product/41992
https://algotrading-investment.com/portfolio-item/profitable-pattern-scanner/
Harmonic Pattern Plus is the repainting Harmonic Pattern Scanner with tons of powerful features at affordable cost.
https://algotrading-investment.com/portfolio-item/harmonic-pattern-plus/
https://www.mql5.com/en/market/product/4488
https://www.mql5.com/en/market/product/4475
Harmonic Pattern Scenario Planner is the advanced repainting Harmonic Pattern Scanner with tons of powerful features at affordable cost.
https://algotrading-investment.com/portfolio-item/harmonic-pattern-scenario-planner/
https://www.mql5.com/en/market/product/6101
https://www.mql5.com/en/market/product/6240

Young Ho Seo
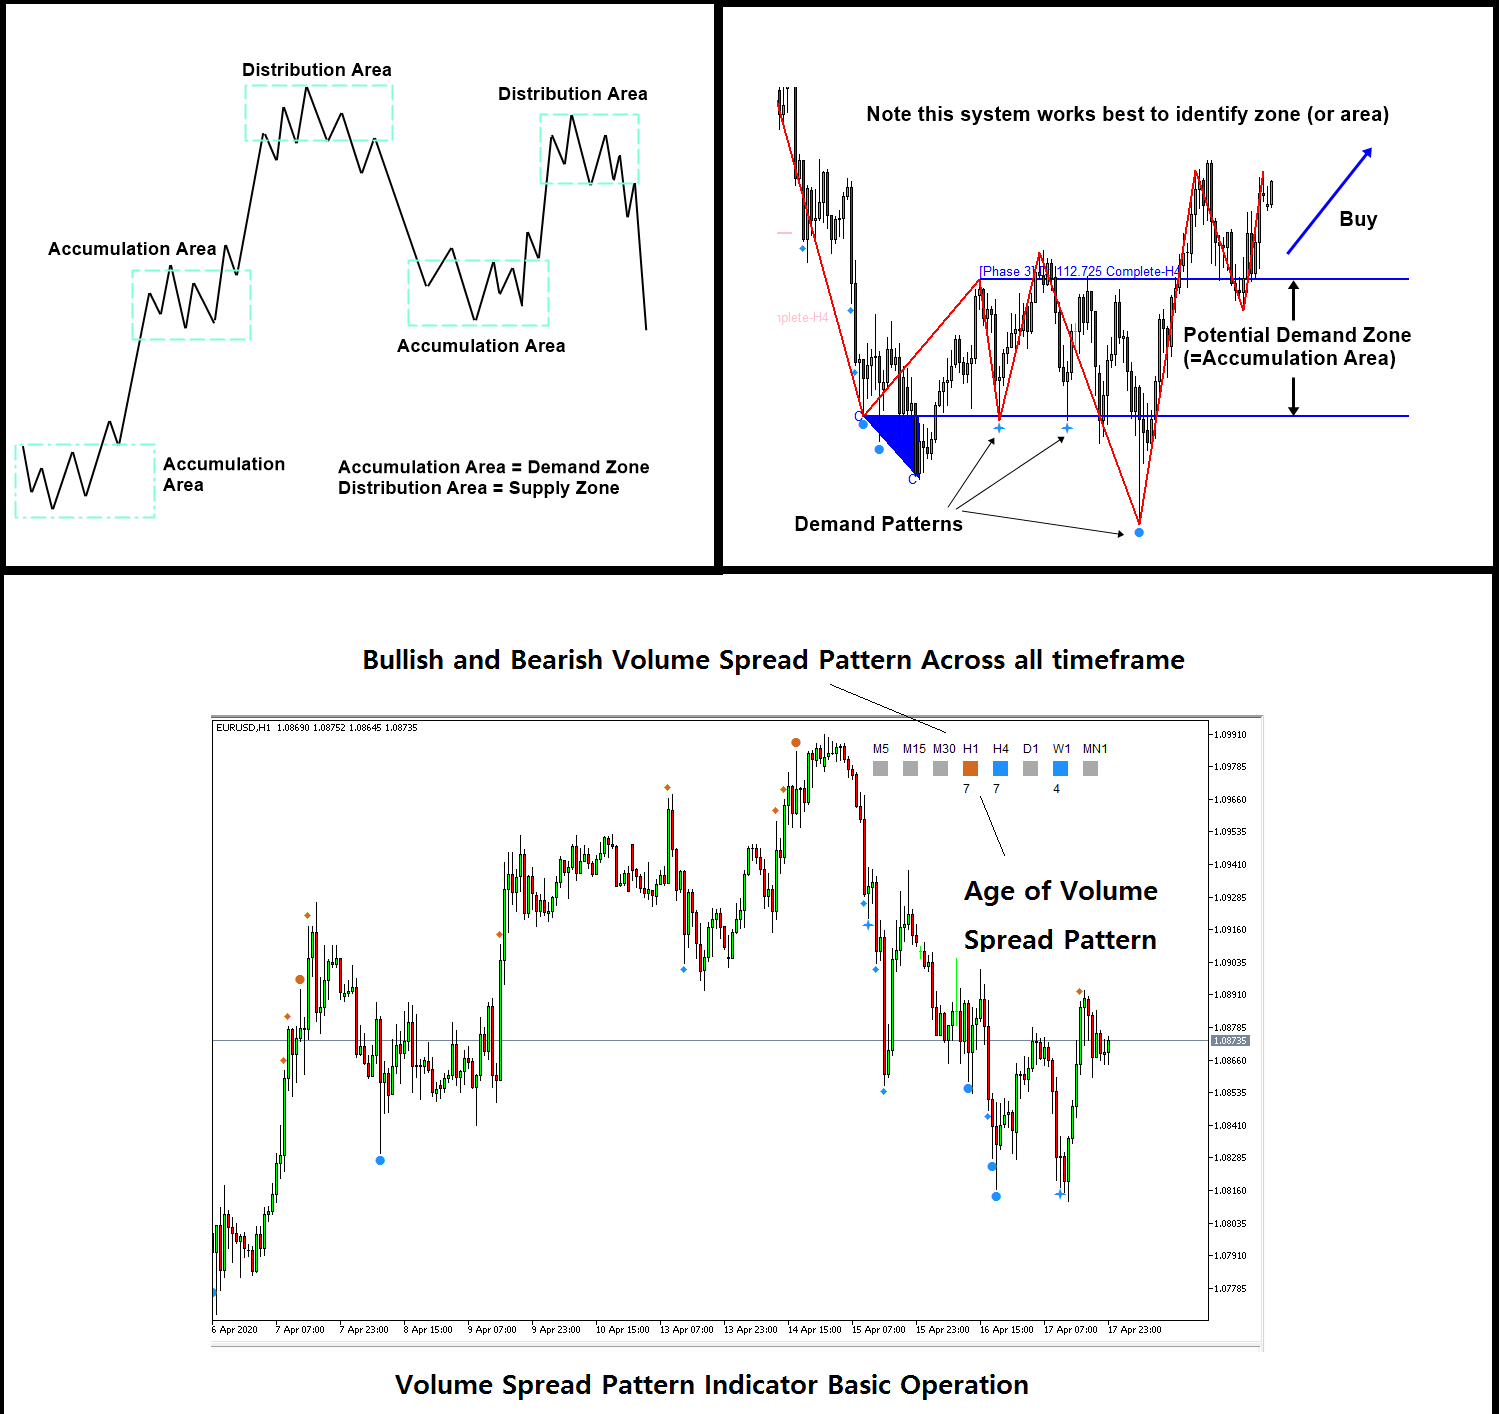
Volume Spread Analysis Indicator List
We provide three different Volume Spread Analysis indicators and volume based tools. Our volume spread analysis tools are the hybrid of volume spread analysis and signal processing theory.
These tools will help you to complete your trading decision with high precision. As long as you understand the concept of the Accumulation and Distribution area in the volume spread analysis, these tools will help you to predict the presence of Accumulation and Distribution area. Hence, you can predict the best trading opportunity.
Firstly, Volume Spread Pattern Indicator is the powerful volume spread analysis indicator that operated across multiple timeframe. Volume Spread Pattern Indicator will not only provide the bearish and bullish volume spread pattern in the current time frame but also it will detect the same patterns across all timeframe. You just need to open one chart and you will be notified bullish and bearish patterns in all timeframe in real time.
Here is the link to Volume Spread Pattern Indicator.
https://www.mql5.com/en/market/product/32961
https://www.mql5.com/en/market/product/32960
https://algotrading-investment.com/portfolio-item/volume-spread-pattern-indicator/
Secondly, Volume Spread Pattern Detector is the light version of Volume Spread Pattern Indicator above. This is free tool with some limited features. However, Volume Spread Pattern Detector is used by thousands of traders. Especially, it works great with the support and resistance to confirm the turning point. This is free tool. Just grab one.
https://www.mql5.com/en/market/product/28438
https://www.mql5.com/en/market/product/28439
https://algotrading-investment.com/portfolio-item/volume-spread-pattern-detector/
Both Volume Spread Pattern Indicator and Volume Spread Pattern Detector works well with Excessive Momentum indicator as Excessive Momentum indicator helps to detect the potential Accumulation and Distribution area automatically. Hence, if you are using Excessive Momentum Indicator, then you can use one between Volume Spread Pattern Indicator or Volume Spread Pattern Detector. In addition, we provide the YouTube video to accomplish the basic operations of Excessive Momentum Indicator.
YouTube Video (Momentum Indicator): https://youtu.be/oztARcXsAVA
Here is link to Excessive Momentum Indicator for MetaTrader 4 and MetaTrader 5.
https://algotrading-investment.com/portfolio-item/excessive-momentum-indicator/
https://www.mql5.com/en/market/product/30641
https://www.mql5.com/en/market/product/30621
Thirdly, we provide the volume Zone Oscillator. This is another useful free tool that utilizes the volume information for your trading. You can use these tools for volume spread analysis, Harmonic Pattern, Elliott Wave Pattern, X3 Price Pattern further. This is free tool. Just grab one.
https://algotrading-investment.com/portfolio-item/volume-zone-oscillator/

Young Ho Seo
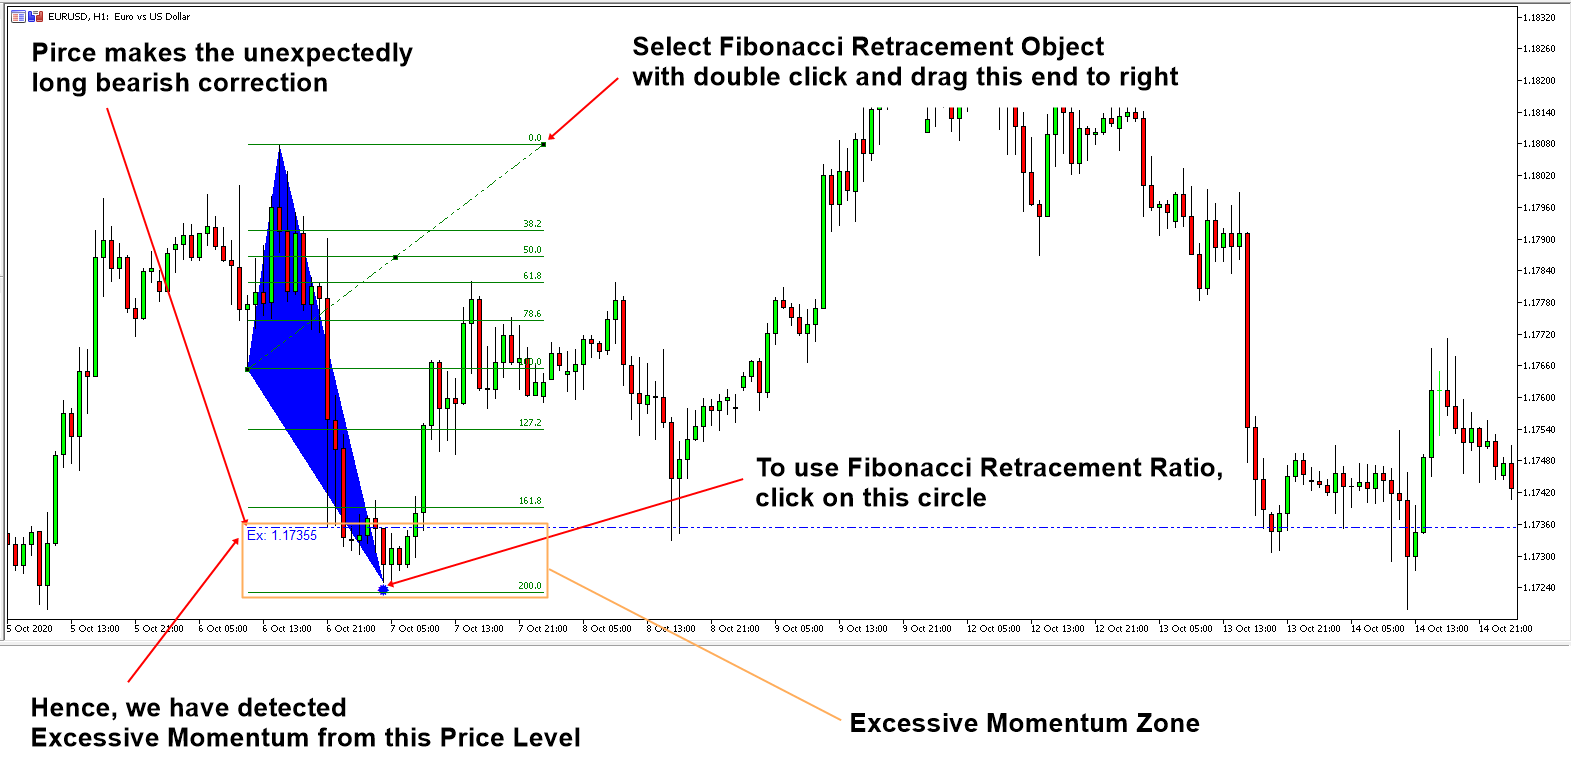
Tutorial Using Excessive Momentum and Fibonacci Ratio Analysis
With Excessive Momentum Indicator, you can access to the automatic Fibonacci Ratio Analysis. Combining these two powerful trading system are the excellent ways to trade in Forex market. In this article, we will show you how to combine both with step by step guide.
When there is an unexpectedly long bearish and bullish price movement, the indicator will detect these excessive momentum area for your trading. This excessive momentum zone are often the true accumulation and distribution area in the Volume Spread Analysis. What does this mean for your trading ?This means that entry around this excessive momentum area can provide you the great advantage that favors your Reward and Risk for your trading whether they are breakout trading or reversal trading. The indicator provides such a great opportunity automatically.
In addition, Fibonacci retracement level can provide further idea about when the price can move according to our expectation. To call the Fibonacci retracement level automatically, simply click on the circle at the Excessive Momentum Zone. Then it will place the Fibonacci retracement level automatically in your chart. The thing is that the placed Fibonacci Retracement level might be too short in its width. Sometime, you want to project the Fibonacci Retracement level far right to see the price action around the retracement level. It is doable too.
To do so, double click on the Fibonacci retracement object in your chart. Then you will see the three anchor points in the retracement object. Drag the right anchor point to the right. You can drag them as far as you want to cover the chart area at your interest. Please check the screenshot attached to complete this tutorial.
This Excessive Momentum Zone can be considered as either Accumulation or Distribution area in the Volume Spread Analysis. You can further find the symptoms of accumulation and distribution area using our Volume Spread Pattern Indicator (Paid and Advanced version) or Volume Spread Pattern Detector (Free and Light version). You can watch the YouTube videos to find more about the Excessive Momentum Indicator.
YouTube Video Momentum Indicator: https://youtu.be/oztARcXsAVA
===========================================================================
Here is link to Excessive Momentum Indicator.
https://algotrading-investment.com/portfolio-item/excessive-momentum-indicator/
https://www.mql5.com/en/market/product/30641
https://www.mql5.com/en/market/product/30621
With Excessive Momentum indicator, you can use our Free Volume Spread Pattern Detector. Volume Spread Pattern Detector is a great free tool to complete your Volume Spread Analysis to detect Accumulation and Distribution. Or even you can use them to detect important support and resistance for your trading too. Here is the link to the free Volume Spread Pattern Detector.
https://www.mql5.com/en/market/product/28438
https://www.mql5.com/en/market/product/28439
https://algotrading-investment.com/portfolio-item/volume-spread-pattern-detector/
In addition, Volume Spread Pattern Indicator is the more advanced version of Volume Spread Pattern Detector. If you want to improve your trading performance even more, then we recommend using Volume Spread Pattern Indicator. This is not free indicator but it is affordable. Here is the link to the Advanced Volume Spread Analysis indicator.
https://www.mql5.com/en/market/product/32961
https://www.mql5.com/en/market/product/32960
https://algotrading-investment.com/portfolio-item/volume-spread-pattern-indicator/

Young Ho Seo
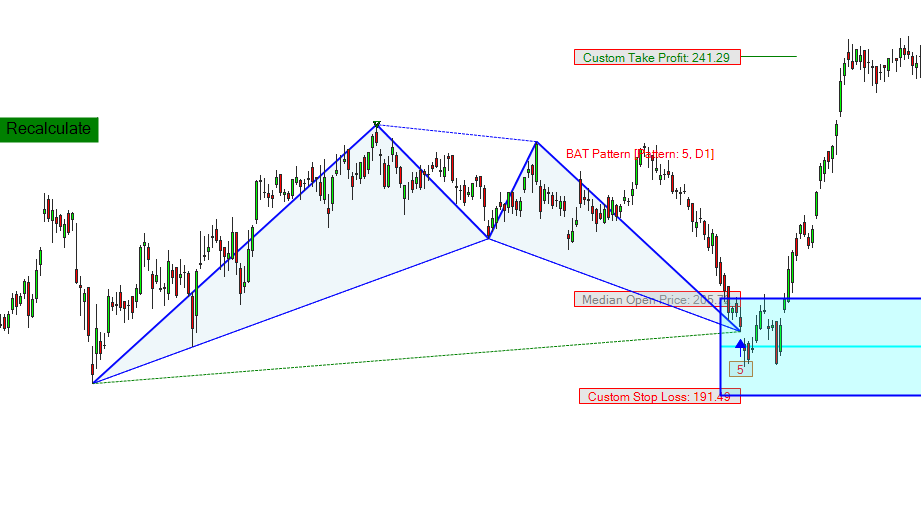
Bat Pattern – Harmonic Pattern
We provide the testing results for Bat Pattern in Forex and stock market. Bat Pattern is the harmonic pattern used by technical analyst. This study uses non repainting and non lagging Harmonic Pattern detection algorithm and the detection algorithm is synchrozined between history and live trading. Hence, this study will show both failed and successful pattern to provide the unbiased results, which is close to the real performance. Typically, a repainting indicator will show the successful pattern only making it hard to check the real performance of your strategy. Hence, you can not check the real performance of the strategy using the repainting indicator. With our Pattern Detection algorithm, you can trade what you see. That can be done by only one button click.
If you want to become a profitable trader, you should study the strategy in the scientific manner. It basically involves checking the repeatability or reproducibility. We provide this study to enhance the forex and stock trading for the trading community. We also want to add some scientific value for the Fibonacci pattern, Harmonic Pattern, X3 Chart Pattern and Elliott Wave Pattern too.
We used the Optimum Chart to test this pattern. You can also use X3 Chart Pattern Scanner in MetaTrader 4 and MetaTrader 5 to get similar results. The Bat Pattern in this study has the following Structure:
N: 3, C0: 0.886 to T0: 3
R0: 1.618-2.618, R1: 0.382 -0.886, R2: 0.382-0.500
Points to watch out in this study:
Price movement around the Pattern Completion Zone (= Trading Zone) in the Gartley Pattern
Risk management around the Trading Zone. Look for the trading entry, where at least, Reward greater than Risk x 2
Possibility for breakout trading around the trading zone (=use them as support and resistance)
Look for continuation pattern vs reversal pattern
You can use this Reference to find out how to use these price patterns for your trading.
Science Of Support, Resistance, Fibonacci Analysis, Harmonic Pattern, Elliott Wave and X3 Chart Pattern (In Forex and Stock Market Trading)
Guide to Precision Harmonic Pattern Trading (Mastering Turning Point Strategy for Financial Trading)
Technical Analysis in Forex and Stock Market (Supply Demand Analysis and Support Resistance)
Profitable Chart Patterns in Forex and Stock Market (Fibonacci Analysis, Harmonic Pattern, Elliott Wave, and X3 Chart Pattern)
Scientific Guide to Price Action and Pattern Trading (Wisdom of Trend, Cycle, and Fractal Wave)
Here is the PDF document presenting Bat Pattern In Forex Market.
https://algotrading-investment.com/manual/pricepattern/Bat%20Pattern%20in%20Forex.pdf
Here is the PDF document presenting Bat Pattern in Stock Market.
https://algotrading-investment.com/manual/pricepattern/Bat%20Pattern%20in%20Stock%20Market.pdf
Here is the YouTube Video for Bat Pattern in Forex Market.
https://youtu.be/AFY-JKcf6Bc
Here is the YouTube Video for Bat Pattern in Stock Market.
https://youtu.be/hRx18zUayIs
Bat pattern detection was performed using the Robo Advisor built inside Optimum Chart.
https://algotrading-investment.com/2019/07/23/optimum-chart/
You can also check the similar results using the X3 Chart Pattern Scanner in MetaTrader 4 and MetaTrader 5 platform (Non repainting and non lagging algorithm).
https://www.mql5.com/en/market/product/41993
https://www.mql5.com/en/market/product/41992
https://algotrading-investment.com/portfolio-item/profitable-pattern-scanner/
Harmonic Pattern Plus is the repainting Harmonic Pattern Scanner with tons of powerful features at affordable cost.
https://algotrading-investment.com/portfolio-item/harmonic-pattern-plus/
https://www.mql5.com/en/market/product/4488
https://www.mql5.com/en/market/product/4475
Harmonic Pattern Scenario Planner is the advanced repainting Harmonic Pattern Scanner with tons of powerful features at affordable cost.
https://algotrading-investment.com/portfolio-item/harmonic-pattern-scenario-planner/
https://www.mql5.com/en/market/product/6101
https://www.mql5.com/en/market/product/6240

Young Ho Seo
Turning Point Prediction Review
The new turning point prediction method consists of the turning point probability and fractal cycle analysis. Currently, the turning point prediction method is exclusively used for Forex and Stock market. In fact, the turning point probability and fractal cycle analysis are integrated in the calculation phase of this turning point prediction method. Several terminologies can describe their application. We ordered the terminologies by their word length.
Geometric volatility
Quantified price action
Fractal wave modelling
Stochastic cycle modelling
Geometric analysis combined with statistics
Peak and trough analysis combined with statistics
Fractal decomposition or Fractal wave decomposition
Price action combined with math or mathematical price action
The above terminologies can be applied to describe the application of the turning point probability and fractal cycle analysis in real world. However, some of the terminology can appeal more to different audience. For example, “stochastic cycle modelling” might be more appealing to the forecasting scientist as they knew some data are more complex beyond the deterministic cycles. Likewise, for the day trader, “price action combined with math” or “mathematical price action” might be more appealing to them if they heard about the price action. Especially, the term “geometric volatility” might provide a lot of insight behind this prediction algorithm to mathematician, even though they have not read this book at all.
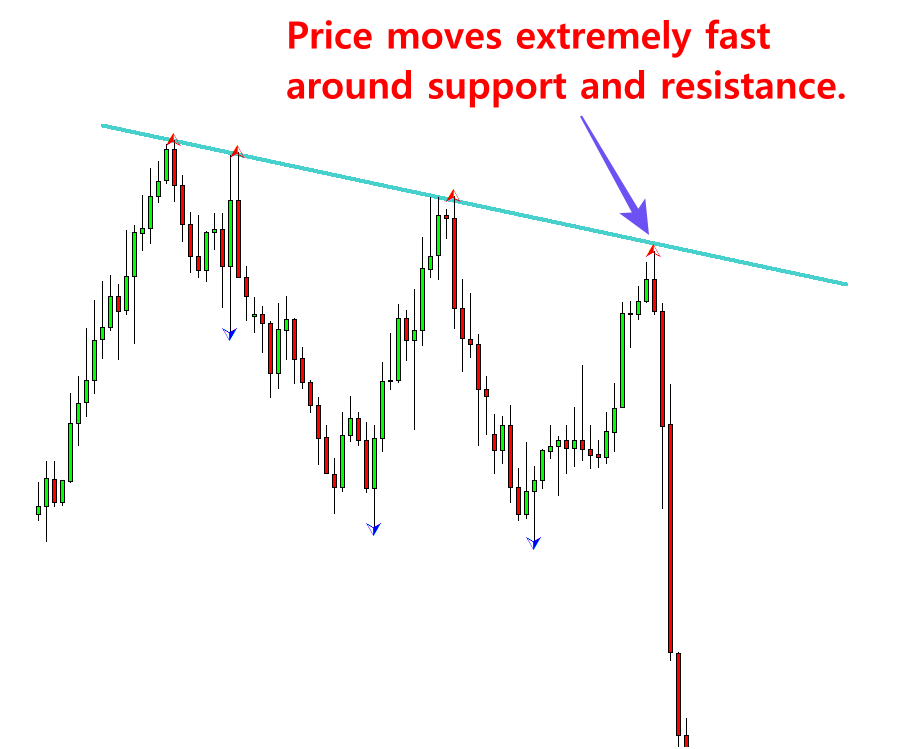
In addition, the price tends to move extremely fast when the price starts to reveal their direction. Hence, even though you have waited long time around support or resistance level, the chance of buying at low price or selling at high price can be thin with the market reaction strategy. You just need to be really fast and accurate to get the early entry before other people act. When you predict the market direction with the turning point probability, this helps to get early entry. You have the better chance to get early entry as you have some clue about the market direction from the turning point probability. This can provide a solid advantage to your trading as you can achieve high reward with less effort.
You can read full article about reviewing the turning point prediction from link below.
https://algotrading-investment.com/2022/05/30/turning-point-prediction-after-two-years-usage/
Or You can get the entire book: Predicting Forex and Stock Market with Fractal Pattern (Science of Price and Time) from the book distributors. The same chater can be found from Turning Point Prediction After Two Years Usage.
https://algotrading-investment.com/portfolio-item/predicting-forex-and-stock-market-with-fractal-pattern/
The turning point probability and fractal cycle analysis are fully implemented in Fractal Pattern Scanner. Below is the landing page for Fractal Pattern Scanner for MetaTrader 4 and MetaTrader 5. The same products are available on www.mql5.com too.
https://www.mql5.com/en/market/product/49170
https://www.mql5.com/en/market/product/49169
https://algotrading-investment.com/portfolio-item/fractal-pattern-scanner/
Below is the landing page for Optimum Chart
https://algotrading-investment.com/2019/07/23/optimum-chart/

Young Ho Seo
MetaTrader Elliott Wave Indicator
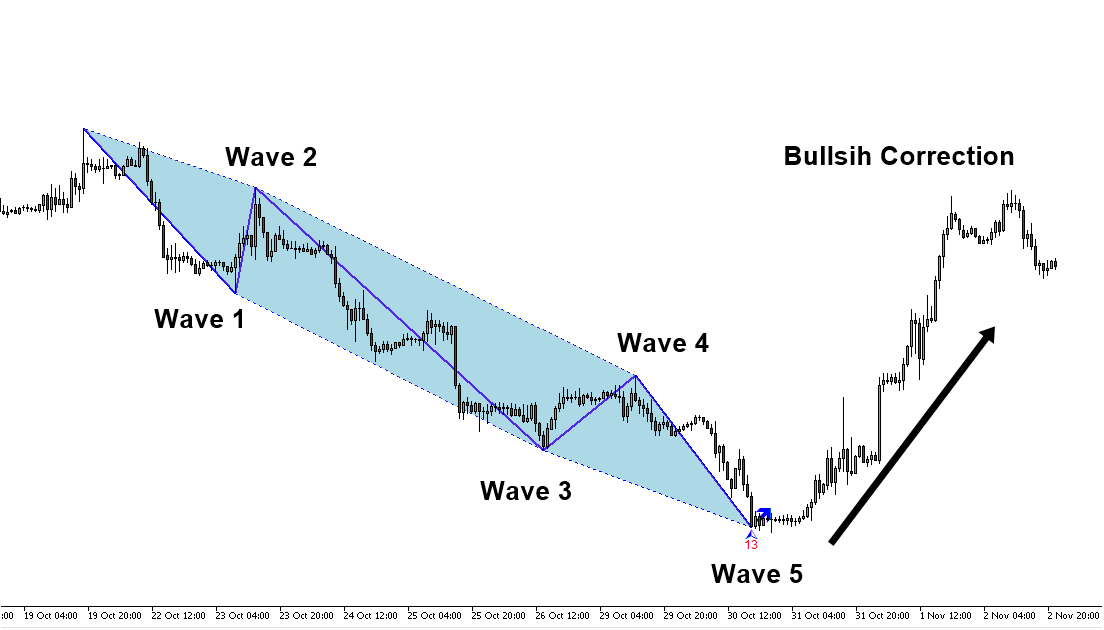
We provide two powerful Elliott Wave Indicators in both MetaTrader 4/ MetaTrader 5. Hence, you have two choice in selecting Elliott Wave Indicators for your trading.
Elliott Wave Trend
Elliott Wave Trend is extremely powerful indicator. Allow you to perform Elliott wave counting as well as Elliott wave pattern detection. On top of them, it provides built in accurate support and resistance system to improve your trading performance.
https://www.mql5.com/en/market/product/16479
https://www.mql5.com/en/market/product/16472
https://algotrading-investment.com/portfolio-item/elliott-wave-trend/
X3 Chart Pattern Scanner
X3 Chart Pattern Scanner is specialized tools in detecting profitable patterns including Harmonic Pattern and Elliott Wave Patterns. Pattern detection process is fully automatic + you can even create customized Elliott wave patterns if you wish.
https://www.mql5.com/en/market/product/35602
https://www.mql5.com/en/market/product/35603
https://algotrading-investment.com/portfolio-item/optimal-turning-point-pattern-scanner/

Young Ho Seo

Butterfly Pattern – Harmonic Pattern
We provide the testing results for Butterfly Pattern in Forex and stock market. Butterfly Pattern is the harmonic pattern used by technical analyst. This study uses non repainting and non lagging Harmonic Pattern detection algorithm and the detection algorithm is synchrozined between history and live trading. Hence, this study will show both failed and successful pattern to provide the unbiased results, which is close to the real performance. Typically, a repainting indicator will show the successful pattern only making it hard to check the real performance of your strategy. Hence, you can not check the real performance of the strategy using the repainting indicator. With our Pattern Detection algorithm, you can trade what you see. That can be done by only one button click.
If you want to become a profitable trader, you should study the strategy in the scientific manner. It basically involves checking the repeatability or reproducibility. We provide this study to enhance the forex and stock trading for the trading community. We also want to add some scientific value for the Fibonacci pattern, Harmonic Pattern, X3 Chart Pattern and Elliott Wave Pattern too.
We used the Optimum Chart to test this pattern. You can also use X3 Chart Pattern Scanner in MetaTrader 4 and MetaTrader 5 to get similar results. The Butterfly Pattern in this study has the following Structure:
N: 3, C0: 1.270 to T0: 3
R0: R0: 1.618-2.240, R1: 0.382-0.886, R2: 0.786
Points to watch out in this study:
Price movement around the Pattern Completion Zone (= Trading Zone) in the Gartley Pattern
Risk management around the Trading Zone. Look for the trading entry, where at least, Reward greater than Risk x 2
Possibility for breakout trading around the trading zone (=use them as support and resistance)
Look for continuation pattern vs reversal pattern
You can use this Reference to find out how to use these price patterns for your trading.
Science Of Support, Resistance, Fibonacci Analysis, Harmonic Pattern, Elliott Wave and X3 Chart Pattern (In Forex and Stock Market Trading)
Guide to Precision Harmonic Pattern Trading (Mastering Turning Point Strategy for Financial Trading)
Technical Analysis in Forex and Stock Market (Supply Demand Analysis and Support Resistance)
Profitable Chart Patterns in Forex and Stock Market (Fibonacci Analysis, Harmonic Pattern, Elliott Wave, and X3 Chart Pattern)
Scientific Guide to Price Action and Pattern Trading (Wisdom of Trend, Cycle, and Fractal Wave)
Here is the PDF document presenting Butterfly Pattern In Forex Market.
https://algotrading-investment.com/manual/pricepattern/Butterfly%20Pattern%20in%20Forex.pdf
Here is the PDF document presenting Butterfly Pattern in Stock Market.
https://algotrading-investment.com/manual/pricepattern/Butterfly%20Pattern%20in%20Stock%20Market.pdf
Here is the YouTube Video for Butterfly Pattern in Forex Market.
https://youtu.be/L49E0kqMTDI
Here is the YouTube Video for Butterfly Pattern in Stock Market.
https://youtu.be/WRDgv5oFT0s
Butterfly pattern detection was performed using the Robo Advisor built inside Optimum Chart.
https://algotrading-investment.com/2019/07/23/optimum-chart/
You can also check the similar results using the X3 Chart Pattern Scanner in MetaTrader 4 and MetaTrader 5 platform (Non repainting and non lagging algorithm).
https://www.mql5.com/en/market/product/41993
https://www.mql5.com/en/market/product/41992
https://algotrading-investment.com/portfolio-item/profitable-pattern-scanner/
Harmonic Pattern Plus is the repainting Harmonic Pattern Scanner with tons of powerful features at affordable cost.
https://algotrading-investment.com/portfolio-item/harmonic-pattern-plus/
https://www.mql5.com/en/market/product/4488
https://www.mql5.com/en/market/product/4475
Harmonic Pattern Scenario Planner is the advanced repainting Harmonic Pattern Scanner with tons of powerful features at affordable cost.
https://algotrading-investment.com/portfolio-item/harmonic-pattern-scenario-planner/
https://www.mql5.com/en/market/product/6101
https://www.mql5.com/en/market/product/6240

Young Ho Seo
Volatility Indicator List for Day Trading
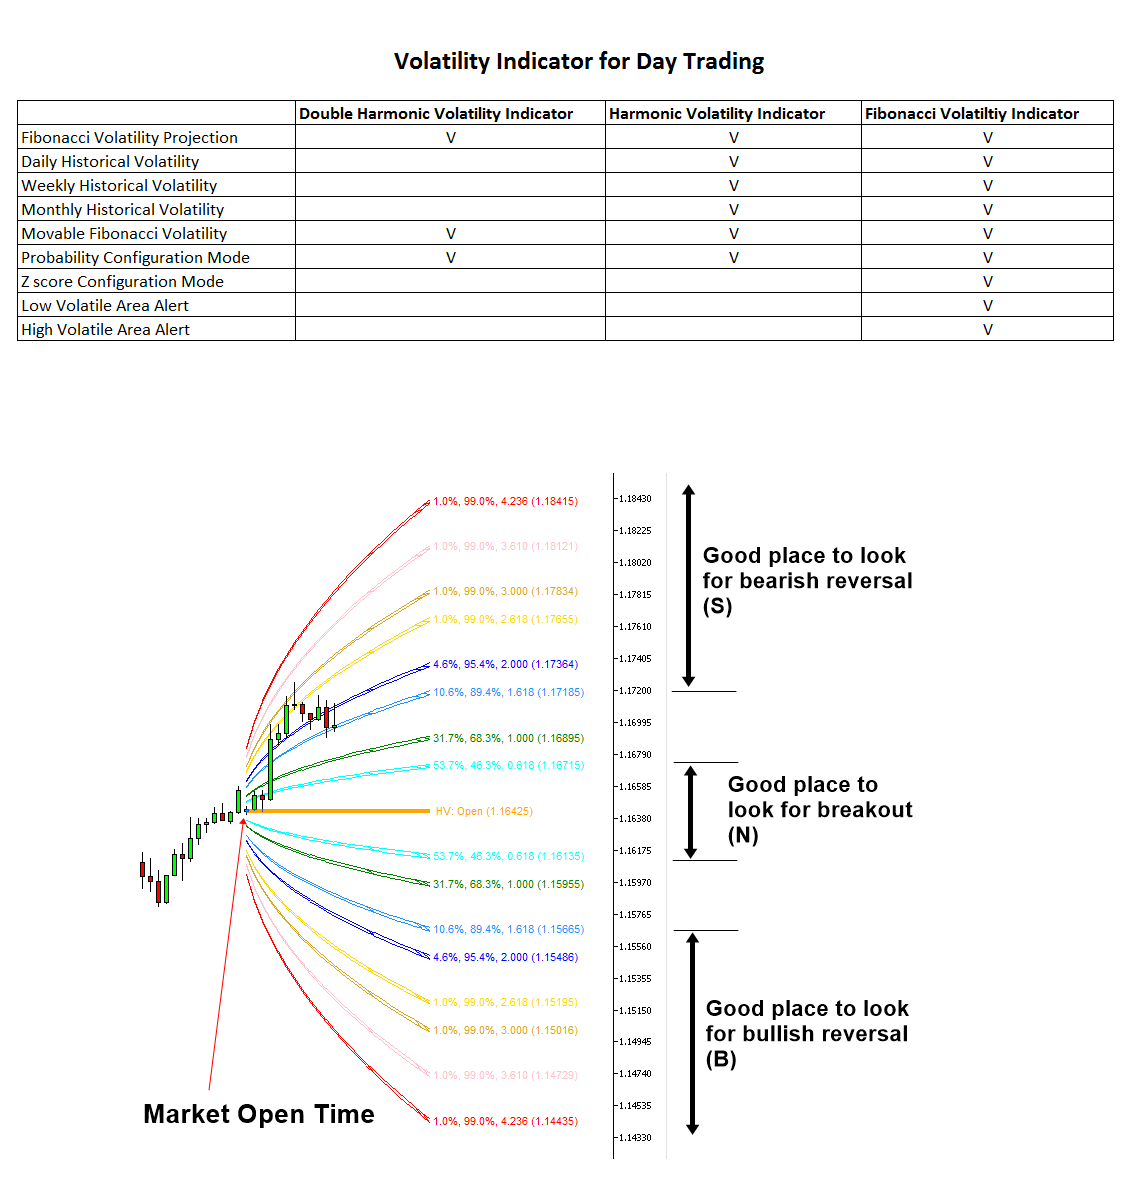
Volatility indicator can help you to detect any statistical advantage for your trading. Especially, if you are trading with Price Action and Price Patterns, then we recommend to use the Volatility indicator together with your strategy. We provide the advanced volatility indicators for MetaTrader 4 and MetaTrader 5 platform.
Fibonacci Volatility Indicator
Fibonacci Volatility indicator can provide the market volatility in visual form in your chart for your trading. You can use Daily, Weekly, Monthly and Yearly Volatility for your trading. The most important application of this Volatility indicator is to detect the potential breakout area, potential bullish reversal area and potential bearish reversal area. When you want to visualize the Volatility for your trading, this is the best tool available in the market. Additionally, you can also use the Movable Volatility indicator too.
https://www.mql5.com/en/market/product/52671
https://www.mql5.com/en/market/product/52670
https://algotrading-investment.com/portfolio-item/fibonacci-volatility-indicator/
Harmonic Volatility Indicator
Harmonic Volatility indicator also provides the market volatility in visual form in your chart for your trading. This tool can be used to visualize the Daily, Weekly, Monthly and Yearly Volatility. The difference between Harmonic Volatility indicator and Fibonacci Volatility indicator is that you can only use Probability Configuration mode in the Harmonic Volatility indicator whereas in the Fibonacci Volatility indicator you can access both Probability Configuration and Z Score configuration. This is cheaper than Fibonacci Volatility indicator.
https://www.mql5.com/en/market/product/29008
https://www.mql5.com/en/market/product/29004
https://algotrading-investment.com/portfolio-item/harmonic-volatility-indicator/
Double Harmonic Volatility Indicator
This is the cheapest Volatility indicator. This indicator is specialized in the Movable Volatility indicator mostly. Hence, if you only need the Movable Volatility indicator and you want to have more cost effective tool, then use this. However, if you want to have more choice in the Volatility visualization, then use either Harmonic Volatility indicator or Fibonacci Volatility indicator.
https://www.mql5.com/en/market/product/23779
https://www.mql5.com/en/market/product/23769
https://algotrading-investment.com/portfolio-item/double-harmonic-volatility-indicator/
GARCH improved Nelder Mead – Free indicator
This is free Volatility indicator that implements the Generalized Autoregressive Conditional Heteroskedasticity (GARCH) methods with Nelder Mead algorithm. This is bit of experimental indicator to realize the GARCH (1,1) model. Hence, we provide this indicator for free. It would be interesting to see how this Volatility indicator works for your trading.
https://www.mql5.com/en/market/product/6918
https://www.mql5.com/en/market/product/6910
https://algotrading-investment.com/portfolio-item/garch-improved-nelder-mead/

Young Ho Seo
Trading Zone Extended From Support Resistance
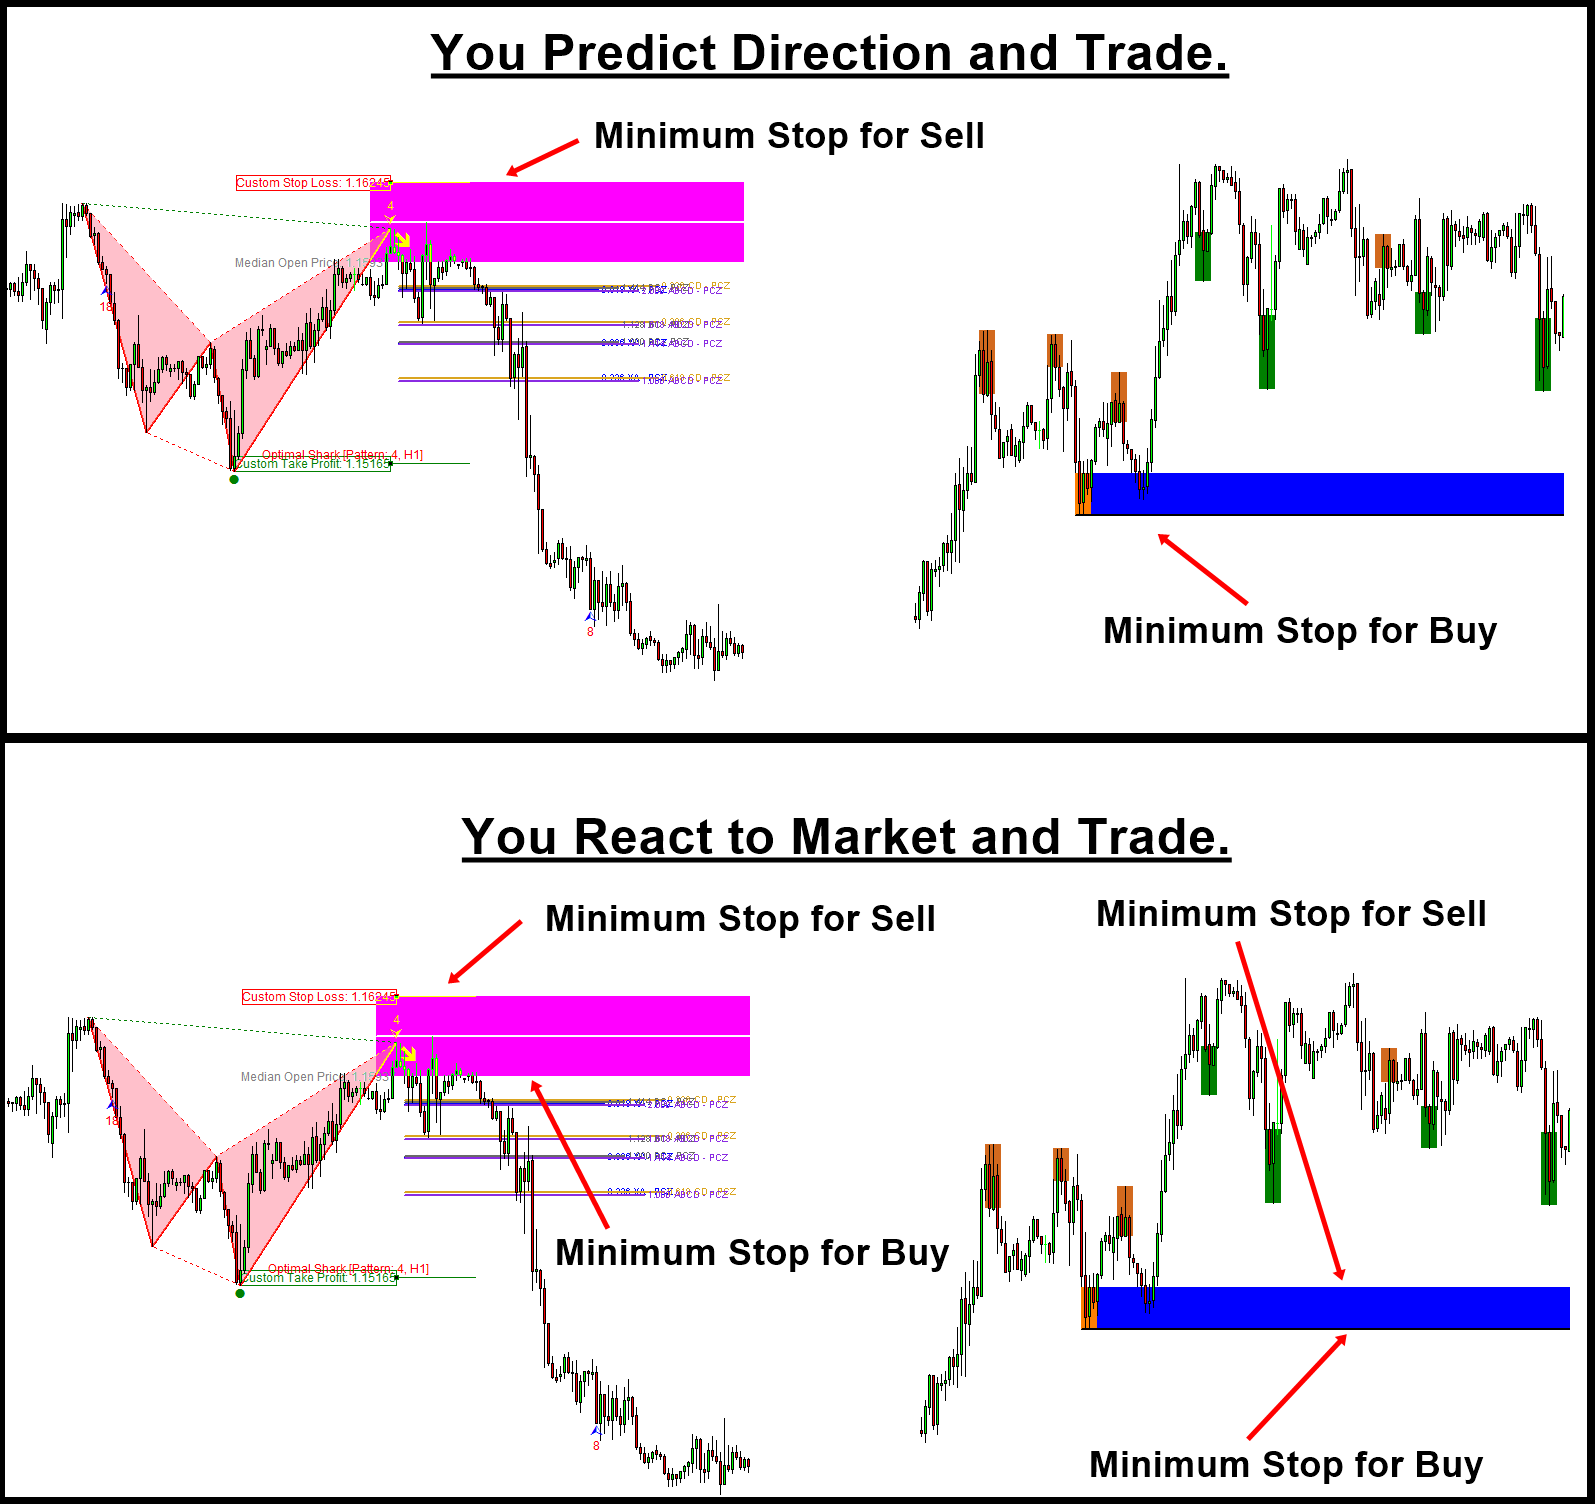
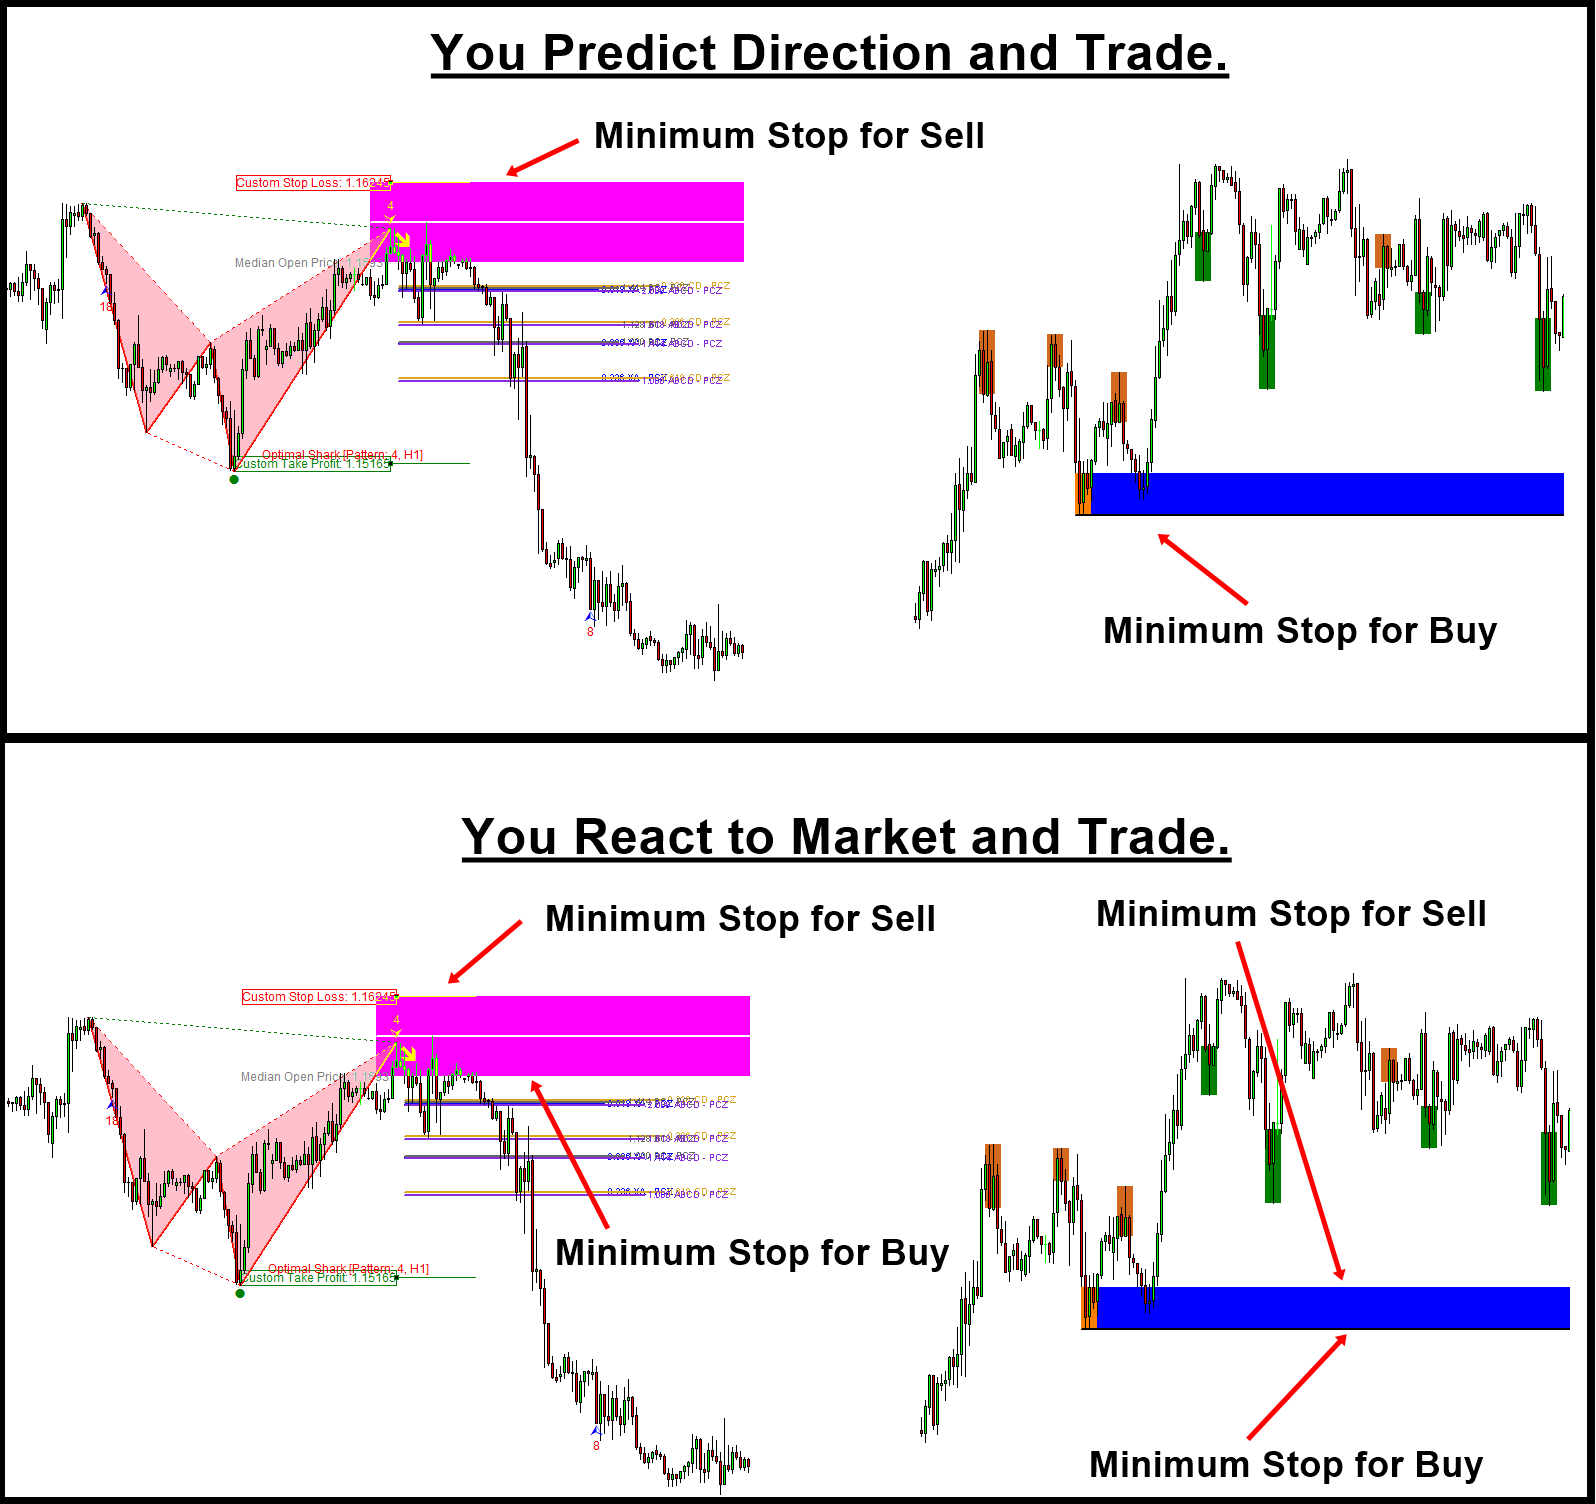
Trading zone in technical analysis is the extended concept from the horizontal support and resistance. The zone is the great tool to decide your trading entry and exit as well as managing your risk and reward. Especially, when the zone is drawn around the significant peak and trough, the value for the trading zone is precious. When you use Harmonic Pattern or X3 Chart Pattern, the trading zone can be identified using the Pattern Completion Interval. The detailed process is well described in the Book: Guide to Precision Harmonic Pattern Trading (2016). When you use the supply demand analysis, the zone is identified from the base location. Especially, it is even better if the trading zone is non repainting. The non repainting zone become the powerful tool to decide the entry and exit for your trading because they stay in the location always as the reference.
https://play.google.com/store/books/details?id=8SbMDwAAQBAJ
The trading zone is useful if your trading strategy is based on predicting the market direction. In such a case, the trading zone can provide a sensible place for stop loss. Then you can scale up your take profit target according to your anticipated location. Even if your trading strategy is not based on predicting market direction, the trading zone is still useful. For example, let’s say that you never want to predict the market, but you want to react the market so that you will trade in the direction in which the price is pushed by crowd like support and resistance style. In this case, the trading zone acts like the horizontal support resistance. But the managing your reward and risk is much easier than other mean of support and resistance.
I used the word minimum stop loss instead of the stop loss because sometimes, you might need to make your stop loss slightly bigger than the actual zone. The margin for the stop loss will be depending on your reward to risk ratio. How this reward to risk system works is well described in the latest book: Technical Analysis in Forex and Stock Market (2021).
https://play.google.com/store/books/details?id=pHlMEAAAQBAJ
For your information, we also provide the MetaTrader 4 and MetaTrader 5 indicators that provide the non repainting trading zone. You can have a look at these automated scanner, which you can trade with the direction prediction strategy as well as the react to market strategy.
Here is the link to Ace Supply Demand Zone Indicator for MetaTrader 4/MetaTrader 5.
https://www.mql5.com/en/market/product/40076
https://www.mql5.com/en/market/product/40075
https://algotrading-investment.com/portfolio-item/ace-supply-demand-zone/
Here is the link to X3 Chart Pattern Scanner for MetaTrader 4/ MetaTrader 5.
https://www.mql5.com/en/market/product/41993
https://www.mql5.com/en/market/product/41992
https://algotrading-investment.com/portfolio-item/profitable-pattern-scanner/

Young Ho Seo
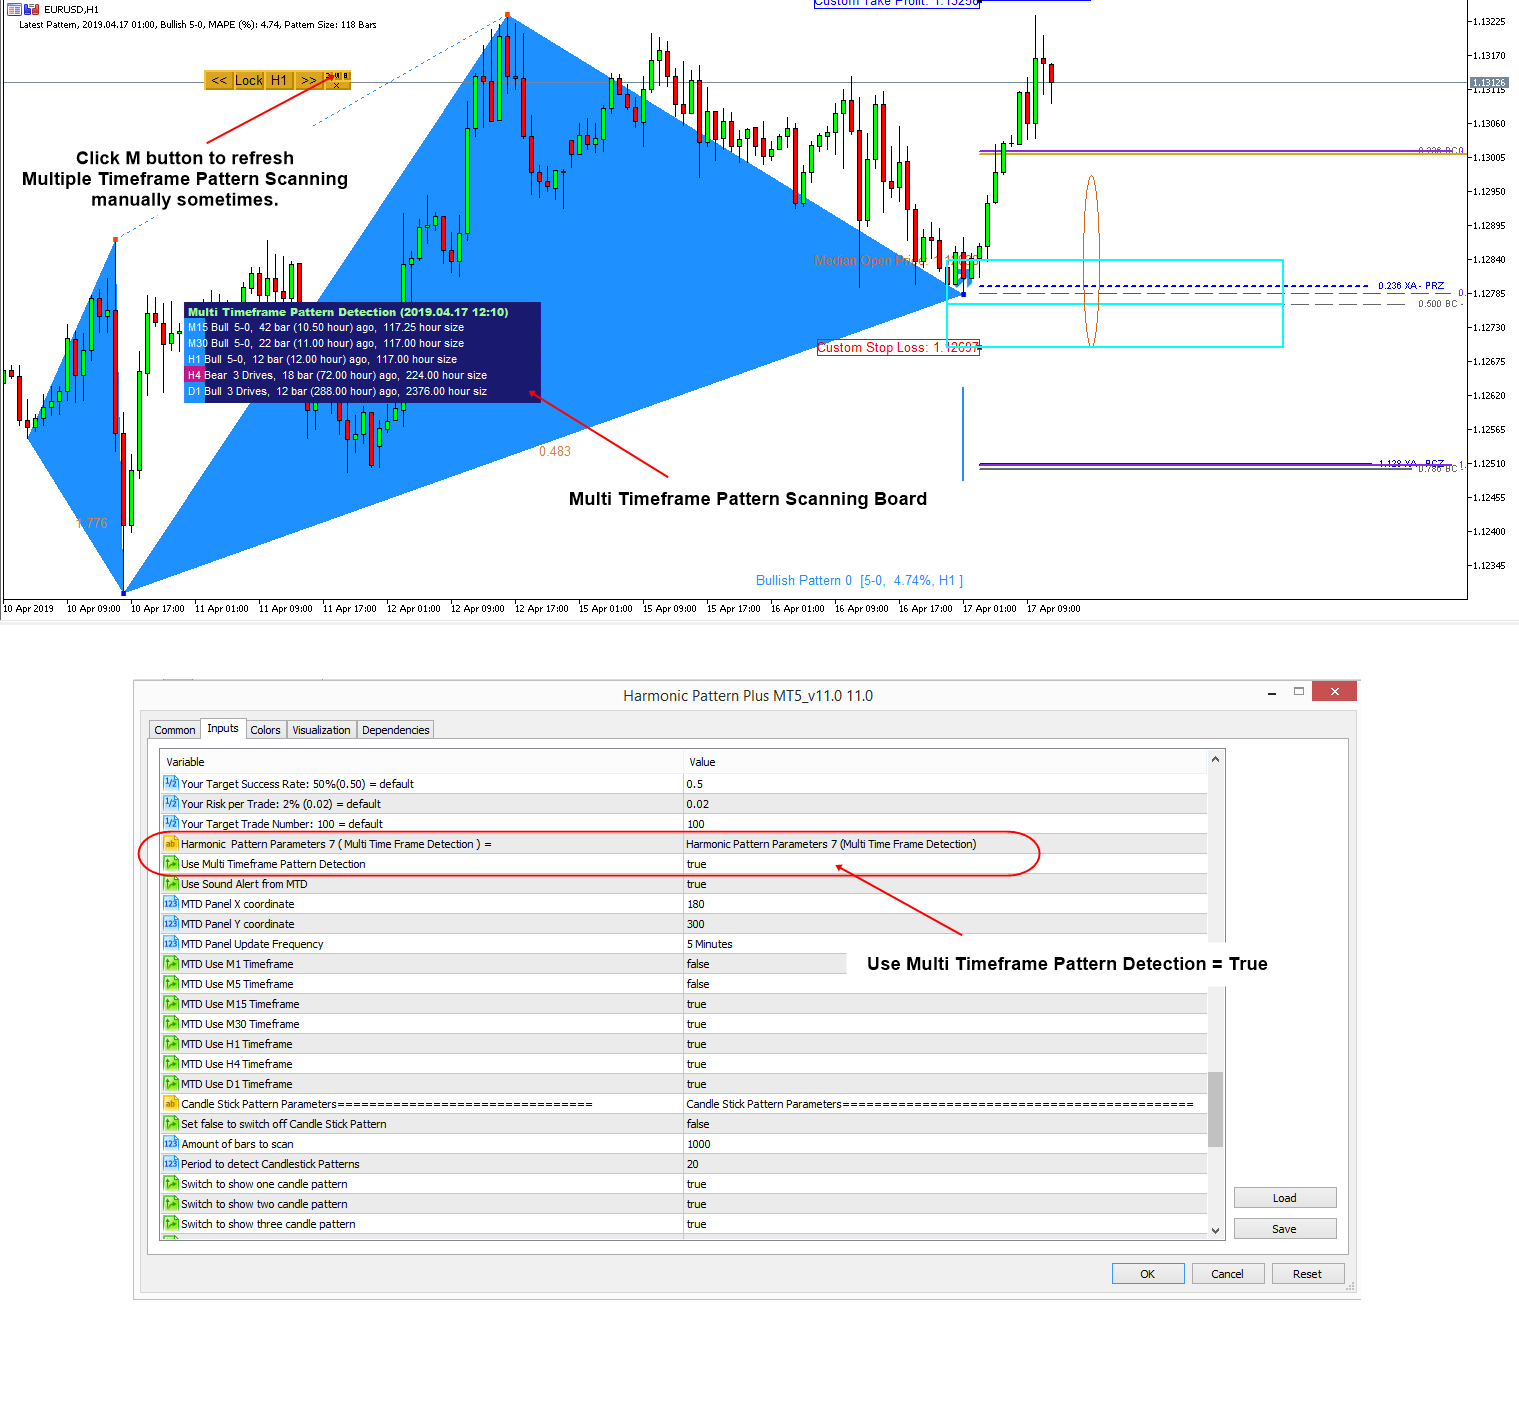
Multiple Timeframe Pattern Scanning for Harmonic Pattern Plus and Harmonic Pattern Scenario Planner
Multiple Timeframe Analysis is a convenient feature when you want to trade with Harmonic Pattern. It allows you to alert the latest harmonic pattern across all timeframe. It is handy that you can view all these patterns in one place. Here is simple screenshot showing you how to enable Multiple Timeframe Pattern Scanning in your Harmonic Pattern Plus and Harmonic Pattern Scenario Planner. Just enable Use Multiple Timeframe Pattern Detection = true in your input setting. That is all. Also there is small “M” button in your chart in case, you want to refresh multiple timeframe pattern scanning manually. If you are using MetaTrader 5 platform, then you might need this sometimes when data is not fully loaded in your MetaTrader. Especially, in MetaTrader 5 platform, it can take sometime to load data on lower and higher timeframe. However, once they are loaded, you should be able to see the patterns detected across all timeframe. In fact, this longer data loading is done because MetaTrader 5 platform is loading tick by tick data, which is really heavy for your CPU and Memory and this can not be controlled by the indicator. Hence, we can not blame the platform builder anyway as they tried to do something good intentionally in their end. Since in MetaTrader 4, they only load Open, High, Low and close price, the data loading time is pretty fast and not noticeable most of time. Please have a look at the YouTube video to understand the multiple timeframe analysis better with Harmonic Pattern.
Please watch YouTube video for full explanation: https://youtu.be/fgPxxBVzER0
Link to Harmonic Pattern Plus
https://algotrading-investment.com/portfolio-item/harmonic-pattern-plus/
https://www.mql5.com/en/market/product/4488
https://www.mql5.com/en/market/product/4475
Link to Harmonic Pattern Scenario Planner
https://algotrading-investment.com/portfolio-item/harmonic-pattern-scenario-planner/
https://www.mql5.com/en/market/product/6101
https://www.mql5.com/en/market/product/6240

Young Ho Seo
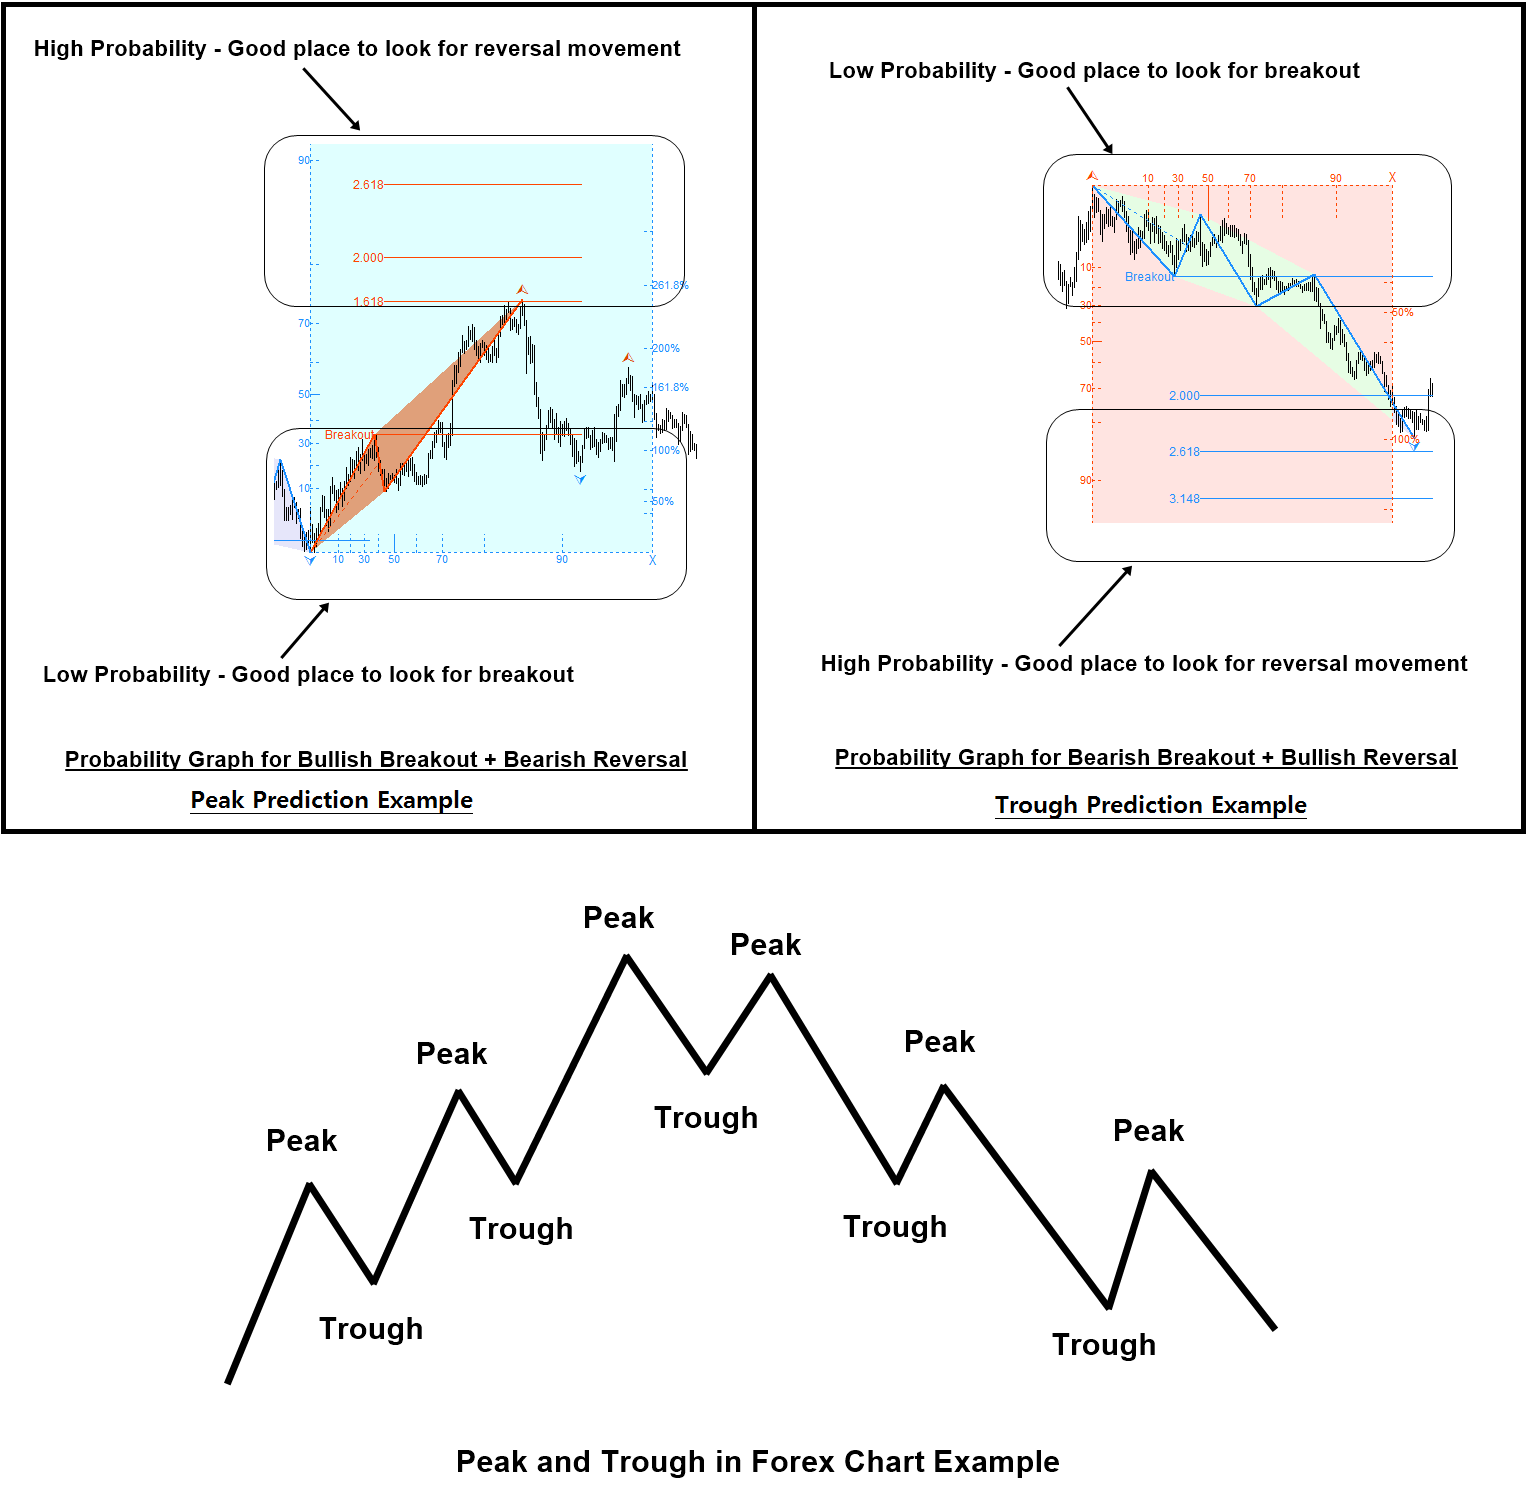
Understanding the Turning Point and Trend
As a day trader or investor, the concept of the turning point and the trend in Forex and Stock market must be understood. These two are not the independent topic from each other. It is better to view them under one subject. It is even better if you understand the concept of the momentum trading and mean reversion trading as any strategy in Forex and Stock market trading will be either one of them. You need to learn how to use them at your favor for your trading. The book: Science Of Support, Resistance, Fibonacci Analysis, Harmonic Pattern, Elliott Wave and X3 Chart Pattern (In Forex and Stock Market Trading) is exactly the book dedicated for this topic. This book will provide many examples of the turning point and trend. In addition, the book brings the concept of the trend and turning point further. It provides the detailed description on the turning point probability and the trend probability.
In the trend strategy, your entry will be at the strong trend movement during the growth phase. This might be good if our entry is not too late. However, if we are late, then we will encounter the loss from early enterers starting to materialize their profits. In the turning point strategy, we are trying to pick up the new trend as early as possible in their birth stage. Therefore, it gives you the opportunity to become the early enterer. Hence, the profitable range is longer than typical trend strategy. In addition, you can also quit your position much earlier than other trend strategy players can.
The longer profitable range means that we need fewer trades to achieve good profits. At the same time, there are some weaknesses of the turning point strategy too. For example, turning point strategy might signal buy or sell entry too early while the ongoing trend was not finished. Since both trend and turning point strategy have their own strength and weakness, it is possible that you can compromise between turning point strategy and trend strategy too. For example, you do not immediately trade at the turning point signal but you can wait until you observe that some price movement is following the new trend direction. Therefore, this becomes semi-turning point strategy. Many of good traders use semi-turning point strategy since they are the hybrid of turning point strategy and trend strategy. The fact is that skills to predict the turning point is important for the successful trading. Even though you are trading with trend strategy, it is still advantageous to have good skills in predicting turning point. Hence, the methodology of predicting turning point was sought after by many legendary traders in the financial market nearly 100 years. It is one clear piece of winning logic for successful trading helping “You act faster than other trader.”
The book can be found in all the major book distributors in the world. Please choose the best book distributor you like from the link below including amazon.com, Google Play Book, scribd.com, Apple Book and so on.
https://www.scribd.com/book/515253555/Science-Of-Support-Resistance-Fibonacci-Analysis-Harmonic-Pattern-Elliott-Wave-and-X3-Chart-Pattern
https://algotrading-investment.com/portfolio-item/science-of-support-resistance-fibonacci-analysis-harmonic-pattern/
https://www.amazon.com/dp/B0993WZGZD
After understanding the probability, we can improve your trading with either turning point probability and trend probability. The direct representation of its principle can be found from Fractal Pattern Scanner. You have the full access to the turning point probability and trend probability from Fractal Pattern Scanner to improve your trading strategy. Please have a look at the indicator.
Below is the landing page for Fractal Pattern Scanner in MetaTrader version.
https://www.mql5.com/en/market/product/49170
https://www.mql5.com/en/market/product/49169
https://algotrading-investment.com/portfolio-item/fractal-pattern-scanner/

Young Ho Seo
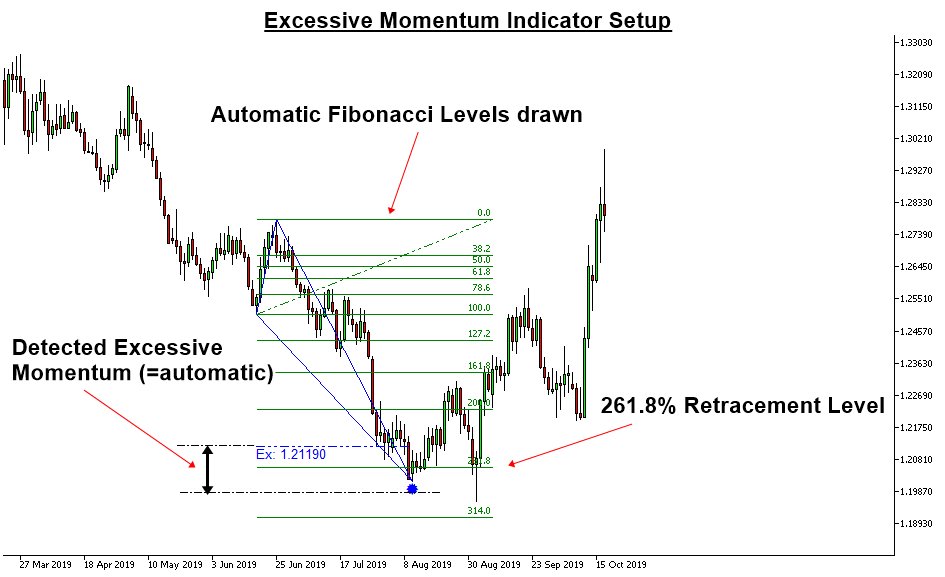
Simple Introduction to Excessive Momentum Indicator
Excessive Momentum Indicator provides you the ability to trade with excessive momentum. Let us start this simple introduction. Firstly, understand that excessive momentum could possibly point out some anomaly movement or anomaly momentum in the market. To help your understanding, you can consider the insufficient momentum (i.e. exceptionally low volatility market or sideways market) as the opposite concept against excessive momentum. Our Excessive momentum indicator provides the automatic way of measuring the excessive momentum in your chart.
Once Excessive momentum is detected, then it will draw the Fibonacci Levels in the sensible place in your chart automatically. Then you take this as your trading entry. It is simple and easy to trade. Most importantly, it is powerful indicator that alarm you the important trading entry in advance.
https://algotrading-investment.com/portfolio-item/excessive-momentum-indicator/
https://www.mql5.com/en/market/product/30641
https://www.mql5.com/en/market/product/30621

Young Ho Seo
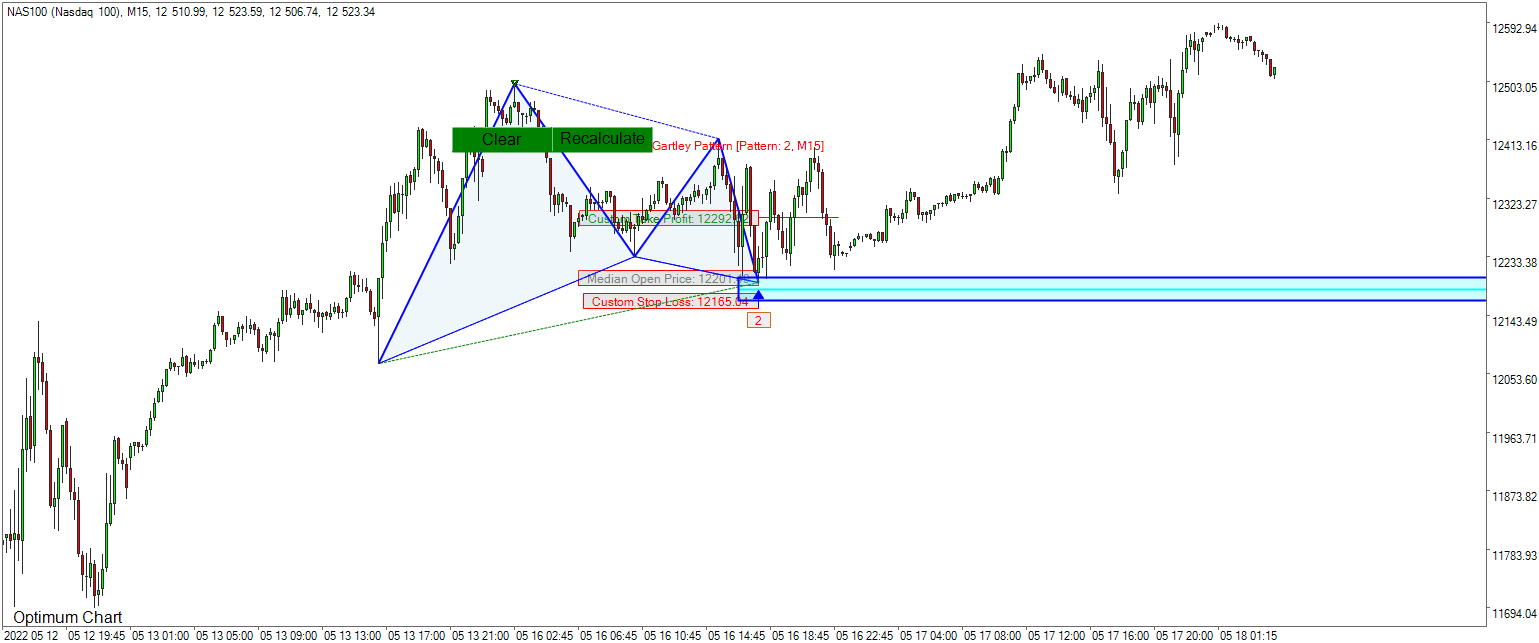
Gartley Pattern – Harmonic Pattern
We provides the testing results for Gartley Pattern in Forex and stock market. Gartley Pattern is considered as the harmonic pattern too. This study uses non repainting and non lagging Harmonic Pattern detection algorithm and the detection algorithm is synchrozined between history and live trading. Hence, this study will show both failed and successful pattern to provide the unbiased results, which is close to the real performance. Typically, a repainting indicator will show the successful pattern only making it hard to check the real performance of your strategy. Hence, you can not check the real performance of the strategy using the repainting indicator. With our Pattern Detection algorithm, you can trade what you see. That can be done by only one button click.
If you want to become a profitable trader, you should study the strategy in the scientific manner. It basically involves checking the repeatability or reproducibility. We provide this study to enhance the forex and stock trading for the trading community. We also want to add some scientific value for the Fibonacci pattern, Harmonic Pattern, X3 Chart Pattern and Elliott Wave Pattern too.
We used the Optimum Chart to test this pattern. You can also use X3 Chart Pattern Scanner in MetaTrader 4 and MetaTrader 5 to get similar results. The Gartley Pattern in this study has the following Structure:
N: 3, C0: 0.618 to T0: 3
R0: 1.272, R1: 0.382 -0.886, R2: 0.618
Points to watch out in this study:
Price movement around the Pattern Completion Zone (= Trading Zone) in the Gartley Pattern
Risk management around the Trading Zone. Look for the trading entry, where at least, Reward > Risk x 2
Possibility for breakout trading around the trading zone (=use them as support and resistance)
Look for continuation pattern vs reversal pattern
You can use this Reference to find out how to use these price patterns for your trading.
Science Of Support, Resistance, Fibonacci Analysis, Harmonic Pattern, Elliott Wave and X3 Chart Pattern (In Forex and Stock Market Trading)
Guide to Precision Harmonic Pattern Trading (Mastering Turning Point Strategy for Financial Trading)
Technical Analysis in Forex and Stock Market (Supply Demand Analysis and Support Resistance)
Profitable Chart Patterns in Forex and Stock Market (Fibonacci Analysis, Harmonic Pattern, Elliott Wave, and X3 Chart Pattern)
Scientific Guide to Price Action and Pattern Trading (Wisdom of Trend, Cycle, and Fractal Wave)
Here is the PDF file presenting Gartley Pattern In Forex Market.
https://algotrading-investment.com/manual/pricepattern/Gartley%20Pattern%20in%20Forex.pdf
Here is the PDF file presenting Gartley Pattern in Stock Market.
https://algotrading-investment.com/manual/pricepattern/Gartley%20Pattern%20in%20Stock%20Market.pdf
Here is the YouTube Link for Gartly Pattern Trading.
https://youtu.be/J3vjlHatUTI
This study was performed using the Robo Advisor built inside Optimum Chart.
https://algotrading-investment.com/2019/07/23/optimum-chart/
You can also check the similar results using the X3 Chart Pattern Scanner in MetaTrader 4 and MetaTrader 5 platform (Non repainting and non lagging algorithm).
https://www.mql5.com/en/market/product/41993
https://www.mql5.com/en/market/product/41992
https://algotrading-investment.com/portfolio-item/profitable-pattern-scanner/
Harmonic Pattern Plus is the repainting Harmonic Pattern Scanner with tons of powerful features at affordable cost.
https://algotrading-investment.com/portfolio-item/harmonic-pattern-plus/
https://www.mql5.com/en/market/product/4488
https://www.mql5.com/en/market/product/4475
Harmonic Pattern Scenario Planner is the advanced repainting Harmonic Pattern Scanner with tons of powerful features at affordable cost.
https://algotrading-investment.com/portfolio-item/harmonic-pattern-scenario-planner/
https://www.mql5.com/en/market/product/6101
https://www.mql5.com/en/market/product/6240

Young Ho Seo
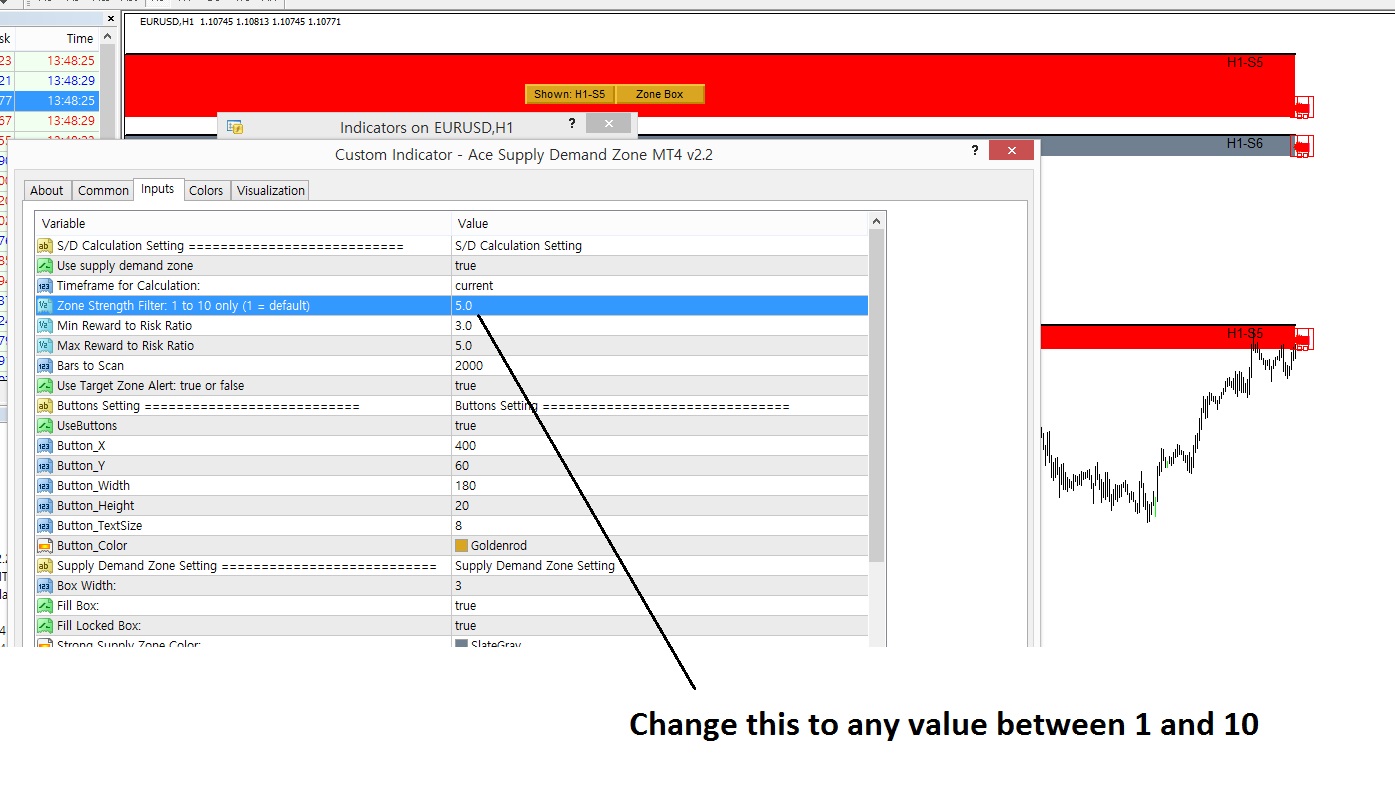
Choosing Strength at Origin in your Supply Demand Zone indicator
Ace Supply Demand Zone indicator is non repainting Supply Demand zone indicator. You can consider it as the advanced support and resistance indicator too. Strength at Origin input is an important input for supply and demand zone. This input can be selected between 1 and 10. Strength at Origin 1 is less significant and 10 is more significant in relative term. But this is only rough guide line about Strength at Origin input for supply and demand zone trading. We also provide the screenshot of how to do it in your chart. We hope this article is useful.
In addition, we provide the YouTube video for Ace Supply Demand Zone Indicator. In terms of indicator operation, both mean reversion supply demand and ace supply demand zone indicator are similar. Hence, you can watch this YouTube Video to learn the basic operation with the supply demand zone indicator.
YouTube “Supply Demand Zone Indicator”: https://youtu.be/lr0dthrU9jo
Below is link to Ace Supply Demand Zone Indicator.
https://www.mql5.com/en/market/product/40076
https://www.mql5.com/en/market/product/40075
https://algotrading-investment.com/portfolio-item/ace-supply-demand-zone/

Young Ho Seo
Generating Income with Chart Patterns
Profitable Chart Patterns include Fibonacci Price Patterns, Harmonic Patterns, Elliott Wave, X3 Chart Patterns as well as many other tradable patterns.
Chart Patterns are the good buy and sell signal generator for trading. It provides you the early signal at the turning point. Unlike other technical indicator, you are not lagging with these patterns. Hence you can always move ahead of other trader.
In addition, it is useful because it is extremely easy to combine with other analysis technique in your trading decision. In this short book, we provide the details of these chart patterns in Forex market with some practical tutorials.
In this book below, we explain how to make the best use of Chart Patterns for your trading. What is even better, we have included the bonus chapter of support and resistance.
Website links: https://algotrading-investment.com/portfolio-item/profitable-chart-patterns-in-forex-and-stock-market/
Below is the Harmonic pattern, Elliott Wave patterns and X3 pattern detection tools developed for MetaTrader, the most popular Forex Trading platform.
1. Harmonic Pattern Plus
One of the first automated Harmonic Pattern detection tool released in 2014. It can detect 11 most popular harmonic patterns with well-defined trading entries and stops. Pattern Completion Interval, Potential Reversal Zone and Potential Continuation Zone are supported. In addition, other dozens of powerful features are added like Japanese candlestick detection, etc. Because of affordable price, this harmonic pattern detection indicator is loved by many traders.
https://www.mql5.com/en/market/product/4488
https://www.mql5.com/en/market/product/4475
https://algotrading-investment.com/portfolio-item/harmonic-pattern-plus/
2. Harmonic Pattern Scenario planner
It is an advanced Harmonic Pattern indicator. On top of the features of Harmonic Pattern Plus, you can also predict future harmonic patterns through simulation. This is the tactical harmonic pattern tool designed for Professional harmonic pattern trader. Because of affordable price, this harmonic pattern detection indicator is loved by many traders.
https://www.mql5.com/en/market/product/6240
https://www.mql5.com/en/market/product/6101
https://algotrading-investment.com/portfolio-item/harmonic-pattern-scenario-planner/
3. X3 Chart Pattern Scanner
X3 Chart Pattern is our next generation Chart Pattern Scanner. This is non-repainting and non-lagging Harmonic Pattern Indicator. On top of that, this tool can detect Elliott Wave Pattern and X3 Chart Patterns. It can detect over 20 Chart Patterns. The bonus is that you can also detect around 52 Japanese candlestick patterns.
https://www.mql5.com/en/market/product/41993
https://www.mql5.com/en/market/product/41992
https://algotrading-investment.com/portfolio-item/profitable-pattern-scanner/

: