Andrei Novichkov / Perfil
- Información
|
8+ años
experiencia
|
18
productos
|
36
versiones demo
|
|
6
trabajos
|
0
señales
|
0
suscriptores
|
Translations from Pine.
Telegram: https://t.me/fxstill (Literature on cryptocurrencies, development and code)
YouTube: https://www.youtube.com/@FxStill
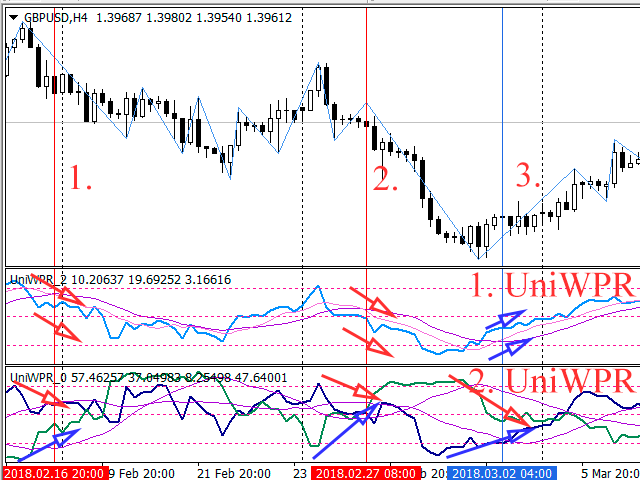
GBPUSD, H4
1. UniWPR - Main View
2. UniWPR - Additional View.
3 Good signals on the main view.
In Addition View, there is a exit from overbought and oversold zones


Terminamos el tema de la simulación de los patrones que surgen al comerciar con cestas de parejas de divisas. En este artículo, presentamos los resultados de la simulación de los patrones que monitorean el movimiento de las divisas de la pareja en relación una a otra.

Seguimos con la simulación de los patrones y la comprobación de las metodologías descritas en los artículos sobre la negociación con cestas de parejas de divisas. Vamos a considerar en la práctica si se puede usar los patrones de la intersección de la media móvil por el gráfico de WPR combinado, y si se puede, de qué manera.

Comenzamos a simular los patrones y comprobar las metodologías descritas en los artículos dedicados al comercio con cestas de parejas de divisas. Vamos a ver en la práctica cómo se aplican los patrones de ruptura de los niveles de sobrecompra/sobreventa.

Este es el artículo final dedicado a los patrones que aparecen al comerciar con cestas de parejas de divisas. Se han analizado varios indicadores combinados de tendencia, así como la aplicación de las construcciones gráficas habituales.

En el artículo se analiza la creación de documentación para el código en MQL5, comenzando por la automatización de la colocación de los tags necesarios. A continuación, se describe el trabajo con el programa Doxygen, su correcta configuración y la obtención de resultados en diferentes formatos: en html, en HtmlHelp y en PDF.

Continuamos con la conversación sobre los patrones que puede detectar el tráder al comerciar con cestas de parejas de divisas. En esta parte se describen los patrones formados al usar los indicadores de tendencia combinados. Como herramienta de análisis se utilizan indicadores basados en el índice de la divisa.
Para cualquier número de órdenes de mercado y pendientes, la utilidad calcula el "nivel de equilibrio" - precio medio ponderado. El cálculo se realiza individualmente para las órdenes de compra y venta. El precio medio ponderado se marca con una etiqueta y una línea horizontal de color también por separado - una línea para el precio de compra, y la otra para el precio de venta. Parámetros de entrada: Incluir pendientes. Incluye las órdenes pendientes en el cálculo. El valor por defecto de este

Continuando con el artículo anterior, donde se analizaba el comercio con las cestas de divisas, estudiaremos los patrones que puede detectar el tráder. También profundizaremos en los aspectos positivos y negativos de cada patrón y veremos las recomendaciones que se dan para cada uno de ellos. Como instrumento de análisis se han adoptado indicadores construidos sobre el oscilador de Williams.
If a complex grid with specified stop loss and take profit levels has been created in the wrong place by mistake, it is not necessary to remove it and start over again. The grid can be moved to a new place using the mouse. Drag the script to the chart and drop it where the grid should be moved. The grid will be moved, keeping the distance between orders, distances to stop loss and take profit. The script works exclusively with pending orders , market orders will be left unchanged. Input
Si por error se ha creado una rejilla compleja con niveles de stop loss y take profit especificados en un lugar equivocado, no es necesario eliminarla y volver a empezar. La rejilla puede moverse a un nuevo lugar utilizando el ratón. Arrastre el script al gráfico y suéltelo donde desee mover la rejilla. La rejilla se moverá, manteniendo la distancia entre órdenes, distancias a stop loss y take profit. El script funciona exclusivamente con órdenes pendientes , las órdenes de mercado no se


