• Información general
  • Comentarios (3)
  • Discusión
  • Novedades

Fixed Range Volume Profile MT5

2
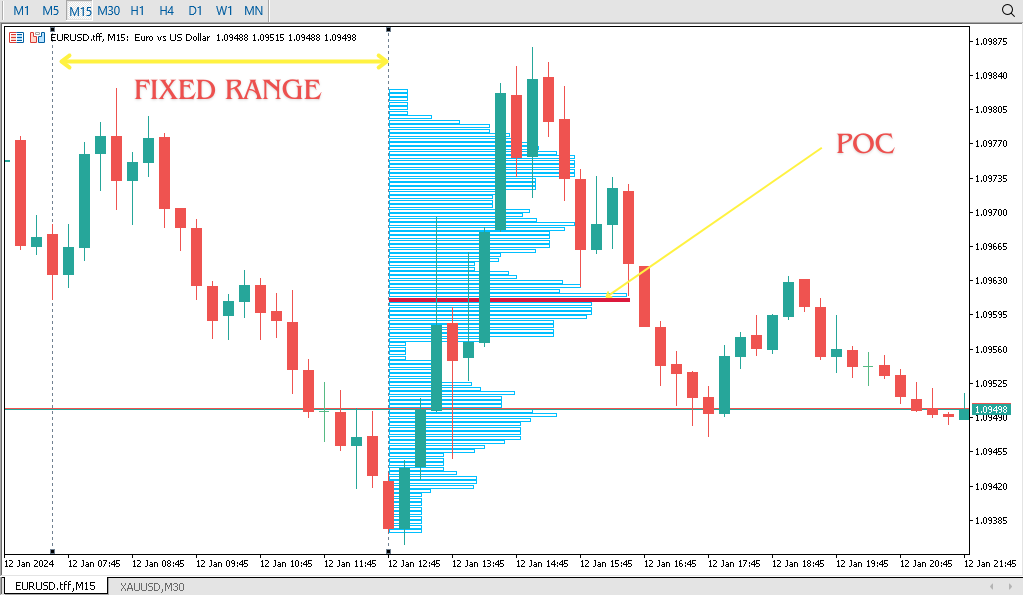
Perfil de volumen de rango fijo automático con alertas para MT5

Este indicador muestra dónde ha pasado más tiempo el precio, destacando niveles importantes que se pueden utilizar en el comercio.

y puede mostrar la densidad de precios a lo largo del tiempo, destacando los niveles de precios más importantes, el área de valor y el valor de control de una sesión de negociación determinada. Este indicador se puede adjuntar a marcos de tiempo entre M1 y D1 y mostrará el perfil de mercado para sesiones diarias, semanales, mensuales o incluso intradiarias. Los plazos más bajos ofrecen una mayor precisión. Se recomiendan plazos más largos para una mejor visibilidad. También es posible utilizar una sesión de rectángulo de sorteo libre para crear un perfil de mercado personalizado en cualquier período de tiempo. Seis esquemas de color diferentes están disponibles para dibujar los bloques del perfil. También es posible dibujar perfiles como un histograma de color simple. Alternativamente, puede optar por colorear el perfil en función de las barras alcistas/bajistas. Este indicador se basa en la acción del precio desnudo y no utiliza ningún indicador estándar.

Un sistema de alertas está disponible para el cruce de precios de los niveles de área de valor alto y bajo, mediana y zonas de impresión única.

Ajustes de entrada :

StartFromDate (predeterminado = __DATE__): si StartFromCurrentSession es falso, el indicador comenzará a dibujar perfiles a partir de esta fecha. Se atrae al pasado. Por ejemplo, si configura 2018-01-20 y SessionsToCount es 2, dibujará los perfiles para 2018-01-20 y 2018-01-19.


Sesión (predeterminado = Diaria): sesión de negociación para el perfil de mercado: Diaria, Semanal, Mensual, Intradiaria y Rectángulo. Para que se calcule una sesión de rectángulo, se debe agregar al gráfico un objeto de gráfico de rectángulo cuyo nombre comience con MPR. Al presionar 'r' en el teclado, se agregará automáticamente un objeto rectangular con el nombre adecuado.


StartFromCurrentSession (predeterminado = verdadero): si es verdadero, el indicador comienza a dibujarse a partir de hoy; de lo contrario, a partir de la fecha indicada en StartFromDate.


SeamlessScrollingMode (predeterminado = falso): si es verdadero, los parámetros StartFromDate y StartFromCurrentSession se ignoran; las sesiones se calculan y muestran a partir de la barra más a la derecha de la posición actual del gráfico. Esto permite retroceder en el tiempo indefinidamente para ver sesiones pasadas.


ValueAreaPercentage (predeterminado = 70): un porcentaje de las TPO de la sesión para incluir en el área de valor.


SessionsToCount (predeterminado = 2): para cuántas sesiones de negociación dibujar los perfiles de mercado.
EnableDevelopingPOC (predeterminado = falso): si es verdadero, se dibujarán varias líneas horizontales para representar cómo se desarrolló el punto de control a lo largo de la sesión.
Productos recomendados
Market Profile Heat indicator  — is a classic Market Profile implementation that can show the price density over time, outlining the most important price levels, value area, and control value of a given trading session. This indicator can be attached to timeframes between M1 and D1 and will show the Market Profile for daily, weekly, monthly, or even intraday sessions. Lower timeframes offer higher precision. Higher timeframes are recommended for better visibility. It is also possible to use a f
BoxChart MT5
Evgeny Shevtsov
5 (7)
The market is unfair if only because 10% of participants manage 90% of funds. An ordinary trader has slim changes to stand against these "vultures". This problem can be solved. You just need to be among these 10%, learn to predict their intentions and move with them. Volume is the only preemptive factor that faultlessly works on any timeframe and symbol. First, the volume appears and is accumulated, and only then the price moves. The price moves from one volume to another. Areas of volume accumu
Transmisión en vivo del indicador en YouTube. Haga clic en el enlace a continuación para obtener más credibilidad. También hay videos del indicador que puede ver. Tenga en cuenta que la transmisión llega tarde, no confíe en ella. Solo es una revisión del indicador. solo una revisión de la precisión del indicador, que no pierde casi y la tasa de ganancia alcanza el 95% Trabajaré con gran precisión en la moneda CRASH 1000 INDICES
VP hidden
Emr Aljnaby
4.43 (7)
The indicator works to convert normal volume into levels and determine financial liquidity control points. It is very similar in function to Fixed Volume Profile. But it is considered more accurate and easier to use than the one found on Trading View because it calculates the full trading volumes in each candle and in all the brokers present in MetaTrade, unlike what is found in Trading View, as it only measures the broker’s displayed prices. To follow us on social media platforms: tel
FREE
Session CVD
Riccardo Moreo
This is the Cumulative Volume Delta (CVD) , it's an indicator that calculates the long and short volumes plotting it then as a line on the chart, the most efficient way to use this indicator is by comparing the CVD line to the current chart and looking at the Divergence beetween the two of them, so that you can identify fake-outs and liquidty sweeps. for example in the picture that i put below you can see that the price has made a lower low but the CVD didn't, that means the volumes didn't suppo
FREE
This indicator will show a vertical representation of the volume distribution within a selected user range. This is a free version of the full product. It is limited to use on a week old data or older. Find the full product at  https://www.mql5.com/en/market/product/42234 . Main features: This Indicator will create an image that will allow viewing the tick volume per price level in a graphical form. The indicator will work on any range size in any time-frame, limited only by your computer m
FREE
Was: $249  Now: $99   Market Profile defines a number of day types that can help the trader to determine market behaviour. A key feature is the Value Area, representing the range of price action where 70% of trading took place. Understanding the Value Area can give traders valuable insight into market direction and establish the higher odds trade. It is an excellent addition to any system you may be using. Inspired by Jim Dalton’s book “Mind Over Markets”, this indicator is designed to suit the
Z Score Plus MT5
Eduardo Da Costa Custodio Santos
En finanzas, las puntuaciones Z son medidas de la variabilidad de una observación y los comerciantes pueden utilizarlas para ayudar a determinar la volatilidad del mercado. Los puntajes Z le dicen a los comerciantes si un puntaje es típico para un conjunto de datos específico o es atípico. Los puntajes Z también permiten a los analistas adaptar puntajes de múltiples conjuntos de datos para hacer puntajes que puedan compararse con mayor precisión entre sí. # En la práctica, tenemos el ZScore con
The utility displays the order book, as well as increases its depth, remembering the location of applications that have gone beyond the current "window" view. With the utility user can perform quick trading actions in one click - placing/cancelling/editing of explicit and hidden orders, and also opening/editing positions. Utility features The orders book display works only on those trading symbols for which it is broadcast by the broker. To reset the information about the rows that were record
Forex Volume MT5
KEENBASE SOFTWARE SOLUTIONS
KT Forex Volume shows the buying and selling volume of a currency pair in the form of a colored histogram. The volume is made of buying and selling transactions in an asset. In FX market: If the buying volume gets bigger than the selling volume, the price of a currency pair would go up. If the selling volume gets bigger than the buying volume, the price of a currency pair would go down. Features Avoid the bad trades by confirming them using the tick volume data. It helps you to stay on the si
VolumeProfile MT5
Robert Hess
3.75 (8)
Description: The Volume Profile displays detailed informations of historical trading activities at certain price levels (Market Profile). Locate the areas with the best prices in the market and get an advantage over other market participants. Features: Customizable Market Profile Shows the "fair" Value Area with 70% of all Volume Shows critical low volume zones Shows VPOC, VAL and VAH Points integrated resource management to reduce the load while working with multiple charts Works on all tim
Heatmap Volume Profile
Olexandr Savchuk
4.25 (4)
A Heatmap with a Volume Profile is like a thermal imager or x-ray machine. It will help you to estimate the relative distribution of volume during the price movement and to understand  the relationship between volume and price. Indicator Volume Profile "Volumos Maxima" is a powerful tool for analyzing this relationship. After simple experimentation with heatmap, you can find that each trading instrument has its own “ characteristic ” way of distributing volume. And this will help you to make a b
Este producto le ayudará a comprar con beneficio y usar dos productos más populares para el análisis de los volúmenes de las peticiones y operaciones en los mercados de equidad: Actual Depth of Market Chart Actual Tick Footprint Volume Chart Este producto ha integrado toda la potencia de cada uno de los indicadores y se ofrece como un archivo único. Las rebajas anticrisis. ¡Hoy el precio del producto está rebajado! ¡Dese prisa! Las capacidades funcionales del producto Actual COMBO Depth of Mark
To get access to MT4 version please click here . This is the exact conversion from TradingView: " WaveTrend" by LazyBear. This is a light-load processing and non-repaint indicator. All input options are available. Buffers are available for processing in EAs. You can message in private chat for further changes you need. The filling area option is omitted to fit into MT5 graphics.
El indicador construye cotizaciones actuales, que se pueden comparar con las históricas y, sobre esta base, hacer un pronóstico de movimiento de precios. El indicador tiene un campo de texto para una navegación rápida a la fecha deseada. Opciones: Símbolo - selección del símbolo que mostrará el indicador; SymbolPeriod - selección del período del cual el indicador tomará datos; IndicatorColor - color del indicador; HorisontalShift: cambio de cotizaciones dibujadas por el indicador
Blahtech Supply Demand MT5
Blahtech Limited
4.54 (13)
Was: $299  Now: $99   Supply Demand uses previous price action to identify potential imbalances between buyers and sellers. The key is to identify the better odds zones, not just the untouched ones. Blahtech Supply Demand indicator delivers functionality previously unavailable on any trading platform. This 4-in-1 indicator not only highlights the higher probability zones using a multi-criteria strength engine, but also combines it with multi-timeframe trend analysis, previously confirmed swings
BoxProfile MT5
Evgeny Shevtsov
4.56 (9)
The indicator displays volume profiles based on the nesting principle. Profiles periods are pre-set so that each subsequent profile has a length twice as long as the length of the previous profile. In addition to profiles, the indicator displays volume clusters sorted by color, depending on the volume they contain. Indicator operation features The indicator works on typical timeframes from M5 to MN, but for calculations uses historical data from smaller timeframes: M1 - for timeframes from M5
FREE
AW Candle Patterns
AW Trading Software Limited
El indicador de patrones de velas AW es una combinación de un indicador de tendencia avanzado combinado con un potente escáner de patrones de velas. Es una herramienta útil para reconocer y resaltar los treinta patrones de velas más fiables. Además, es un analizador de tendencias actual basado en barras de colores con un       panel de tendencias de múltiples marcos de tiempo que se puede cambiar de tamaño y posicionar. Una capacidad única para ajustar la visualización de patrones según el filtr
Call/Put Ratio is one of the most well-known indicators of the market sentiment. The indicator has been developed by Martin Zweig. It is based on real volumes of the CBOE option market. As we know, a Call option gives its owner the right to buy the underlying asset at a predetermined price. A Put option gives the right to sell it. Thus, increasing volumes for Call options indicate the increasing demand. The growth of Put option volumes shows that supply starts exceeding demand. If we divide the
Volume Profile เป็นเครื่องมือที่ใช้สำหรับการวิเคราะห์ระดับการซื้อขายของตลาดในแต่ละระยะเวลาโดยใช้ปริมาณการซื้อขาย (volume) ซึ่งช่วยให้เราเข้าใจว่ามีการซื้อขายเกิดขึ้นมากที่สุดที่ราคาใด รวมทั้งช่วยในการหาจุดที่มีความนิยมในการซื้อขาย (Point of Control: POC) และระดับการซื้อขายอื่น ๆ ที่สำคัญ เรียกว่า Value Area. การใช้งาน Volume Profile ในการวิเคราะห์ตลาดมักจะมีขั้นตอนดังนี้: กำหนดระยะเวลาที่ต้องการวิเคราะห์ : เราต้องกำหนดระยะเวลาที่เราสนใจในการวิเคราะห์ Volume Profile เช่น ชั่วโมง, วัน, หรือสัปดาห์
Delta Single Volume is a very powerful indicator that reads the supply on the Market. It calculates the Delta from movement of the price and the difference of BUY and SELL volumes. Its special structure allows you to get all timeframe values available on the MT5 platform. It works on Tick Volumes and Real Volumes (if avalaibles on your Broker). A good observation of this instrument can suggest great entry points and possible reversal. We are confident that this tool will help you to improve yo
Description: The indicator of tick volumes Better Volume MT5 allows you to assess the general mood of the market and quite accurately catch the moments of the formation of large movements. The indicator is a color histogram in an additional window. In the calculation of Better Volume MT5 the Price Action combinations are taken into account, the values of the volumes with the height of columns and color marking are displayed. Input parameters: MAPeriod - period for calculating the moving average
Market book
Aliaksandr Hryshyn
Profundidad de visualización del mercado. Se pueden mostrar hasta dieciséis instrumentos. Hay un desplazamiento automático de precios, que se puede desactivar haciendo clic en "A" en la parte superior de la ventana. Es un indicador bastante hermoso, puede actuar como una pantalla de presentación, no será tan aburrido verse como un gráfico normal, perfecto para meditar, especialmente después de grandes pérdidas en el mercado. El indicador no es para negociar, por lo que su depósito será más compl
¡Descubre el poder del análisis de volumen con nuestro indicador de perfil de volumen para Metatrader!   /   Version MT4 Basic Volume Profile es un indicador especificamente diseñado para traders manuales que buscan optimizar su operativa. El indicador de perfil de volumen es una herramienta esencial para cualquier trader serio que desee entender mejor el comportamiento del mercado. Con nuestra solución innovadora podrás visualizar de manera clara y concisa cómo se distribuye el volumen de ne
This new unique indicator Actual tick footprint (volume chart) is developed for using on Futures markets, and it allows seeing the volume of real deals right when they are performed. The indicator Actual tick footprint (volume chart) represents a greatly enhanced tick chart that includes additional information about the volume of deal performed at a specific price. In addition, this unique indicator for MetaTrader 5 allows to clearly detecting a deal type – buy or sell. Alike the standard tick c
La singularidad de este indicador radica en el algoritmo de contabilidad de volumen: la acumulación se produce directamente para el período seleccionado sin referencia al comienzo del día. Las últimas barras se pueden excluir del cálculo, entonces los datos actuales tendrán menos influencia en los niveles significativos (volúmenes) formados anteriormente. Para un cálculo más preciso, los datos del gráfico M1 se utilizan de forma predeterminada. El paso de distribución de los volúmenes de precios
VR Grid Mt5
Vladimir Pastushak
3.6 (10)
El indicador VR Grid está diseñado para crear una cuadrícula gráfica con configuraciones definidas por el usuario. A diferencia de la cuadrícula estándar , VR Grid se utiliza para construir niveles circulares . Dependiendo de la elección del usuario, el paso entre los niveles de ronda puede ser arbitrario. Además, a diferencia de otros indicadores y utilidades, VR Grid mantiene la posición de la grilla incluso cuando cambia el período de tiempo o se reinicia el terminal. Las configuraciones, arc
FREE
Seconds Charts Demo
Aleksandr Goryachev
5 (1)
Micro  Demo  ******************* Секундные графики в Meta Trader 5 ********************** Более точного инструмента для входа в сделку вы не найдёте. Платная полная версия:  Micro "Second charts" В демоверсии секундные периоды сменяются случайным образом через случайные интервалы времени. Отсутствует автоматическая настройка периодов бесплатных индикаторов.   Входные параметры: Displayed bars - отображаемые бары Step of price levels, pp, 0-off - шаг отрисовки ценовых уровней, пункты Scale
FREE
Volume Profile For MT5
Abdelkhabir Yassine Alaoui
Volume Profile is a very useful indicator . it allows you to spot the price levels where important price action took place. It is similar to support and resistance levels but with a different logic. ( Check Out  Fixed Range Volume Profile MT5  ) One of the first thing that traders mark up when analyzing a chart is support and resistance. Volume Profile can be used for doing that too. The indicator scans the defined number of previous bars and calculates the volume of activity at each price
Tick Chart — full-featured chart for MetaTrader 5. A utility for creating and working with a tick chart in the MetaTrader 5 terminal. You can create a tick chart that works exactly the same as a regular chart. You can apply indicators, Expert Advisors and scripts to the tick chart. You get a fully functional tick chart on which you can work just as well as on a regular chart. You can enable the output of the Ask price data. The data are generated in the form of the upper shadow of a tick bar. Fr
Los compradores de este producto también adquieren
Atomic Analyst MT5
Issam Kassas
5 (15)
En primer lugar, vale la pena enfatizar que este Indicador de Trading no repinta, no redibuja y no se retrasa, lo que lo hace ideal tanto para el trading manual como para el automatizado. Manual del usuario: configuraciones, entradas y estrategia. El Analista Atómico es un Indicador de Acción del Precio PA que utiliza la fuerza y el impulso del precio para encontrar una mejor ventaja en el mercado. Equipado con filtros avanzados que ayudan a eliminar ruidos y señales falsas, y aumentan el poten
Primero que todo, vale la pena enfatizar que este Sistema de Trading es un Indicador No Repintado, No Redibujado y No Retrasado, lo que lo hace ideal tanto para el trading manual como para el automatizado. Curso en línea, manual y descarga de ajustes preestablecidos. El "Sistema de Trading Inteligente MT5" es una solución completa de trading diseñada para traders nuevos y experimentados. Combina más de 10 indicadores premium y presenta más de 7 estrategias de trading robustas, lo que lo convie
Quantum Trend Sniper
Bogdan Ion Puscasu
5 (46)
Introduciendo       Indicador Quantum Trend Sniper   , el innovador indicador MQL5 que está transformando la forma en que identificas y negocias los cambios de tendencia. Desarrollado por un equipo de comerciantes experimentados con experiencia comercial de más de 13 años,       Indicador de francotirador de tendencia cuántica       está diseñado para impulsar su viaje comercial a nuevas alturas con su forma innovadora de identificar cambios de tendencia con una precisión extremadamente alta.
Gold Stuff mt5
Vasiliy Strukov
4.9 (181)
Gold Stuff mt5: un indicador de tendencia diseñado específicamente para el oro, también se puede usar en cualquier instrumento financiero. El indicador no se vuelve a dibujar ni se retrasa. El marco de tiempo recomendado es H1. IMPORTANTE! Póngase en contacto conmigo inmediatamente después de la compra para obtener instrucciones y bonificación!   Puede obtener una copia gratuita de nuestro indicador Strong Support y Trend Scanner, por favor envíe un mensaje privado. ¡a mí! PARÁMETROS Draw
AT Forex Indicator MT5
Marzena Maria Szmit
5 (3)
The AT Forex Indicator MT5 is a sophisticated trading tool designed to provide traders with a comprehensive analysis of multiple currency pairs. This powerful indicator simplifies the complex nature of the forex market, making it accessible for both novice and experienced traders. AT Forex Indicator uses advanced algorithms to detect trends, patterns and is an essential tool for traders aiming to enhance their forex trading performance. With its robust features, ease of use, and reliable signal
Este es un genial indicador para MT5 que ofrece señales precisas para entrar en una transacción sin redibujar. Se puede aplicar a cualquier activo financiero: fórex, criptomonedas, metales, acciones, índices. Nos dará valoraciones bastante precisas y nos dirá cuándo es mejor abrir y cerra una transacción. Eche un vistazo  al vídeo  (6:22), ¡contiene un ejemplo de procesamiento de una sola señal que ha amortizado el indicador! La mayoría de los tráders mejoran sus resultados comerciales durante l
Reversal First Impulse levels (RFI)      INSTRUCTIONS        RUS       -       ENG              R ecommended to use with an indicator   -   TPSpro  TREND PRO -  Version MT4                 A key element in trading is zones or levels from which decisions to buy or sell a trading instrument are made. Despite attempts by major players to conceal their presence in the market, they inevitably leave traces. Our task was to learn how to identify these traces and interpret them correctly. Main functi
Ante todo, vale la pena enfatizar que esta Herramienta de Trading es un Indicador No Repintado, No Redibujado y No Retrasado, lo que la hace ideal para el trading profesional. Curso en línea, manual del usuario y demostración. El Indicador de Conceptos de Acción del Precio Inteligente es una herramienta muy potente tanto para traders nuevos como experimentados. Combina más de 20 indicadores útiles en uno solo, combinando ideas avanzadas de trading como el Análisis del Trader del Círculo Inte
Trend Screener Pro MT5
STE S.S.COMPANY
4.88 (66)
Desbloquee el poder del comercio de tendencias con el indicador Trend Screener: ¡su solución definitiva para el comercio de tendencias impulsada por lógica difusa y un sistema multidivisa!Mejore su comercio de tendencias con Trend Screener, el revolucionario indicador de tendencias impulsado por lógica difusa. Es un poderoso indicador de seguimiento de tendencias que combina más de 13 herramientas y funciones premium y 3 estrategias comerciales, lo que lo convierte en una opción versátil para co
TPA True Price Action indicator reveals the true price action of the market makers through 100% non-repainting signals strictly at the close of a candle! TPA shows entries and re-entries, every time the bulls are definitely stronger than the bears and vice versa. Not to confuse with red/green candles. The shift of power gets confirmed at the earliest stage and is ONE exit strategy of several. There are available now two free parts of the TPA User Guide for our customers. The first "The Basics"
FX Power MT5 NG
Daniel Stein
5 (5)
Obtenga su actualización diaria del mercado con detalles y capturas de pantalla a través de nuestro Morning Briefing aquí en mql5 y en Telegram ! FX Power MT5 NG es la nueva generación de nuestro popular medidor de fuerza de divisas, FX Power. ¿Y qué ofrece este medidor de fuerza de nueva generación? Todo lo que le encantaba del FX Power original PLUS Análisis de fuerza de ORO/XAU Resultados de cálculo aún más precisos Períodos de análisis configurables individualmente Límite de cálculo persona
TPSproTREND PrO MT5
Roman Podpora
4.88 (8)
TPSpro TRENDPRO  - is a trend indicator that automatically analyzes the market and provides information about the trend and each of its changes, as well as giving signals for entering trades without redrawing! The indicator uses each candle, analyzing them separately. referring to different impulses - up or down impulse. Exact entry points into transactions for currencies, crypto, metals, stocks, indices!  -  Version MT4               DETAILED DESCRIPTION               R ecommended to use with
ICT, SMC, SMART MONEY CONCEPTS, SMART MONEY, Smart Money Concept, Support and Resistance, Trend Analysis, Price Action, Market Structure, Order Blocks, BOS/CHoCH,   Breaker Blocks ,  Momentum Shift,   Supply&Demand Zone/Order Blocks , Strong Imbalance,   HH/LL/HL/LH,    Fair Value Gap, FVG,  Premium  &   Discount   Zones, Fibonacci Retracement, OTE, Buy Side Liquidity, Sell Side Liquidity, BSL/SSL Taken, Equal Highs & Lows, MTF Dashboard, Multiple Time Frame, BigBar, HTF OB, HTF Market Structure
FX Volume MT5
Daniel Stein
4.94 (17)
Obtenga su actualización diaria del mercado con detalles y capturas de pantalla a través de nuestro Morning Briefing aquí en mql5 y en Telegram ! FX Volume es el PRIMER y ÚNICO indicador de volumen que proporciona una visión REAL del sentimiento del mercado desde el punto de vista de un bróker. Proporciona una visión impresionante de cómo los participantes institucionales del mercado, como los brokers, están posicionados en el mercado Forex, mucho más rápido que los informes COT. Ver esta info
Conviértase en un Breaker Trader y obtenga beneficios de los cambios en la estructura del mercado a medida que se invierte el precio. El indicador de ruptura de bloque de órdenes identifica cuándo una tendencia o movimiento de precio se acerca al agotamiento y está listo para revertirse. Le alerta sobre cambios en la estructura del mercado que generalmente ocurren cuando una reversión o un retroceso importante están a punto de suceder. El indicador utiliza un cálculo patentado que identific
Matrix Arrow Indicator MT5
Juvenille Emperor Limited
5 (14)
Matrix Arrow Indicator MT5   es una tendencia única 10 en 1 que sigue un indicador   100% sin repintado   de marcos temporales múltiples que se puede usar en todos los símbolos/instrumentos:   divisas ,   materias primas ,   criptomonedas ,   índices ,   acciones .  Matrix Arrow Indicator MT5  determinará la tendencia actual en sus primeras etapas, recopilando información y datos de hasta 10 indicadores estándar, que son: Índice de movimiento direccional promedio (ADX) Índice de canales de prod
XQ Indicator MetaTrader 5
Marzena Maria Szmit
5 (1)
Step into the realm of Forex trading with confidence and precision using XQ, a cutting-edge Forex indicator designed to elevate your trading game to unprecedented heights. Whether you're a seasoned trader or just stepping into the world of currency exchange, XQ Forex Indicator empowers you with the insights and signals needed to make informed trading decisions. The signal conditions are a combination of three indicators, and XQ Forex Indicator only display  medium and long-term trends . The ind
RelicusRoad Pro MT5
Relicus LLC
4.83 (23)
Ahora $ 147 (aumentando a $ 499 después de algunas actualizaciones) - Cuentas ilimitadas (PC o Mac) Manual de usuario de RelicusRoad + Videos de capacitación + Acceso al grupo privado de Discord + Estado VIP UNA NUEVA MANERA DE VER EL MERCADO RelicusRoad es el indicador comercial más poderoso del mundo para divisas, futuros, criptomonedas, acciones e índices, y brinda a los comerciantes toda la información y las herramientas que necesitan para mantenerse rentables. Brindamos análisis téc
Auto Order Block with break of structure based on ICT and Smart Money Concepts (SMC) Futures Break of Structure ( BoS )             Order block ( OB )            Higher time frame Order block / Point of Interest ( POI )    shown on current chart           Fair value Gap ( FVG ) / Imbalance   -  MTF      ( Multi Time Frame )    HH/LL/HL/LH  -  MTF      ( Multi Time Frame )  Choch  MTF      ( Multi Time Frame )  Volume Imbalance     ,  MTF          vIMB Gap’s Power of 3 Equal High
Advanced Supply Demand MT5
Bernhard Schweigert
4.53 (15)
¡Actualmente con 33% de descuento! ¡La mejor solución para cualquier tráder principiante o experto! Este indicador es una herramienta comercial única, de alta calidad y asequible, porque incorpora una serie de características patentadas y una nueva fórmula. Con esta actualización, podrá mostrar zonas de doble marco temporal. No solo podrá mostrar un marco temporal más alto, sino también mostrar ambos, el marco temporal del gráfico MÁS el marco temporal más alto: MOSTRANDO ZONAS ANIDADAS. A todos
Bill Williams Advanced
Siarhei Vashchylka
5 (7)
Bill Williams Advanced is designed for automatic chart analysis using Bill Williams' "Profitunity" system. The indicator analyzes four timeframes at once. Manual (Be sure to read before purchasing) Advantages 1. Automatically analyzes the chart using the "Profitunity" system of Bill Williams. The found signals are placed in a table in the corner of the screen. 2. Equipped with a trend filter based on the Alligator indicator. Most of the system signals are recommended to be used only accordi
Dark Absolute Trend   is an Indicator for intraday trading. This Indicator is based on   Trend Following  strategy but use also candlestick patterns and Volatility. We can enter in good price with this Indicator, in order to follow the main trend on the current instrument. It is advised to use low spread ECN brokers. This Indicator does   Not repaint   and   N ot lag . Recommended timeframes are M5, M15 and H1. Recommended working pairs: All. I nstallation and  Update Guide   -  Troubleshooting
Este tablero muestra los últimos   patrones armónicos   disponibles para los símbolos seleccionados, por lo que ahorrará tiempo y será más eficiente /   versión MT4 . Indicador gratuito:   Basic Harmonic Pattern Columnas del indicador Symbol:   aparecerán los símbolos seleccionados Trend :   alcista o bajista Pattern :   tipo de patrón (gartley, mariposa, murciélago, cangrejo, tiburón, cifrado o ABCD) Entry :   precio de entrada SL:   precio de stop loss TP1:   1er precio de toma de benefici
Easy By Sell is a market indicator for opening and closing positions. It becomes easy to track market entries with alerts. It indicates trend reversal points when a price reaches extreme values ​​and the most favorable time to enter the market. it is as effective as a Fibonacci to find a level but it uses different tools such as an algorithm based on ATR indicators and Stochastic Oscillator. You can modify these two parameters as you wish to adapt the settings to the desired period. My othe
IX Power MT5
Daniel Stein
5 (3)
IX Power   lleva por fin la insuperable precisión de FX Power a los símbolos que no son de Forex. Determina con exactitud la intensidad de las tendencias a corto, medio y largo plazo de tus índices, acciones, materias primas, ETF e incluso criptodivisas favoritas. Puede   analizar todo lo   que su terminal le ofrece. Pruébalo y experimenta cómo   tu timing mejora significativamente   a la hora de operar. Características principales de IX Power Resultados de cálculo 100% precisos y sin rep
Introduciendo       Quantum Breakout PRO   , el innovador indicador MQL5 que está transformando la forma en que comercia con Breakout Zones. Desarrollado por un equipo de comerciantes experimentados con experiencia comercial de más de 13 años,       Desglose cuántico PRO       está diseñado para impulsar su viaje comercial a nuevas alturas con su innovadora y dinámica estrategia de zona de ruptura. El indicador de ruptura cuántica le dará flechas de señal en las zonas de ruptura con 5 zonas
The Volume by Price Indicator for MetaTrader 5 features Volume Profile and Market Profile TPO (Time Price Opportunity). Volume and TPO histogram bar and line charts. Volume Footprint charts. TPO letter and block marker collapsed and split structure charts. Session filtering and grouping. Static, dynamic and flexible range segmentation and compositing methods with relative and absolute visualizations. Graphical layering, positioning and styling options to suit the user's analytic and aesthetic n
AW Trend Predictor MT5
AW Trading Software Limited
4.78 (58)
La combinación de niveles de tendencia y ruptura en un sistema. Un algoritmo de indicador avanzado filtra el ruido del mercado, determina la tendencia, los puntos de entrada y los posibles niveles de salida. Las señales indicadoras se registran en un módulo estadístico, que le permite seleccionar las herramientas más adecuadas, mostrando la efectividad del historial de señales. El indicador calcula las marcas Take Profit y Stop Loss. Manual e instrucciones ->   AQUÍ   / Versión MT4 ->   AQUÍ Có
Gartley Hunter Multi
Siarhei Vashchylka
5 (7)
Gartley Hunter Multi - An indicator for searching for harmonic patterns simultaneously on dozens of trading instruments and on all possible timeframes. Manual (Be sure to read before purchasing) | Version for MT4 Advantages 1. Patterns: Gartley, Butterfly, Shark, Crab. Bat, Alternate Bat, Deep Crab, Cypher 2. Simultaneous search for patterns on dozens of trading instruments and on all possible timeframes 3. Search for patterns of all possible sizes. From the smallest to the largest 4. A
Legacy of Gann for MT5
Pavel Zamoshnikov
5 (6)
The indicator very accurately determines the levels of the possible end of the trend and profit fixing. The method of determining levels is based on the ideas of W.D.Gann, using an algorithm developed by his follower Kirill Borovsky. Extremely high reliability of reaching levels (according to K. Borovsky  - 80-90%) Indispensable for any trading strategy – every trader needs to determine the exit point from the market! Precisely determines targets on any timeframes and any instruments (forex, met
Otros productos de este autor
Spread Actual
Abdelkhabir Yassine Alaoui
This indicator Displays current spread in the main window of the chart. You can modify the font parameters, indicator's position and the normalization of the spread value. The spread is redrawn after each tick, ensuring the most current and active spread value. This can be useful for brokers with variable spreads or with spreads that are widened often. You can also enable a spread label to be shown near the current Bid line. you can also set  alert : Email, and push notifications.
Basing Candles
Abdelkhabir Yassine Alaoui
Basing Candles indicator is an automatic indicator that detects and marks basing candles on the chart. A basing candle is a candle with body length less than 50% of its high-low range. A basing candle or basing candlestick is a trading indicator whose body length is less than half of its range between the highs and lows. That's less than 50% of its range. The indicator highlights the basing candles using custom candles directly in the main chart of the platform. The percentage criterion can be
FREE
Usdjpy Hunter
Abdelkhabir Yassine Alaoui
This is a classic trading strategy based on two Moving Averages crossover. customized for usdjpy with a Good risk management strategy RR 1/2 . (    Long when fast MA crosses slow MA from below and Short when fast MA crosses slow MA from above ) TF : 5MIN MAX Lot size to use : 2% e.g : Balance =100 => lot size = 0.02 Balance =1000 => lot size = 0.20 Balance =10000 => lot size = 2 ------
FREE
Volume Profile For MT5
Abdelkhabir Yassine Alaoui
Volume Profile is a very useful indicator . it allows you to spot the price levels where important price action took place. It is similar to support and resistance levels but with a different logic. ( Check Out  Fixed Range Volume Profile MT5  ) One of the first thing that traders mark up when analyzing a chart is support and resistance. Volume Profile can be used for doing that too. The indicator scans the defined number of previous bars and calculates the volume of activity at each price
DXY Correlation
Abdelkhabir Yassine Alaoui
El indicador se puede utilizar para el comercio de correlación dxy. calcula el índice del dólar (USDX o DXY) utilizando los pares de divisas XAU/USD, EUR/USD, USD/JPY, GBP/USD, USD/CAD, USD/CHF y USD/SEK. Para operar con ellos, debe encontrar un patrón de análisis técnico confirmado en el gráfico DXY y buscar un par de divisas correlacionado que tenga la misma imagen en su gráfico de precios.
Best Pivot Point Indicator  display   pivot points   and   support and resistance   lines for the intraday trading. It calculates them using its own formula based on the previous trading session The indicator can display the following levels in addition to plain pivot points: Previous session's High and Low, today's Open. Sweet spots. Fibonacci levels. Camarilla pivots. Midpoint pivots.
Support And Resistance indicator that can display round levels and zones . It shows them directly on the chart, providing an easy help when you want to set stop-loss or take-profit level, or when you want to see the next market target.   If an asset price is moving down and bounces back up, the level is called support (think: price floor). If an asset price is moving upward and hits a level where it reverses downward, this is called resistance (think: price ceiling).
Seconds Timeframes Chart MT5
Abdelkhabir Yassine Alaoui
Gráfico de segundos para MetaTrader 5 Los indicadores le permiten crear gráficos en el terminal MetaTrader 5 con un período de tiempo en segundos. El período de tiempo en dicho gráfico se establece en segundos, no en minutos u horas. Por lo tanto, puede crear gráficos con un período de tiempo inferior a M1. Por ejemplo, S15 es un período de tiempo con un período de 15 segundos. Puede aplicar indicadores, asesores expertos y scripts al gráfico resultante. Obtiene un gráfico completamente fun
Filtro:
Anton du
23
Anton du 2024.03.27 18:52 
 

it xdoes not work and there is no contact

Abdelkhabir Yassine Alaoui
2915
Respuesta del desarrollador Abdelkhabir Yassine Alaoui 2024.04.01 13:54
it work , you just you don't know how to use it ( Certain brokers don't provide volume data . this indicator won't work if there no volume data provided from the broker server )
fred6531
14
fred6531 2023.04.27 11:18 
 

El usuario no ha dejado ningún comentario para su valoración

Sarah
25
Sarah 2023.04.27 10:33 
 

El usuario no ha dejado ningún comentario para su valoración

Respuesta al comentario
Versión 1.2 2024.04.01
Fixed Range Selection Tool