Ai GbPUsD MT5
- Asesores Expertos
- Tais Miranda Hoffmann
- Versión: 2.50
- Actualizado: 9 noviembre 2023
- Activaciones: 12
Only 5 copies for $260, next price: $280(3 copies left)
For testing, in the settings, it is better to enable the full trade option.
For GBPUSD in time frame 15 and 30 minutes, 1 and 4 hours and daily
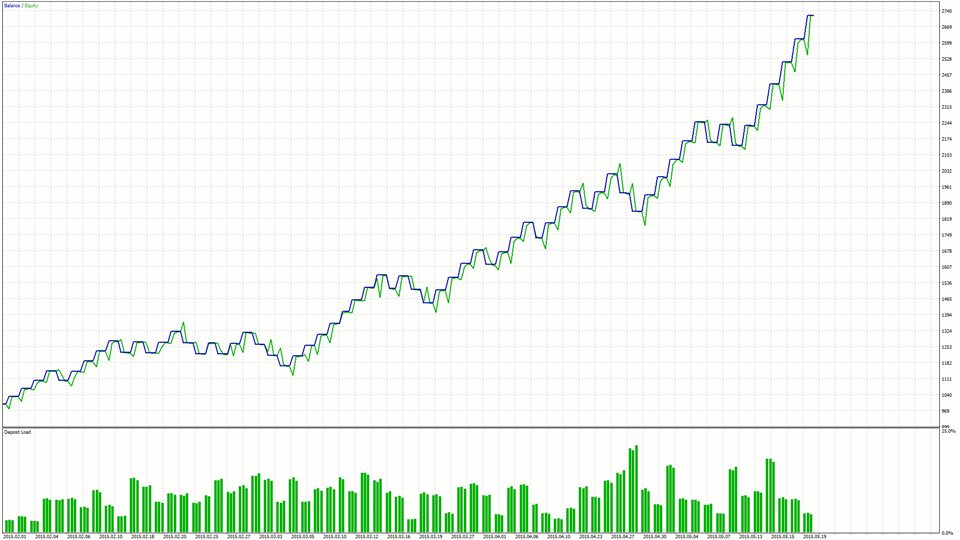
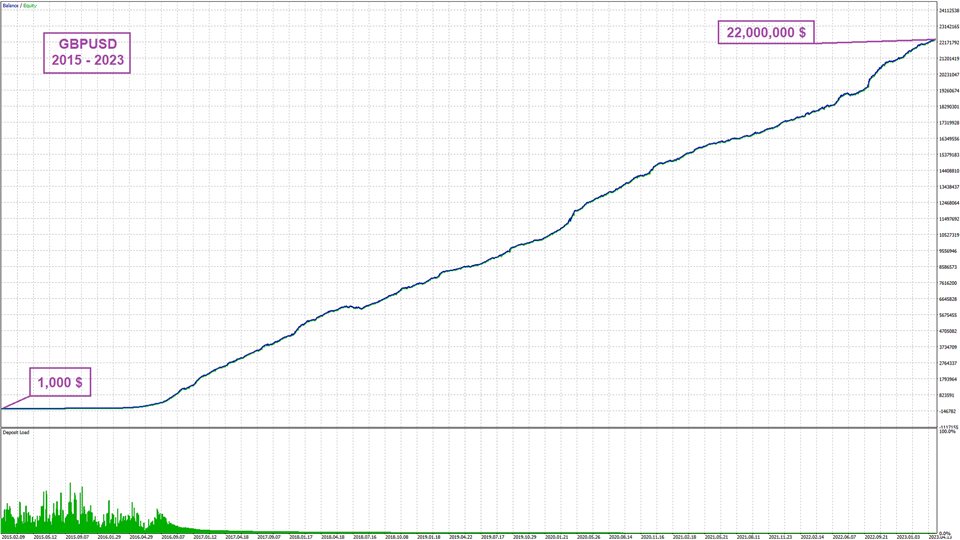
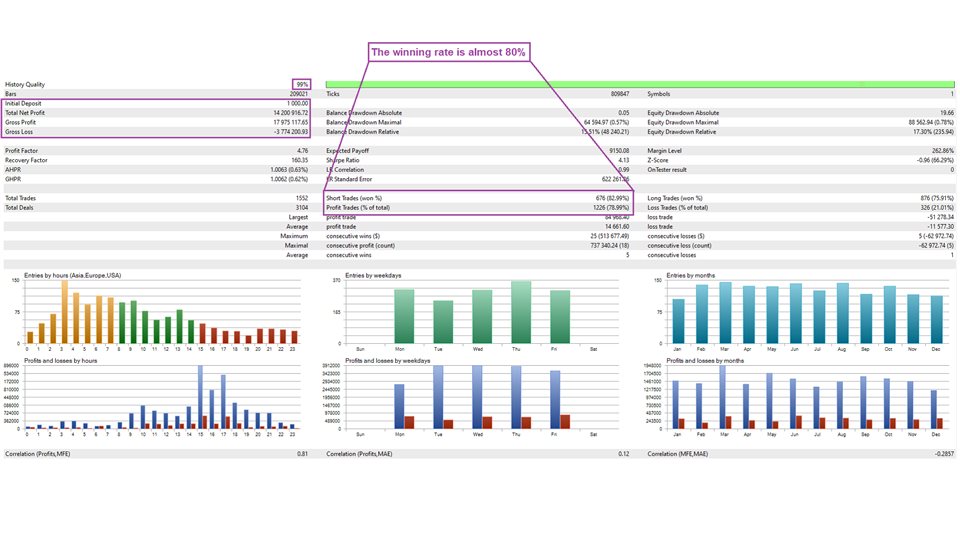
With Relatively large number of signals
(To receive all the signals: activate the full trade option in the settings and run the expert at the same time in several time frames)
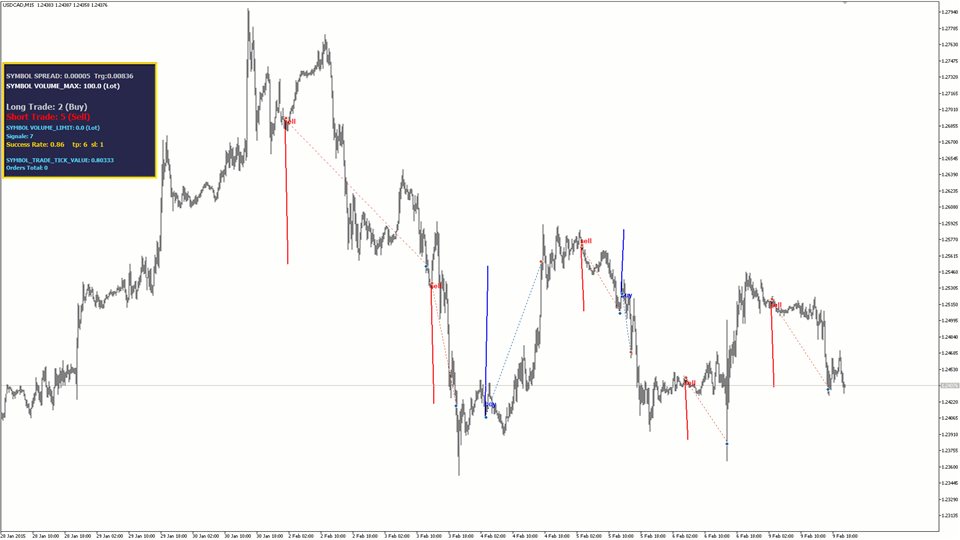
Has a TP and a SL
Without the use of dangerous strategies such as martingales and hedges
| Symbol | GBPUSD |
| Time frames | M15 , M30 , H1 , H4 , D1 |
| Minimum Deposit | 50$ |
| Brokers | Any brokers |
| Leverage | +50 |
Features of this expert:
Large number of trades
It has many settings (Over time, I will add the necessary settings)
Without the use of risky trades such as martingales and hedges
Can be used in GBPUSD symbols
Can be used in 15 and 30 minute time frames and 1 and 4 hours and daily
Tested in the most reputable brokers in the world
Has a TP and a SL
Profit limit and loss limit are fixed
R/R = 1 (SL=TP)
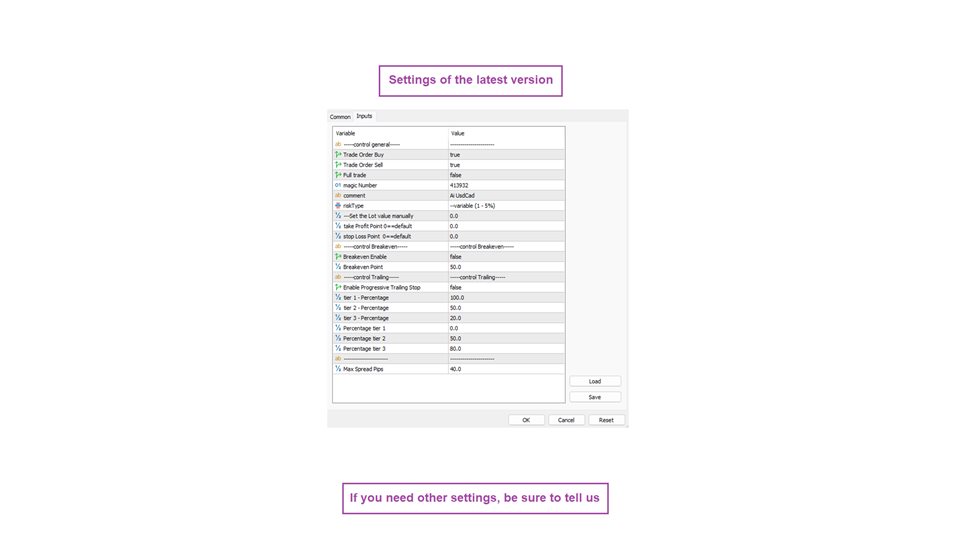
Trade Order "Buy" :If it is inactive, it will not do "buy" trades
Trade Order "Sell" : If it is inactive, it will not do "sell" trades
Full Trade : If it is active, the number of trades will increase. Expert also opens simultaneous trades.
Magic Number : Those who use several experts simultaneously in one account, this setting is useful
Comment : Specify the comment text of each trade. (useful for those who use several experts at the same time)
Risk Type : Specify the risk amount of each trade. In default, the risk is variable
Set the Lot value Manually: You can specify the lot amount in each trade. By default, the amount of the lot is variable (based on risk).
Take Profit : You can specify the profit limit for each trade. By default, the profit limit is variable.
Stop Loss : You can specify the Stop Loss for each trade. By default, the Stop Loss is variable.
Breakeven Enable : This setting activates the breakeven setting. For more information, read the configuration manual.
Breakeven Point : This setting determines the activation time of the breakeven settings. For more information, read the configuration manual.
Enable Progressive Trailing stop: This setting activates the Trailing stop setting. For more information, read the configuration manual.
Tier 1-3 : Trailing stop settings, For more information, read the configuration manual.
Max Spread PIPS : If your spread is more than this amount, Expert will not trade
Ai GbPUsD Settings Guide: Settings Guide
If you need more settings, be sure to let us know
How this expert works:
We transfer data from previous years (data from several reputable brokers), types of patterns (candlestick patterns, harmonic patterns, etc.), specific areas (support, resistance, rand price, etc.), personalized indicators (the most reliable and newest indicators) to AI. We gave it and this artificial intelligence has reached the level you see after 7 months of training in very strong and advanced systems.
Our training continues...
How to work with this expert:
Allow the expert to trade. ( Ai GbPUsD Guid )
Some important points:
Use this expert only in M15 , M30 , H1 , H4 and D1 time frames
You can use a variety of brokers, but try to use large and famous brokers
Default settings are great, so you do not need a separate settings file
If you have any questions or concerns, be sure to let me know
If you need any settings, be sure to let me know
We update this expert every 1 to 2 months to reach an almost complete version and solve its problems. All updates are free
Ai GBPUSD Frequently Asked Question: FAQ
Ai GBPUSD Settings Guide: Settings Guide
Ai EuRUsD: mql5.com/en/users/aahn/seller
Ai UsDCaD: mql5.com/en/users/aahn/seller

