• Información general
  • Comentarios
  • Discusión
  • Novedades

CCI Candles 2 AM

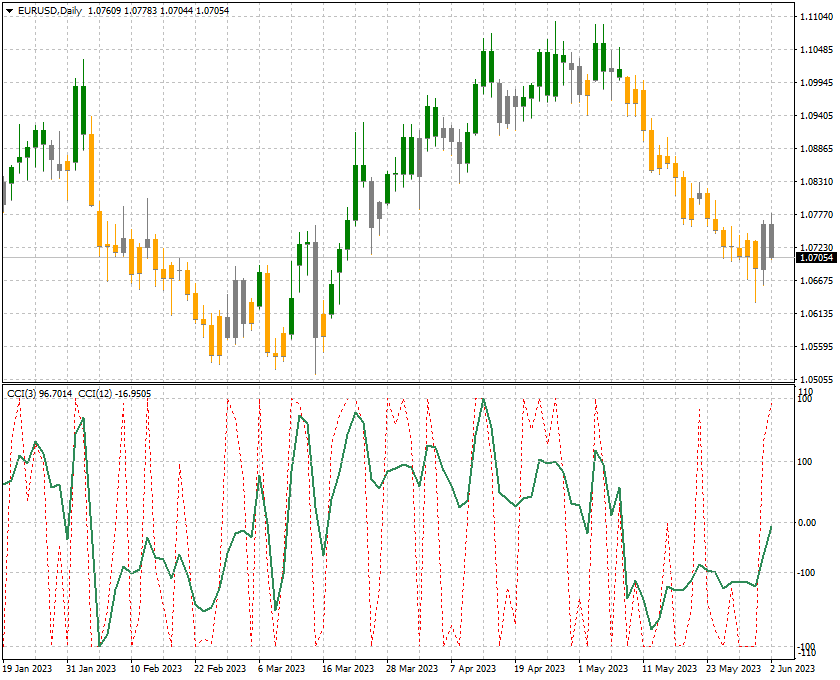
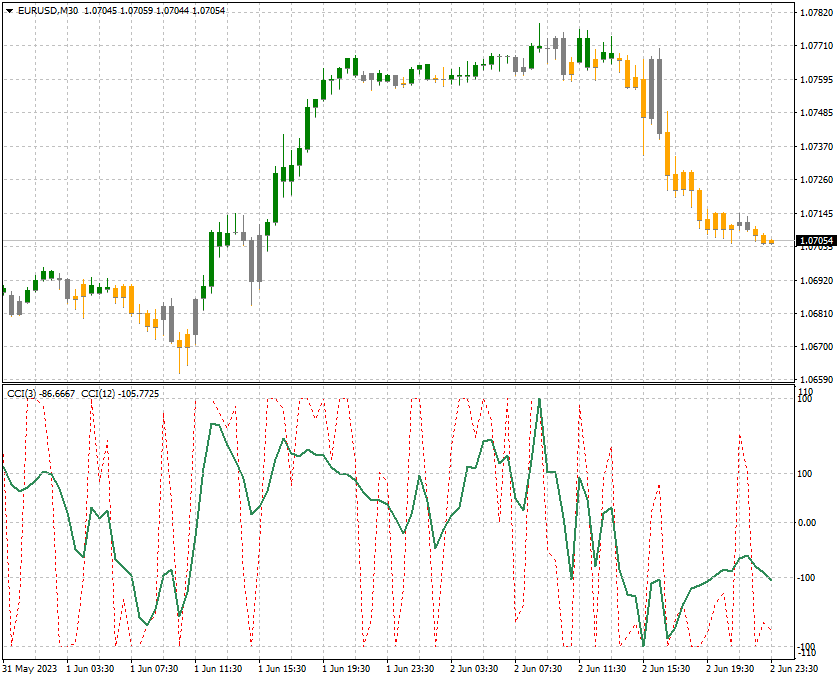
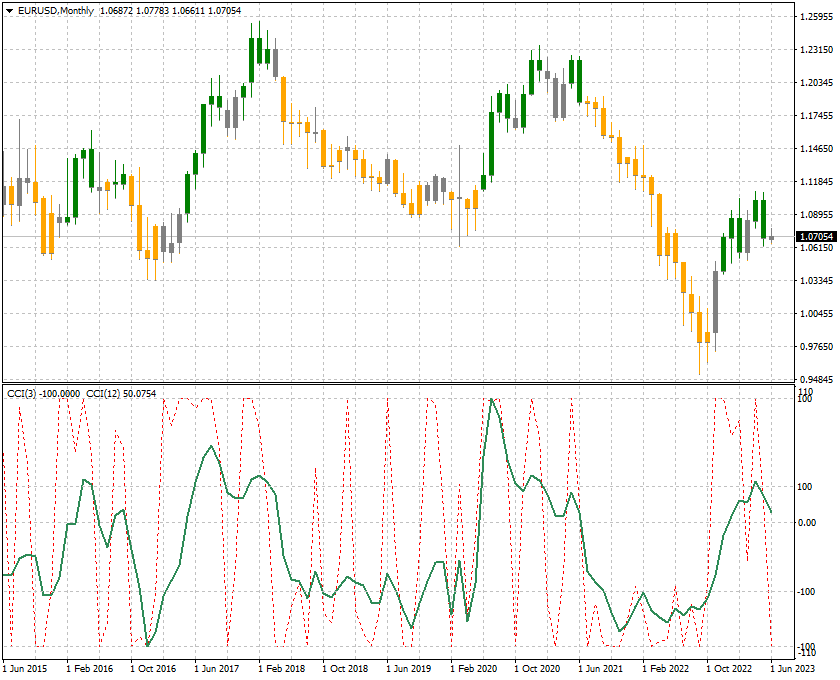
The indicator colors candlesticks of the price chart in accordance with the data of two CCI indicators from different timeframes.

If both CCI indicators are above 0, the indicator paints the candle in the color that signals about price growth, and vice versa.

The indicator allows to efficiently follow the trend, track short-term price rollbacks, and also to identify price reversals.

The indicator does not redraw.


Settings

  • CCI1_Period ( >1) - period of the fast CCI osc;
  • CCI1_Price - price of the fast CCI osc;
  • CCI2_Period (>CCI1_Period) - period of the slow CCI osc;
  • CCI2_Price - price of the slow CCI osc.


Productos recomendados
Impulsive Trade AM
Andriy Matviyevs'kyy
This indicator is designed for trading based on the trading strategy presented by Alexander Elder. The thick and thin color histograms of the indicator correspond to the values ​​of MACD and OsMA with the parameters set by the user. If the indicator histogram is greater than zero, then the MACD or OsMA value is greater than zero. If the indicator histogram is less than zero, then the MACD or OsMA value is less than zero. As an additional element, the indicator indicates the direction of the mo
Le presentamos el indicador "Candle closing counter", que se convertirá en su asistente indispensable en el mundo del trading. Es por eso que saber cuándo se cerrará la vela puede ayudar: Si usted tiene gusto de negociar usando patrones de la vela, usted sabrá cuando la vela será cerrada. Este indicador le permitirá comprobar si se ha formado un patrón conocido y si hay una posibilidad de negociación. El indicador le ayudará a prepararse para la apertura del mercado y el cierre del mercado. P
The Penta-O is a 6-point retracement harmonacci pattern which usually precedes big market movements. Penta-O patterns can expand and repaint quite a bit. To make things easier this indicator implements a twist: it waits for a donchian breakout in the right direction before signaling the trade. The end result is an otherwise repainting indicator with a very reliable trading signal. The donchian breakout period is entered as an input. [ Installation Guide | Update Guide | Troubleshooting | FAQ | A
Trend Ray
Andriy Sydoruk
The indicator shows the potential trend direction by cyclical-wave dependence. Thus, all the rays of the intersection will be optimal rays, in the direction of which the price is expected to move, taking into account the indicator period. Rays can be used as a direction for potential market movement. But we must not forget that the approach must be comprehensive, the indicator signals require additional information to enter the market.
TrendPlus
Sivakumar Subbaiya
4.07 (14)
Trend Plus   Trendplus  Indicator   Time Frame: Suitable for any time frame.  Purpose: Trend Prediction. Blue and red candle indicate the buy and sell call respectively. Buy: When the blue candle is formed buy call is initiated. close the buy trades when the next red candle will formed.   Sell: When the Red candle is formed Sell call is initiated. close the Sell trades when the next blue candle will formed.   Happy trade!!
FREE
El indicador de precisión divergente está diseñado para identificar discrepancias en el gráfico de precios de un par de divisas. El indicador de precisión divergente reconoce las divergencias alcistas y bajistas, y también puede emitir una señal de que se ha detectado una divergencia. Además de identificar las divergencias, el indicador funciona con niveles de sobrecompra y sobreventa, y también muestra flechas para ingresar al mercado.
El indicador "Auto FIBO Pro" de Crypto_Forex es una gran herramienta auxiliar para operar. - El indicador calcula y coloca automáticamente en el gráfico los niveles de Fibonacci y las líneas de tendencia locales (color rojo). - Los niveles de Fibonacci indican áreas clave donde el precio puede revertirse. - Los niveles más importantes son 23,6 %, 38,2 %, 50 % y 61,8 %. - Puede usarlo para scalping de reversión o para operar en cuadrículas de zonas. - También existen muchas oportunidades para m
Are you tired of drawing trendlines every time you're analyzing charts? Or perhaps you would like more consistency in your technical analysis. Then this is for you. This indicator will draw trend lines automatically when dropped on a chart. How it works Works similar to standard deviation channel found on mt4 and mt5. It has 2 parameters: 1. Starting Bar 2. Number of bars for calculation The   starting bar   is the bar which drawing of the trend lines will begin, while the   number of bars for c
FREE
"Adjustable Fractals" es una versión avanzada del indicador fractal, ¡una herramienta de trading muy útil! - Como sabemos, el indicador fractal estándar de mt4 no tiene ninguna configuración, lo que resulta muy incómodo para los traders. - Adjustable Fractals ha resuelto ese problema: tiene todas las configuraciones necesarias: - Período ajustable del indicador (valores recomendados: por encima de 7). - Distancia ajustable de los máximos y mínimos del precio. - Diseño ajustable de las flechas
Rainbow MT4
Jamal El Alama
Rainbow MT4 is a technical indicator based on Moving average with period 34 and very easy to use. When price crosses above MA and MA changes color to green, it’s a signal to buy. When price crosses below MA and MA changes color to red, it’s a signal to sell. The Expert advisor ( Rainbow EA MT4) based on Rainbow MT4 indicator, as you can see in the short video below is now available here .
FREE
Super Reversal Pattern
Parfait Mujinga Ndalika
Super Reversal Pattern Indicator Unlock the power of advanced pattern recognition with our Super Reversal Pattern Indicator. Designed for traders seeking precision and reliability, this indicator identifies one of the most effective reversal patterns in technical analysis, offering a significant edge in your trading strategy. Key Features: Non-Repainting Accuracy: Enjoy the confidence of non-repainting technology. Once a Super Reversal Pattern is detected, it remains static, providing consiste
Owl smart levels
Sergey Ermolov
4.28 (36)
Versión MT5  |   FAQ El   Indicador Owl Smart Levels   es un sistema comercial completo dentro de un indicador que incluye herramientas de análisis de mercado tan populares como   los fractales avanzados de Bill Williams , Valable ZigZag que construye   la estructura de onda correcta   del mercado y   los niveles de Fibonacci   que marcan los niveles exactos de entrada. en el mercado y lugares para tomar ganancias. Descripción detallada de la estrategia Instrucciones para trabajar con el indi
Trend arrow Indicator
NGUYEN NGHIEM DUY
3.3 (10)
Trend arrow Indicator is an arrow Indicator used as an assistant tool for your trading strategy. The indicator analyzes the standard deviation of bar close for a given period and generates a buy or sell signals if the deviation increases. It good to combo with Martingale EA to follow Trend and Sellect Buy Only/Sell Only for EA work Semi-Automatic. You can use this  Indicator with any EAs in my Products.
FREE
Indicador instantáneo de skalping. La flecha da una señal para comprar o vender junto con el valor del sótano del indicador. Se considera una señal fuerte cuando la flecha y el indicador del sótano que muestra cuatro períodos de tiempo coinciden en el pronóstico. Este indicador contiene muchos algoritmos y tareas que se han reducido a un resultado, que proporciona el indicador instantáneo Skalping, es decir, informa al comerciante sobre la dirección del mercado. Por lo tanto, da 1. Señal de
Heiken Ashi candle chart is an improved version of The Japanese candle chart, which can effectively filter the market "noise" of the Japanese candle chart. It is favored by many traders for its simplicity and intuition. For trend traders, the HA candle chart is a magic tool. Unlike the traditional Japanese candle chart, Heikenashi does not reflect the opening price, high price, low price and closing price of the market. Instead, Heikenashi calculates the value of a single K line in the dominant
Trend PA
Mikhail Nazarenko
5 (3)
The Trend PA indicator uses   Price Action   and its own filtering algorithm to determine the trend. This approach helps to accurately determine entry points and the current trend on any timeframe. The indicator uses its own algorithm for analyzing price changes and Price Action. Which gives you the advantage of recognizing, without delay, a new nascent trend with fewer false positives. Trend filtering conditions can be selected in the settings individually for your trading style. The indicator
Binary Options Support Resistance Indicator This indicator is designed for binary options trading and effectively shows retracements from support and resistance levels. Signals appear on the current candle. A red arrow pointing downwards indicates a potential selling opportunity, while a blue arrow pointing upwards suggests buying opportunities. All that needs adjustment is the color of the signal arrows. It is recommended to use it on the M1-M5 timeframes as signals are frequent on these timef
Trend Bilio - an arrow indicator without redrawing shows potential market entry points in the form of arrows of the corresponding color: upward red arrows suggest opening a buy, green down arrows - selling. The entrance is supposed to be at the next bar after the pointer. The arrow indicator Trend Bilio visually "unloads" the price chart and saves time for analysis: no signal - no deal, if an opposite signal appears, then the current deal should be closed. It is Trend Bilio that is considered
The indicator allows you to trade binary options. The recommended time frame is М1 and the expiration time is 1,2,3 minutes. The indicator suitable for auto and manual trading. A possible signal is specified as a arrows above/under a candle. You should wait until the candle closes! Arrows are not re-painted Trade sessions: TOKYO section (Half-end) Currency pairs: USD/JPY Working time frame: M1 Expiration time: 1,2,3 minutes. The indicator also shows good results when using the martingale strateg
FREE
Two Period RSI
Libertas LLC
5 (4)
Two Period RSI compares long-term and short-term RSI lines, and plots a fill between them for improved visualization. Fill is colored differently according to an uptrend (short period RSI above long period RSI) or a downtrend (short period RSI below long period RSI). Short-term RSI crossing long-term RSI adds a more robust trend confirmation signal than using single period RSI alone. This is a small tool to help visualize and confirm RSI trends. We hope you enjoy! Looking for RSI alerts? You can
FREE
Alpha Trend sign has been a very popular trading tool in our company for a long time. It can verify our trading system and clearly indicate trading signals, and the signals will not drift. Main functions: Based on the market display of active areas, indicators can be used to intuitively determine whether the current market trend belongs to a trend market or a volatile market. And enter the market according to the indicator arrows, with green arrows indicating buy and red arrows indicating se
Advanced Stochastic Scalper - is a professional indicator based on the popular Stochastic Oscillator. Advanced Stochastic Scalper is an oscillator with dynamic overbought and oversold levels, while in the standard Stochastic Oscillator, these levels are static and do not change. This allows Advanced Stochastic Scalper to adapt to the ever-changing market. When a buy or a sell signal appears, an arrow is drawn on the chart and an alert is triggered allowing you to open a position in a timely mann
Follow The Line
Oliver Gideon Amofa Appiah
4 (15)
FOLLOW THE LINE GET THE FULL VERSION HERE: https://www.mql5.com/en/market/product/36024 This indicator obeys the popular maxim that: "THE TREND IS YOUR FRIEND" It paints a GREEN line for BUY and also paints a RED line for SELL.  It gives alarms and alerts of all kinds. IT DOES NOT REPAINT and can be used for all currency pairs and timeframes. Yes, as easy and simple as that. Even a newbie can use it to make great and reliable trades. NB: For best results, get my other premium indicators for more
FREE
Wise Men Indicator demo
Bohdan Kasyanenko
3 (2)
The indicator displays signals according to the strategy of Bill Williams on the chart. Demo version of the indicator has the same features as the paid, except that it can work only on a demo account . Signal "First Wise Man" is formed when there is a divergent bar with angulation.  Bullish divergent bar - with lower minimum and closing price in the upper half. Bearish divergent bar - higher maximum and the closing price at the bottom half. Angulation is formed when all three lines of Alligator
FREE
Wave Trend MT4
Diego Arribas Lopez
Versión MT4   Wave Trend     MT5 Wave Trend es un oscilador que ayuda a identificar de manera extremadamente precisa las reversiones del mercado. El oscilador está por encima del nivel de sobrecompra y un cruce hacia abajo de la MA rápida a la lenta generalmente indica una buena señal de VENTA. Si los osciladores están por debajo del nivel de sobreventa y la media móvil rápida cruza la media móvil más lenta, por lo general indica una buena señal de COMPRA. El indicador Wave Trend también se pued
MegaTrends
Sivakumar Subbaiya
1 (1)
Megatrends  Indicator   Time Frame: Suitable for any time frame.  Purpose: Trend Prediction. Blue and red color indicate the buy and sell call respectively. Buy: When the blue line is originating it is opened buy call. Sell: When the Red line is origination it is opened sell call Happy trade!! this indicator is suitable for all time frame, but our recommended time frame to use 1hour and 4 hours, suitable for any chart.
FREE
Noize Absorption Index MT4
Ekaterina Saltykova
5 (1)
Noize Absorption Index - is the manual trading system that measures the difference of pressure between bears forces and bulls forces. Green line - is a noize free index that showing curent situation. Zero value of index shows totally choppy/flat market.Values above zero level shows how powerfull bullish wave is and values below zero measures bearish forces.Up arrow appears on bearish market when it's ready to reverse, dn arrow appears on weak bullish market, as a result of reverse expectation. S
Los indicadores [ZhiBiCCI] son ​​adecuados para todos los ciclos de uso y también son adecuados para todas las variedades de mercado. [ZhiBiCCI] La línea verde sólida es una reversión de la divergencia alcista. La línea de puntos verde es una divergencia alcista clásica. [ZhiBiCCI] La línea continua hacia el rojo es una divergencia bajista inversa. La línea roja punteada es una divergencia bajista clásica. [ZhiBiCCI] puede configurarse en los parámetros (Alerta, Enviar correo, Enviar notifica
Este es un indicador MTF de niveles de soporte y resistencia basado en los   extremos del indicador Advanced ZigZag Dynamic   y / o   Extended Fractals   con etiquetas de precio (se puede deshabilitar). Se pueden seleccionar TF más altos para el modo MTF. De forma predeterminada, los niveles se generan en función de los puntos indicadores de ZigZag. Los puntos indicadores de fractales también se pueden usar junto con ZigZag o en su lugar. Para simplificar el uso y ahorrar tiempo de CPU, el cálcu
Extremum Reverse Bar
Yurij Izyumov
2.8 (5)
This indicator has been created for finding the probable reversal points of the symbol price. A small candlestick reversal pattern is used it its operation in conjunction with a filter of extremums. The indicator is not redrawn! If the extremum filter is disabled, the indicator shows all points that have a pattern. If the extremum filter is enabled, the condition works – if the history Previous bars 1 candles back contains higher candles and they are farther than the Previous bars 2 candle, such
FREE
Los compradores de este producto también adquieren
Gann Made Easy
Oleg Rodin
4.79 (109)
Gann Made Easy es un sistema de comercio de Forex profesional y fácil de usar que se basa en los mejores principios de comercio utilizando la teoría del Sr. W. D. Gann. El indicador proporciona señales precisas de COMPRA y VENTA, incluidos los niveles de Stop Loss y Take Profit. Puede comerciar incluso sobre la marcha utilizando notificaciones PUSH. ¡Por favor, póngase en contacto conmigo después de la compra! ¡Compartiré mis consejos comerciales con usted y excelentes indicadores de bonificació
Dynamic Forex28 Navigator
Bernhard Schweigert
5 (4)
Dynamic Forex28 Navigator: la herramienta de trading de Forex de última generación. ACTUALMENTE CON UN 49 % DE DESCUENTO. Dynamic Forex28 Navigator es la evolución de nuestros indicadores populares de larga data, que combina el poder de tres en uno: Indicador avanzado Currency Strength28 (695 reseñas) + Indicador avanzado Currency IMPULSE con ALERT (520 reseñas) + Señales combinadas CS28 (bonificación). Detalles sobre el indicador https://www.mql5.com/en/blogs/post/758844 ¿Qué ofrece el indi
-   Real price is 80$   - 40% Discount ( It is 49$ now ) - Lifetime update free Contact me for instruction, add group and any questions! Related Products:  Bitcoin Expert , Gold Expert - Non-repaint - I just sell my products in Elif Kaya profile, any other websites are stolen old versions, So no any new updates or support. Introduction The breakout and retest strategy is traded support and resistance levels. it involves price breaking through a previous level.  The break and retest strategy is
Scalper Inside PRO
Alexey Minkov
4.75 (61)
!SPECIAL SALE!  An exclusive indicator that utilizes an innovative algorithm to swiftly and accurately determine the market trend. The indicator automatically calculates opening, closing, and profit levels, providing detailed trading statistics. With these features, you can choose the most appropriate trading instrument for the current market conditions. Additionally, you can easily integrate your own arrow indicators into Scalper Inside Pro to quickly evaluate their statistics and profitability
FX Levels MT4
Daniel Stein
5 (2)
FX Levels: Zonas de Soporte y Resistencia con Precisión Excepcional para Todos los Mercados Resumen Rápido ¿Busca una manera confiable de identificar niveles de soporte y resistencia en cualquier mercado — ya sean divisas, índices, acciones o materias primas? FX Levels combina el método tradicional “Lighthouse” con un enfoque dinámico vanguardista, ofreciendo una precisión casi universal. Gracias a nuestra experiencia real con brokers y a las actualizaciones automáticas diarias más las de tiem
FX Volume
Daniel Stein
4.59 (34)
FX Volume: Experimente el Verdadero Sentimiento del Mercado desde la Perspectiva de un Bróker Resumen Rápido ¿Desea llevar su estrategia de trading a otro nivel? FX Volume ofrece información en tiempo real sobre cómo los traders minoristas y los brókers están posicionados, mucho antes de que aparezcan informes retrasados como el COT. Ya sea que busque beneficios consistentes o simplemente quiera una ventaja más profunda en los mercados, FX Volume le ayuda a identificar desequilibrios important
IX Power MT4
Daniel Stein
4.67 (6)
IX Power: Descubre perspectivas de mercado para índices, materias primas, criptomonedas y forex Descripción general IX Power es una herramienta versátil diseñada para analizar la fortaleza de índices, materias primas, criptomonedas y símbolos de forex. Mientras que FX Power ofrece la máxima precisión para pares de divisas mediante el uso de datos de todos los pares disponibles, IX Power se centra exclusivamente en los datos del mercado del símbolo subyacente. Esto convierte a IX Power en una e
FX Power MT4 NG
Daniel Stein
4.94 (18)
FX Power: Analiza la Fuerza de las Divisas para Decisiones de Trading Más Inteligentes Descripción General FX Power es tu herramienta esencial para comprender la fuerza real de las principales divisas y el oro en cualquier condición de mercado. Al identificar divisas fuertes para comprar y débiles para vender, FX Power simplifica las decisiones de trading y descubre oportunidades de alta probabilidad. Ya sea que quieras seguir las tendencias o anticipar reversiones utilizando valores extremos
Advanced Supply Demand
Bernhard Schweigert
4.91 (294)
¡Actualmente con 33% de descuento! ¡La mejor solución para cualquier tráder principiante o experto! Este indicador es una herramienta comercial única, de alta calidad y asequible, porque incorpora una serie de características patentadas y una nueva fórmula. Con esta actualización, podrá mostrar zonas de doble marco temporal. No solo podrá mostrar un marco temporal más alto, sino también mostrar ambos, el marco temporal del gráfico MÁS el marco temporal más alto: MOSTRANDO ZONAS ANIDADAS. A todos
Scalper Vault
Oleg Rodin
5 (28)
Scalper Vault es un sistema profesional de reventa que le brinda todo lo que necesita para una reventa exitosa. Este indicador es un sistema comercial completo que puede ser utilizado por operadores de divisas y opciones binarias. El marco de tiempo recomendado es M5. El sistema le proporciona señales de flecha precisas en la dirección de la tendencia. También le proporciona señales superiores e inferiores y niveles de mercado de Gann. Los indicadores proporcionan todo tipo de alertas, incluidas
Pruebe "Chart Patterns All in One" en modo demo y obtenga un bono. Envíeme un mensaje después de probarlo en modo demo para recibir su bono. Deja un comentario después de la compra para recibir 8 indicadores de alta calidad como bono. El indicador Chart Patterns All-in-One ayuda a los traders a visualizar varios patrones de gráficos comúnmente utilizados en el análisis técnico. Este indicador apoya la identificación de posibles comportamientos del mercado, pero no garantiza rentabilidad. Se rec
Currency Strength Exotics
Bernhard Schweigert
4.87 (31)
¡ACTUALMENTE 20% DE DESCUENTO ! ¡La mejor solución para cualquier operador novato o experto! Este indicador está especializado en mostrar la fuerza de la divisa para cualquier símbolo como Pares Exóticos, Materias Primas, Índices o Futuros. Es el primero de su clase, cualquier símbolo se puede añadir a la 9 ª línea para mostrar la verdadera fuerza de la moneda de Oro, Plata, Petróleo, DAX, US30, MXN, TRY, CNH etc. Se trata de una herramienta de trading única, de alta calidad y asequible porqu
Easy Breakout
Mohamed Hassan
5 (9)
After your purchase, feel free to contact me for more details on how to receive a bonus indicator called VFI, which pairs perfectly with Easy Breakout for enhanced confluence!   Easy Breakout is a powerful price action trading system built on one of the most popular and widely trusted strategies among traders: the Breakout strategy ! This indicator delivers crystal-clear Buy and Sell signals based on breakouts from key support and resistance zones. Unlike typical breakout indicators, it levera
Gold Venamax MT4
Sergei Linskii
5 (1)
Gold Venamax : este es el mejor indicador técnico de acciones. El algoritmo del indicador analiza el movimiento del precio de un activo y refleja la volatilidad y las posibles zonas de entrada. Características del indicador: Este es un súper indicador con Magia y dos bloques de flechas de tendencia para un comercio cómodo y rentable. El botón rojo para cambiar de bloque se muestra en el gráfico. La magia se establece en la configuración del indicador, por lo que puede instalar el indicador en
Golden Trend Indicator
Noha Mohamed Fathy Younes Badr
4.9 (10)
Golden Trend indicator  is The best indicator for predicting trend movement this indicator never lags and never repaints and never back paints    and give  arrow buy and sell    before the candle appear  and it will help you and  will make your trading decisions clearer its work on all currencies and  gold and crypto and all time frame This unique  indicator uses very secret algorithms to catch the  trends, so you can trade using this indicator and see the trend clear on charts  manual guide and
Trend Screener
STE S.S.COMPANY
4.78 (93)
Indicador de tendencia, solución única e innovadora para el comercio y filtrado de tendencias con todas las funciones de tendencias importantes integradas en una sola herramienta. Es un indicador 100% sin repintar de marcos temporales y monedas múltiples que se puede usar en todos los símbolos/instrumentos: divisas, materias primas, criptomonedas, índices y acciones. OFERTA POR TIEMPO LIMITADO: El indicador de detección de soporte y resistencia está disponible por solo 50$ y de por vida. (Precio
Ante todo, vale la pena enfatizar que esta Herramienta de Trading es un Indicador No Repintado, No Redibujado y No Retrasado, lo que la hace ideal para el trading profesional. Curso en línea, manual del usuario y demostración. El Indicador de Conceptos de Acción del Precio Inteligente es una herramienta muy potente tanto para traders nuevos como experimentados. Combina más de 20 indicadores útiles en uno solo, combinando ideas avanzadas de trading como el Análisis del Trader del Círculo Interio
Gold Stuff
Vasiliy Strukov
4.86 (249)
Gold Stuff: un indicador de tendencia diseñado específicamente para el oro, también se puede usar en cualquier instrumento financiero. El indicador no se vuelve a dibujar ni se retrasa. El marco de tiempo recomendado es H1. Este indicador está escrito por EA Gold Stuff Advisor, puede encontrarlo en mi perfil.  Puede obtener una copia gratuita de nuestro indicador Strong Support y Trend Scanner, por favor envíe un mensaje privado. ¡a mí! IMPORTANTE! Póngase en contacto conmigo inmediatamente de
TPSpro RFI Levels
Roman Podpora
4.85 (27)
INSTRUCCIONES      RUSO  -  ING     Se recomienda utilizar con un indicador.   -    TPSpro   TENDENCIA PRO -   Versión MT5 Un elemento clave en el trading son las zonas o niveles desde los que se toman las decisiones de compra o venta de un instrumento de trading. A pesar de los intentos de los principales actores de ocultar su presencia en el mercado, inevitablemente dejan rastros. Nuestra tarea era aprender a identificar estos rastros e interpretarlos correctamente. Funciones principales: ¡Mo
Bull versus Bear
Mohamed Hassan
4.5 (18)
Send us a message after your purchase to receive more information on how to get your  BONUS  for FREE  that works in great combination with Bull vs Bear ! Bull versus Bear is an easy-to-use Forex indicator that gives traders clear and accurate signals based on clear trend retests . Forget about lagging indicators or staring at charts for hours because  Bull vs Bear provides real-time entries with no lag and no repaint, so you can trade with confidence. Bull vs Bear  helps you enter trades durin
Beast Super Signal
Dustin Vlok
4.73 (89)
¿Está buscando un potente indicador de compraventa de divisas que pueda ayudarlo a identificar oportunidades comerciales rentables con facilidad? No busque más allá de Beast Super Signal. Este indicador basado en tendencias fácil de usar monitorea continuamente las condiciones del mercado, buscando nuevas tendencias en desarrollo o saltando sobre las existentes. Beast Super Signal da una señal de compra o venta cuando todas las estrategias internas se alinean y están en 100% de confluencia entr
ACTUALMENTE 31% DE DESCUENTO Este indicador es una herramienta de transacción única, de alta calidad y asequible porque hemos incorporado una serie de características propias y una fórmula secreta. Con solo un gráfico, da Alertas para los 28 pares de divisas. ¡Imagina cómo mejorarás porque puedes identificar el punto de activación exacto de una nueva tendencia u oportunidad de crecimiento! Basado en nuevos algoritmos subyacentes , hace que sea aún más fácil identificar y confirmar operaciones po
Special offer : ALL TOOLS , just $35 each! New tools   will be   $30   for the   first week   or the   first 3 purchases !  Trading Tools Channel on MQL5 : Join my MQL5 channel to update the latest news from me ¡Descubre el poder del concepto de Inversion Fair Value Gap (IFVG) de ICT con el Inversion Fair Value Gaps Indicator ! Esta herramienta de última generación lleva los Fair Value Gaps (FVG) al siguiente nivel al identificar y mostrar zonas de FVG invertidas, que son áreas clave de soporte
PZ Harmonacci Patterns
PZ TRADING SLU
3.17 (6)
Este es posiblemente el indicador de reconocimiento automático de formación de precios más completo que puede encontrar para la plataforma MetaTrader. Detecta 19 patrones diferentes, toma las proyecciones de Fibonacci tan en serio como usted, muestra la zona de reversión potencial (PRZ) y encuentra niveles adecuados de stop-loss y take-profit. [ Guía de instalación | Guía de actualización | Solución de problemas | FAQ | Todos los productos ] Detecta 19 formaciones de precios armónicos diferen
Special offer : ALL TOOLS , just $35 each! New tools   will be   $30   for the   first week   or the   first 3 purchases !  Trading Tools Channel on MQL5 : Join my MQL5 channel to update the latest news from me Presentamos el revolucionario RSI Kernel Optimized with Scanner, una herramienta de vanguardia que redefine el análisis tradicional de RSI al integrar el poderoso algoritmo de Estimación de Densidad de Núcleo (KDE). Este avanzado indicador no solo proporciona información en tiempo real s
System Trend Pro
Aleksandr Makarov
5 (2)
System Trend Pro - This is the best trend trading indicator!!! You can get this indicator for free -  Quantum Entry PRO The indicator no repaint!!!   The indicator has   MTF   mode, which adds confidence to trading on the trend (   no repaint   ). How to trade? Everything is very simple, we wait for the first signal (big arrow), then wait for the second signal (small arrow) and enter the market in the direction of the arrow. (See screens 1 and 2.) Exit on the opposite signal or take 20-30 pips
Legacy of Gann
Pavel Zamoshnikov
4.83 (12)
The indicator very accurately determines the levels of the possible end of the trend and profit fixing. The method of determining levels is based on the ideas of W.D.Gann, using an algorithm developed by his follower Kirill Borovsky. Extremely high reliability of reaching levels (according to K. Borovsky  - 80-90%) Indispensable for any trading strategy – every trader needs to determine the exit point from the market! Precisely determines targets on any timeframes and any instruments (forex, met
Automated Trendlines
Georgios Kalomoiropoulos
5 (16)
Las líneas de tendencia son la herramienta más esencial del análisis técnico en el comercio de divisas. Desafortunadamente, la mayoría de los comerciantes no los dibujan correctamente. El indicador de líneas de tendencia automatizadas es una herramienta profesional para comerciantes serios que lo ayuda a visualizar el movimiento de tendencia de los mercados. Hay dos tipos de Trendlines Bullish Trendlines y Bearish Trendlines. En la tendencia alcista, la línea de tendencia de Forex se dibuja a
ACTUALMENTE 26% DE DESCUENTO ¡La mejor solución para cualquier operador novato o experto! Este indicador es una herramienta única, de alta calidad y asequible porque hemos incorporado una serie de características propias y una nueva fórmula. ¡Con sólo UN gráfico puede leer la Fuerza de la Divisa para 28 pares de Divisas! Imagínese cómo mejorará su operativa porque podrá señalar el punto exacto de activación de una nueva tendencia o de una oportunidad de scalping. Manual del usuario: haga cli
TPSproTREND PrO
Roman Podpora
4.71 (28)
TPSpro TREND PRO   es un indicador de tendencia que analiza automáticamente el mercado y proporciona información sobre la tendencia y cada uno de sus cambios, además de dar señales para ingresar operaciones sin volver a dibujar. El indicador utiliza cada vela, analizándolas por separado. refiriéndose a diferentes impulsos: impulso hacia arriba o hacia abajo. ¡Puntos de entrada exactos a transacciones de divisas, criptomonedas, metales, acciones e índices! Versión MT5                   DESCRIPCIÓ
Otros productos de este autor
TTF Candles AM
Andriy Matviyevs'kyy
This indicator displays the moment when the TTF oscillator crosses the zero value, and the moment when the TTF oscillator crosses its smoothed value. Crossing the zero value by the TTF oscillator is a buy/sell signal. If the TTF oscillator crosses its smoothed value, it is a signal of a trend change. The signal is given after the end of the formation of the candle. The signal is confirmed when the price crosses the high/low of the bar on which the signal was given. The indicator does not redraw.
TTF Osc AM
Andriy Matviyevs'kyy
This indicator displays the moment when the TTF oscillator crosses the zero value, and the moment when the TTF oscillator crosses its smoothed value. Crossing the zero value by the TTF oscillator is a buy/sell signal. If the TTF oscillator crosses its smoothed value, it is a signal of a trend change. The signal is given after the end of the formation of the candle. The signal is confirmed when the price crosses the high/low of the bar on which the signal was given. The indicator does not redraw.
Zone Trade AM
Andriy Matviyevs'kyy
The indicator is based on the elements of Bill Williams' trading system. Sell signals are formed when MACD and OsMA values are falling simultaneously (Bill Williams calls these indicators АО and АС in his book), while buy signals appear when both indicators are rising. Thick and thin colored histograms match MACD and OsMA values. If the histogram is greater than 0, the indicator value is rising. Otherwise, it is falling. Positions should be opened when the price exceeds the bar's high or low, at
ADX Trigger AM
Andriy Matviyevs'kyy
The indicator is an interpretation of the Average Directional Movement Index (ADX) allowing you to determine if there is a price trend. It was developed by Welles Wilder and described in his book "New concepts in technical trading systems". The indicator determines entry points and uses crossing of ADX +/- lines and growth or fall of the main ADX line. When the indicator crosses the zero line, the trend is changed. If the oscillator's value is 1 - the price grows, the trend remains; If the oscil
BarLineBreak AM
Andriy Matviyevs'kyy
The indicator detects the current trend using the following definition: A trend is a market situation when each subsequent peak is higher/lower than the previous one, as well as each subsequent bottom is higher/lower than the previous one. Exceeding all previous peaks/bottoms on the specified amount of bars by the current peak/bottom is considered to be a beginning of a new trend. The indicator paints bars according to an identified trend. The indicator does not repaint. Settings: Lines_Break
RSI Signal AM
Andriy Matviyevs'kyy
This indicator displays the signals based on the values of the classic RSI indicator on the price chart. The RSI can be used for determining the overbought or oversold areas on the chart. Reaching these levels means that the market can soon turn around, but it does not give signal, as in a strong trend the market can stay in the overbought or oversold state for quite a long time. As with most oscillators, the signals are generated when leaving these areas. This indicator allows to display three
WPR Signal AM
Andriy Matviyevs'kyy
This indicator displays the signals based on the values of the classic WPR indicator. The WPR indicator can be used for determining the overbought or oversold areas on the chart. Reaching these levels means that the market can soon turn around, but it does not give signal, as in a strong trend the market can stay in the overbought or oversold state for quite a long time. As with most oscillators, the signals are generated when leaving these areas. This indicator allows to display three types of
CCI Signal AM
Andriy Matviyevs'kyy
This indicator displays the signals based on the values of the classic CCI indicator on the price chart. The CCI can be used for determining the overbought or oversold areas on the chart. Reaching these levels means that the market can soon turn around, but it does not give signal, as in a strong trend the market can stay in the overbought or oversold state for quite a long time. As with most oscillators, the signals are generated when leaving these areas. This indicator allows to display three
DeM Signal AM
Andriy Matviyevs'kyy
This indicator displays the moment when the DeMarker oscillator crosses its smoothed value. If the DeMarker oscillator crosses its smoothed value, it is a signal of a trend change. The signal is given after the end of the formation of the candle. The signal is confirmed when the price crosses the high/low of the bar on which the signal was given. The indicator does not redraw. Custom Parameters: DeM_Period (>1) - DeMarker indicator period; MA_Period - period for smoothing DeMarker indicator val
ADX Signal AM
Andriy Matviyevs'kyy
The indicator is an interpretation of the Average Directional Movement Index (ADX) allowing you to determine if there is a price trend. It was developed by Welles Wilder and described in his book "New concepts in technical trading systems". The indicator shows signals on the price chart when +DI и -DI intersect and when an ADX value rises or falls relative to the +DI и -DI positional relationship. The indicator's buy signals work just like a support level, while the sell signals work like a res
Impulsive Trade AM
Andriy Matviyevs'kyy
This indicator is designed for trading based on the trading strategy presented by Alexander Elder. The thick and thin color histograms of the indicator correspond to the values ​​of MACD and OsMA with the parameters set by the user. If the indicator histogram is greater than zero, then the MACD or OsMA value is greater than zero. If the indicator histogram is less than zero, then the MACD or OsMA value is less than zero. As an additional element, the indicator indicates the direction of the mo
RSX Signal AM
Andriy Matviyevs'kyy
The indicator displays the signals of the RSX oscillator. The main type of signal is given when the oscillator exceeds the 0 value. If the "Sensitivity" parameter increases above zero, the main signal will also be given when overbought/oversold levels are overcome, defined as zero plus sensitivity and zero minus sensitivity. An additional signal is given when the direction of the oscillator line changes. It is optimal to use the indicator signals as signals to open a trade when the price overcom
Stop Bar AM
Andriy Matviyevs'kyy
The indicator accurately identifies a short-term trend both on trend and flat markets. The confirmation of the signal is the overcoming by the price of the high/low of the bar on which the signal was given. Signals are given on fully formed bars and are not redrawn. Calculations are based on the system of Moving Averages. The indicator is highly sensitive. Use it together with other technical analysis indicators. Settings: Sensitivity - amount of bars for the indicator calculation (1 or higher)
MFI Signal AM
Andriy Matviyevs'kyy
5 (1)
This indicator displays the signals based on the values of the classic Money Flow Index (MFI) indicator on the price chart. The volume is considered during the calculation of the MFI values. The MFI can be used for determining the overbought or oversold areas on the chart. Reaching these levels means that the market can soon turn around, but it does not give signal, as in a strong trend the market can stay in the overbought or oversold state for quite a long time. As with most oscillators, the
ADX Candles AM
Andriy Matviyevs'kyy
This indicator colors candles in accordance with the projected price movement. The analysis is based on the values of the classic ADX. If the DMI+ line is above the DMI- line - the candlestick is painted in color that signals a price growth; If the DMI+ line is below the DMI- line - the candlestick is painted in color that signals a price fall. The indicator does not redraw on completed candlesticks. The forming candlestick can change its color depending on the current data. Thus, it is recommen
SuperTrend AM
Andriy Matviyevs'kyy
SuperTrend AM is an indicator that allows you to open a position at the very beginning of a significant price movement. The second most important quality of the indicator is the ability to follow the trend as long as possible in order to obtain all potential profits while minimizing potential losses. This indicator does not repaint or not recalculate. A version of this indicator with advanced settings and signal notifications is  SuperTrend 3 AM . Signal of the indicator: red arrow appearing ab
HyperSignal AM
Andriy Matviyevs'kyy
The  indicator generates signals for opening positions. The principle of operation is to compare the current average price with a range of average prices over a longer period. The signals are confirmed when the price exceeds the High/Low of the bar where the indicator generated the signal.  Maintenance of an open position is carried out on a smaller TF. Indicator signals to open an opposite position on a smaller TF are a signal to close the deal. This indicator does not repaint or not recalculat
EasyTrend AM
Andriy Matviyevs'kyy
EasyTrend AM is an indicator that allows you to open a position at the very beginning of a significant price movement. The second most important quality of the indicator is the ability to follow the trend as long as possible in order to obtain all potential profits while minimizing potential losses. This indicator does not repaint or not recalculate. A version of this indicator with advanced settings and signal notifications is EasyTrend 3 AM . Signal of the indicator: red arrow appearing above
ZT Signal AM
Andriy Matviyevs'kyy
The indicator displays elements of the trading system, name trading in the zone, described by Bill Williams. Sell signals are formed when MACD and OsMA values are falling simultaneously (Bill Williams calls these indicators АО and АС in his book), while buy signals appear when both indicators are rising. The indicator has no configurable parameters. (Indicator variant in which MACD and OsMA parameters can be changed - ZT Signal 2 AM ). The indicator signals are confirmed when the price exceeds t
Fine Trade AM
Andriy Matviyevs'kyy
The presented indicator with high efficiency gives signals about the moments of a significant change in the direction of price movement. The indicator is intuitive and easy to use. The indicator signal is generated after the completion of the bar, where the indicator changes its position relative to zero. Never repaints signal. The indicator signals must be confirmed by the price exceeding the High/Low of the bar, where the indicator changed its position relative to zero. The indicator allows to
TTF Line AM
Andriy Matviyevs'kyy
The indicator analyzes TTF and ATR data to define the current trend and allow traders to gain maximum profit from strong price movements. The indicator is intuitively clear: line direction change - trend direction change. Change of the line color warns of a coming direction change. Customized parameters: Ind_Period (>1) - TTF calculation period; Sensitivity (>1) - ATR sensitivity. Alerts - show a dialog box containing user data; Send_Mail - sends an email using an address specified on the Emai
Step RSI AM
Andriy Matviyevs'kyy
The presented indicator is an original development based on the classic technical analysis indicator - RSI. To smooth out sharp fluctuations in the indicator values, a filter is used that cuts off weak changes and focuses the trader's attention on strong fluctuations in the values. The indicator does not repaint on formed bars. For greater efficiency of this indicator, it should be used together with indicators that identify the trend direction, as well as support/resistance levels. The indica
ADX Line AM
Andriy Matviyevs'kyy
The indicator analyzes ADX and ATR data to define the current trend and allow traders to gain maximum profit from strong price movements. The indicator is intuitively clear: line direction change - trend direction change. Change of the line color warns of a coming direction change. Customized parameters: Ind_Period (>1) - ADX calculation period; Sensitivity (>1) - ATR sensitivity. Alerts - show a dialog box containing user data; Send_Mail - sends an email using an address specified on the Email
ADX Candles 2 AM
Andriy Matviyevs'kyy
This indicator colors candles in accordance with the projected price movement. The analysis is based on the values of the classic ADX. If the DMI+ line is above the DMI- line and the main ADX line grows - the candlestick is painted in color that signals a price growth; If the DMI+ line is below the DMI- line and the main ADX line grows - the candlestick is painted in color that signals a price fall. The indicator does not redraw on completed candlesticks. The forming candlestick can change its c
Bulls or Bears AM
Andriy Matviyevs'kyy
5 (1)
The indicator improves the idea implemented in the standard Bulls and Bears indicator. This indicator displays the difference between the High and Low for the current period of time and the values ​​of the channel constructed at the maximum and minimum prices for a longer period. The growth of the indicator values ​​above zero indicates that the High for the current period is greater than the average of the maximum prices for the period chosen as the indicator parameter. This situation in most
Market Pulse AM
Andriy Matviyevs'kyy
5 (1)
The indicator analyzes the direction of the short- and long-term trend over the given periods taking into account market volatility. This approach allows combining high sensitivity of the indicator with a high probability of its signals. The indicator use principle is very simple: indicator histogram above 0 is a buy signal; indicator histogram below 0 is a sell signal; The indicator is not redrawn on completed bars. This indicator is designed for trading pending orders. Thus, the confirmation
HyperSignal 2 AM
Andriy Matviyevs'kyy
The  indicator generates signals for opening positions. The principle of operation is to compare the current closing price with a range of average prices over a longer period. The signals are confirmed when the price exceeds the High/Low of the bar where the indicator generated the signal.  Maintenance of an open position is carried out on a smaller TF. Indicator signals to open an opposite position on a smaller TF are a signal to close the deal. This indicator does not repaint or not recalculat
Laguerre BoB AM
Andriy Matviyevs'kyy
The indicator improves the idea implemented in the standard Bulls and Bears indicator. This indicator displays the difference between the High and Low for the current period of time and the values ​​of the channel constructed at the maximum and minimum prices, which are smoothed by Laguerre method. The growth of the indicator values ​​above zero indicates that the High for the current period is greater than the average of the High prices. This situation in most cases indicates an increase in the
DSS Bressert AM
Andriy Matviyevs'kyy
Double Smoothed Stochastics – DSS Bressert is an oscillator introduced by William Blau and Walter Bressert.  The calculation of DSS Bressert values is similar to the stochastic indicator. The confirmation of the indicator's signal is the overcoming by the price of the high/low of the bar on which the signal was given by the indicator. Settings: Price - the price at which the indicator is calculated; EMA_Period - smoothing period; Stoch_Period - oscillator period; OB_Level - overbought level; O
Line on Osc AM
Andriy Matviyevs'kyy
This indicator combines the best features of a trend indicator and an oscillator. Effective trend detection and short-term price fluctuations. Operating principle: The indicator analyzes price direction using one of many standard oscillators. If the oscillator indicates a change in the direction of price movement, the indicator signals this by placing a small arrow on the chart opposite the bar on which the oscillator gave the corresponding signal. At the same time, the main signal of the indic
Filtro:
No hay comentarios
Respuesta al comentario
Versión 26.0 2023.09.11
Updated to version 26+.
Versión 25.2 2023.08.27
Updated.
Versión 25.0 2023.08.13
Updated to version 25+.
Versión 3.50 2023.06.04
New version.
Versión 3.10 2023.05.07
Добавлен логотип.
Versión 3.0 2023.05.01
Удалена настройка количества отображаемых баров.
Versión 2.0 2023.04.23
Удалено отображение информации в окне данных.