PA Analyzer
- Indicadores
- Darko Licardo
- Versión: 1.0
- Activaciones: 5
With PA analyzer you will see a different perspective of price action , once you have unlocked the full potential of it, this tool will be essential part of your trading system.
PA Analyzer enables market price analysis and automatically marks support and resistance in all time frames.
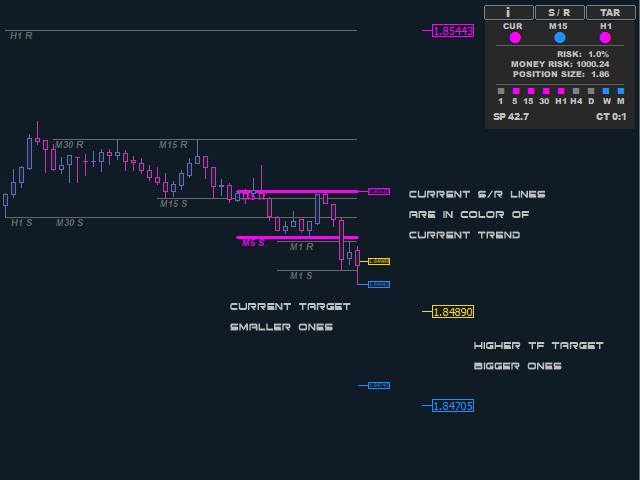
This indicator makes it easy to see whether the price is in range or trend, and generates dynamic profit take targets for the current time frame and the next higher time frame.
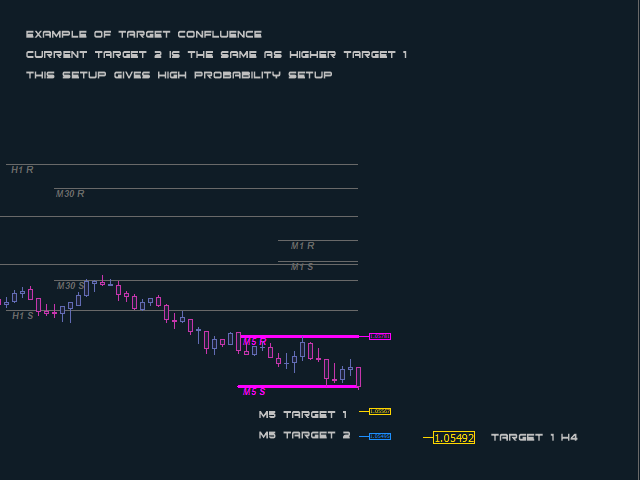
This allows you to find target confluence, giving you a clear picture of where the market is headed.
PA Analyzer boasts a special trend algorithm that displays trends on the current chart and higher time frames.
This ensures that you are always in line with the larger time frames, providing you with a comprehensive overview of market movements.
Indicator also calculates the size of your position based on the defined risk, taking into account the difference between resistance and support. And with just three buttons, you can turn on or off the info panel, support/resistance lines, or targets.
3 most important benefits:
- Automatic Support and Resistance Marking
- Effortless Price Range and Trend Analysis
- Dynamically Targeted Position Exiting
5 Additional Benefits:
-
Stay in Line with Larger Time Frames Our indicator allows you to follow the trend on the current chart and higher time frames. This ensures that you always stay in line with the larger time frames, giving you a clear advantage in the market.
-
Efficient Position Sizing Our indicator calculates the size of your position based on the defined risk, taking into account the difference between resistance and support. This allows for more efficient and effective position sizing, minimizing your risk and maximizing your profits.
-
User-Friendly Interface Our indicator has a user-friendly interface that is easy to navigate, making it accessible to traders of all skill levels.
-
additional information like current spread and candle timer
-
Customizable Settings Our indicator has customizable settings, allowing you to personalize it to your trading style and preferences.
In summary, this market price analysis indicator is a advanced tool for any trader looking to enhance their trading experience.
HOW TO USE IT:
-
Trend confirmation: To enter a market position, traders should look for at least 2 consecutive trends in the same direction, with 3 being even better. This helps confirm the direction of the market.
-
Time frame selection: Traders should select a timeframes difference 3-5 times larger than the one currently being used. Good time frame choices include 1-5-15; 5-15-H1; 15-H1-H4; H1-H4-D1; H4-D1-W1.
-
Target and entry selection: Traders should define a target on the higher time frame and enter the market on the lower time frame when trends are aligned. If possible, traders should try to have confluence on targets so that the target on the lower time frame is the same as the higher time frame target.
-
Partial profit taking: Traders should consider closing partial profit when target1 (usually in gold color) is reached, as it has a high probability of being hit. This can help lock in profits and reduce risk.
-
Retracement and target2: After target1 is reached, the price usually retraces back to the breakout point before continuing to target2. When target2 is reached, price usually stalls and makes a new range with new targets.
-
Target3: Traders should consider target3 only in news events or when the price is in a very narrow range for a prolonged time of 15 bars or more and there is a momentum bar formation with high volatility. This can help traders understand when it may be appropriate to consider target3.
-
Dynamic Target can be also in line to trendlines, pivots, S/R lines or MA-s. The more confluence the higher probability
INFO PANNEL:
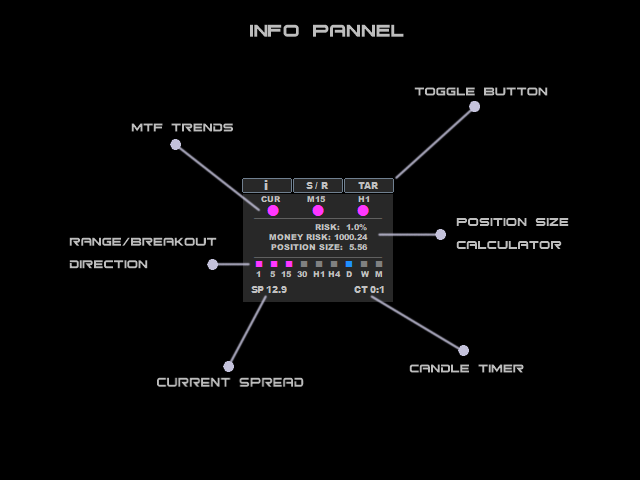
at the top there are 3 buttons to control what is displayed on chart.
Bellow buttons are dots representing trends for 3 TF (current + 2 higher TF) trend period is by default 63 more conservative it can be lowered up to 20 ,bellow this it not advisable.
Bellow trends there is a position calculator, by default is set to 1% and it use balance to calculate position size. Position size is calculate by differences between resistance and support lines considered that stop loss should be placed at least near those lines
Next you can see the squares that represent the position of the price in relation to the S/R lines. If the price is between the S/R lines then the square is gray and that means the price is in the range.
If it is above the resistance line then it is blue and that means the breakout is up, and if it is below the bottom line, then it is red, it means that the price is in the breakout down.
This allows us to easily observe price action in all time frames
By following these steps, traders can use this custom trading indicator more effectively to make informed trading decisions.
IMPORTANT:
S/R lines are calculated based on fractals and will not move until a new S/R is determined, the same applies to targets, when a new range is created, new targets are calculated. You can often see that the price on the current chart makes several corrections (new ranges), in order to come in line with the targets from a longer time frame.
If you download free demo and test it on visual tester you will not be able to see full potential of the indicator since it use multi time frame analysis. We have noted that on back-testing MTF values are not displayed correctly (not updated) due to limitation of the visual tester!












great product great customer service