DrawTurningPoint MT5
- Indicadores
- Kazuya Yamaoka
- Versión: 1.1
- Actualizado: 25 junio 2023
- Activaciones: 5
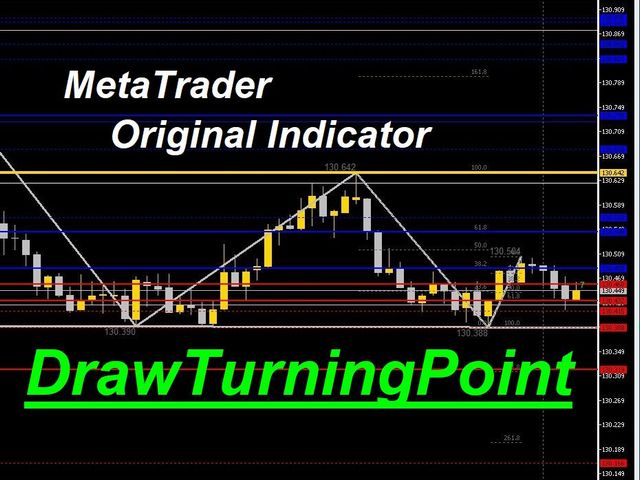
Based on the Dow Theory, the system automatically draws a turning point, which is the starting point for buying or selling.
It also automatically tells you whether the market is in a buying or selling condition and recognizes the environment.
It is also a good tool to prevent false trades and to make profitable trades.
We are live-streaming the actual operation of the system.
Please check for yourself if it is usable.
Please check it out for yourself.
https://www.youtube.com/@ganesha_forex
We do not guarantee your investment results. Investments should be made at your own risk.
We sharll not be liable for any disadvantage or damage caused by the use of the information provided.