Trending Volatility System MT5
- Indicadores
- Vitalyi Belyh
- Versión: 1.20
- Activaciones: 10
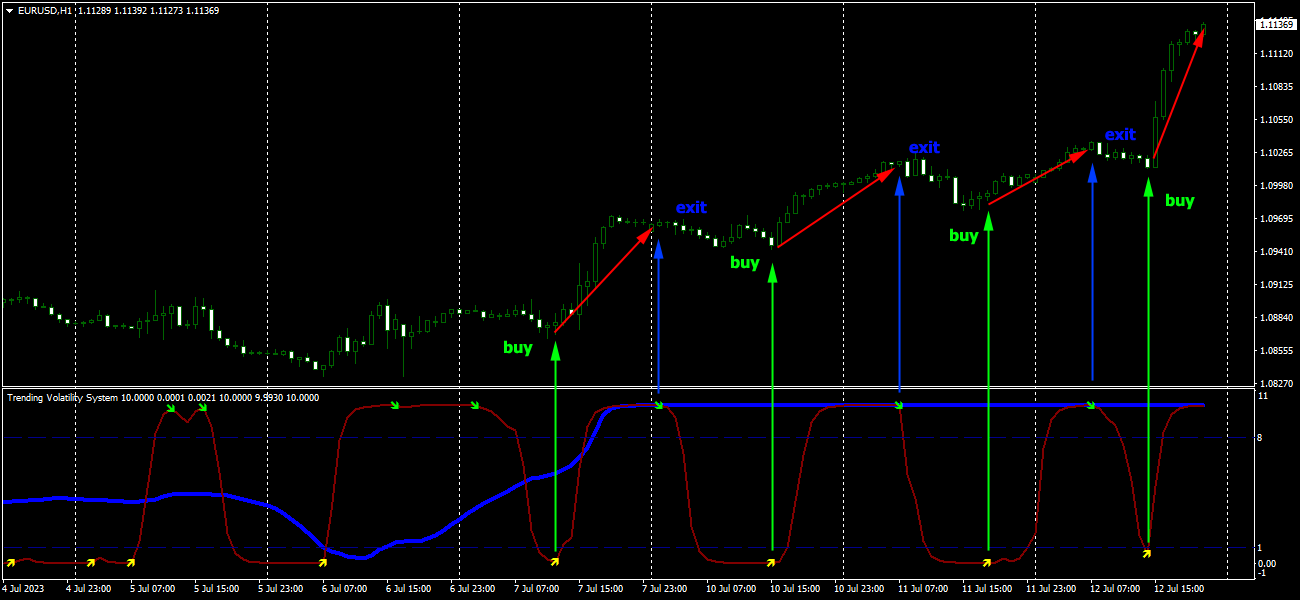
Volatility Trend System - un sistema de comercio que da señales para las entradas. El sistema de volatilidad da señales lineales y puntuales en la dirección de la tendencia, así como señales para salir de ella, sin redibujar ni demoras. El indicador de tendencia monitorea la dirección de la tendencia a mediano plazo, muestra la dirección y su cambio. El indicador de señal se basa en cambios en la volatilidad y muestra entradas en el mercado.
El indicador está equipado con varios tipos de alertas. Se puede aplicar a varios instrumentos comerciales y marcos de tiempo. Los marcos de tiempo recomendados para usar son M15, M30 y H1. Para buscar una señal más esperada en la dirección correcta, use el indicador en 2 marcos de tiempo. Si tiene alguna pregunta sobre el uso del indicador, escriba en mensajes privados. En el indicador, todos los parámetros ya están configurados para su uso, excepto la línea de tendencia.
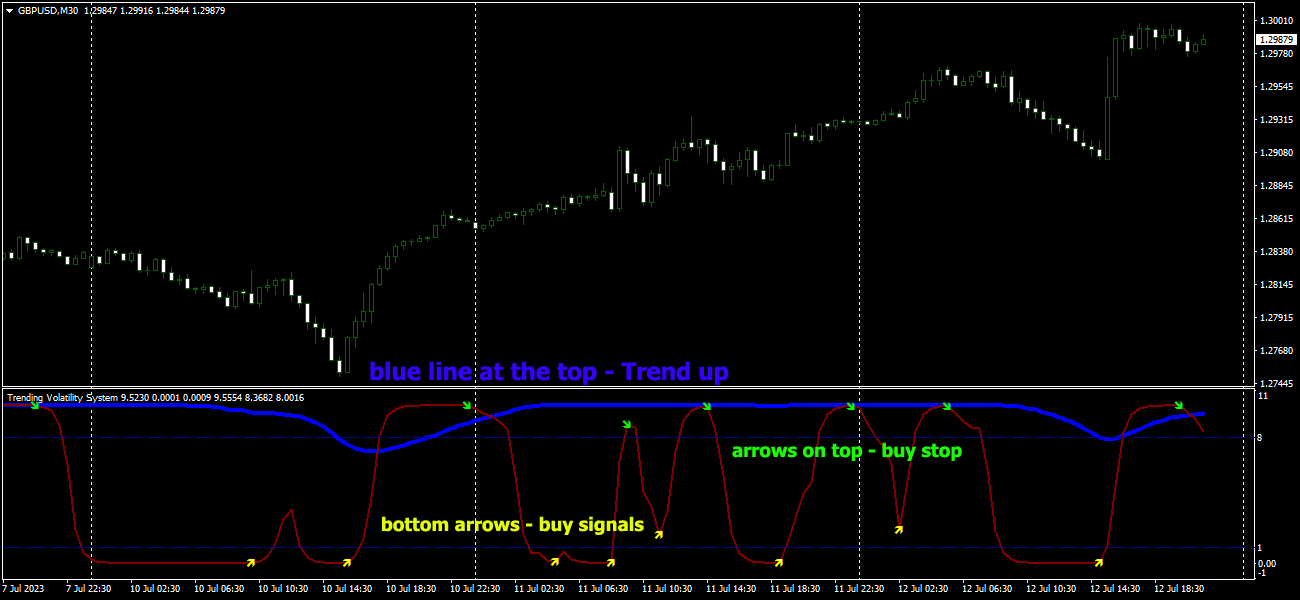
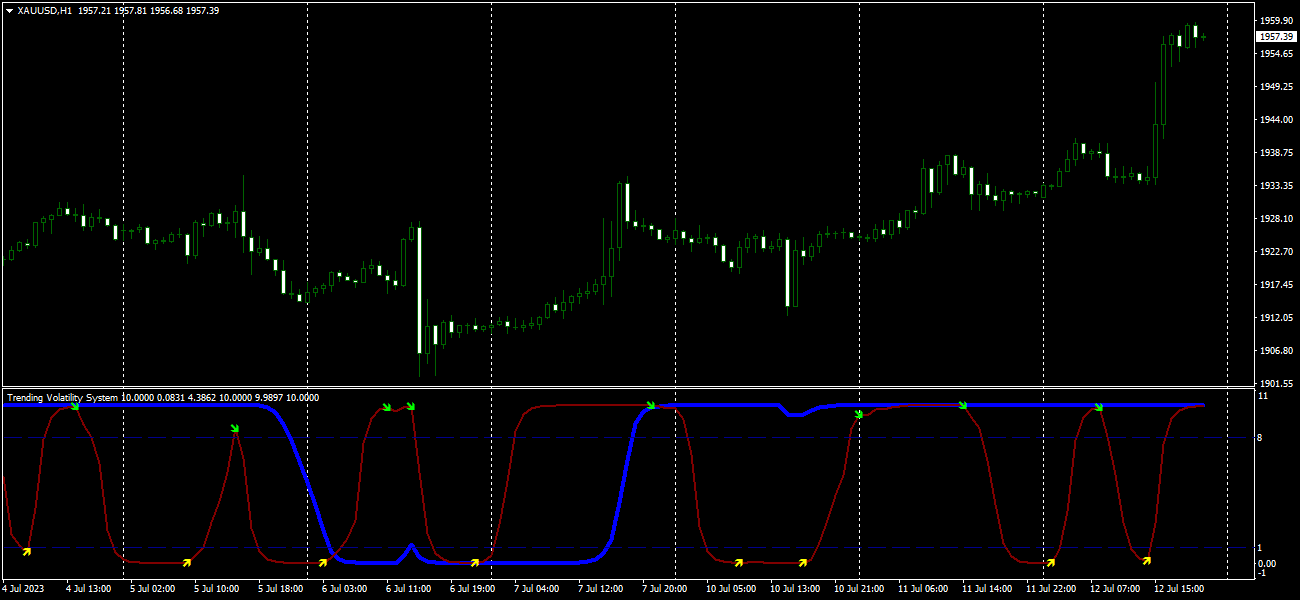
Comprar: la línea de tendencia está por encima del nivel 8 o por debajo, pero apunta hacia arriba. La línea de señal roja cruza el nivel 1 o el punto fractal Inferior.
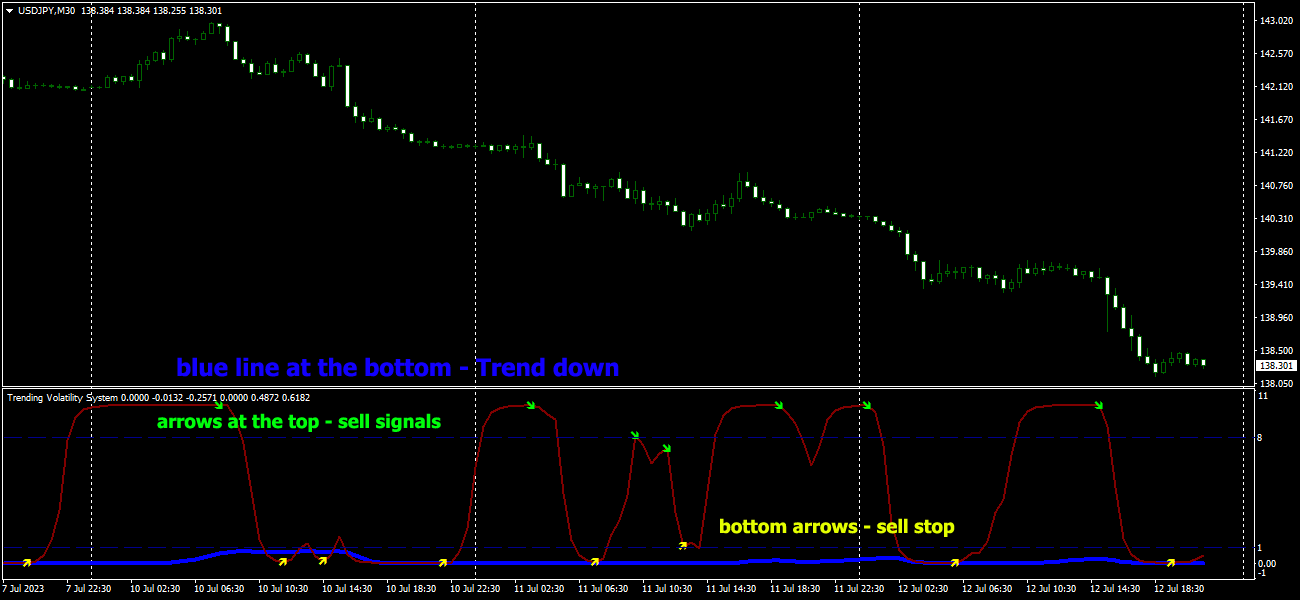
Vender: la línea de tendencia está por debajo del nivel 1 o por encima, pero apunta hacia abajo. La línea de señal roja cruza el nivel 8 o el punto fractal superior.
Si la situación es controvertida, cambie al marco de tiempo más alto y siga estas señales.
Parámetros de entrada
- Trend Period : el período de la línea de tendencia azul
- Line Period : Período de línea de señal roja
- Play sound / Display pop-up message / Send push notification / Send email (true/false) : use alertas cuando aparezcan flechas de señal.
- Sound file signal : archivo de sonido para señales