• Información general
  • Comentarios (3)
  • Discusión (3)
  • Novedades

Real Spinning Top Candlestick

5
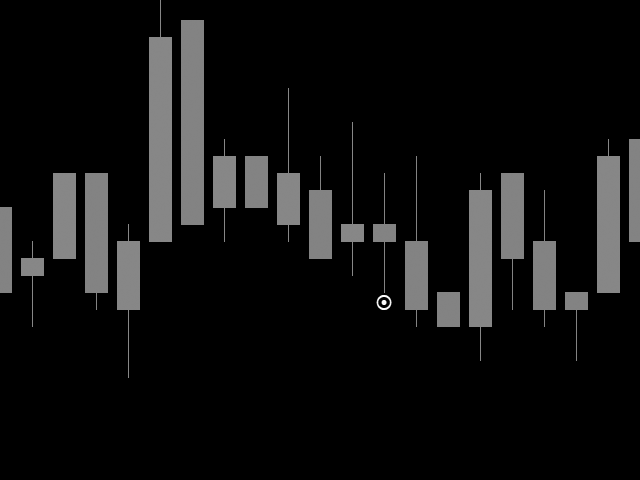
Indicador de peonza real

Detecta un trompo preciso en el gráfico con cuerpo equilibrado y relación de altura de mecha, que es el verdadero significado de trompo que lo diferencia de Hammers and Doji o Null Candlestick.

Este indicador traza un icono de ala en el número de peonzas que se encuentran en el gráfico.

La configuración incluye

Número de barras: para ajustar la búsqueda en el número de barras

Color del icono: cambiar el color del icono

Código de icono: cambie el código de wingdings por icono
Comentarios 3
Mao Le
21
Mao Le 2024.05.29 07:59 
 

It is really strong indicator. It's help me a lot in trading. Thank you for your hard working.

Passakon Ekaburudkul
274
Passakon Ekaburudkul 2024.01.08 11:44 
 

I really like it when use in H1 or over.

Peter Pedro
68
Peter Pedro 2023.04.08 14:50 
 

super

Productos recomendados
True Volatility
Cristian Eriksson
5 (1)
ATR is an excellent indicator to visualize if volatility is increasing or decreasing. But what if you want to compare the volatility to another pair or instrument? Since each pair with different quote currency has different pip value, the output of the ATR doesn't really say that much. Comparing pairs to other instruments is even harder.  What you as a trader care about is how much the pair has moved up or down in percentage, therefore normalizing ATR to percent would make things much easier.  T
FREE
Value Chart Candlesticks
Flavio Javier Jarabeck
4.67 (9)
The idea of a Value Chart indicator was presented in the very good book I read back in 2020 , " Dynamic Trading Indicators: Winning with Value Charts and Price Action Profile ", from the authors Mark Helweg and David Stendahl. The idea is simple and the result is pure genius: Present candlestick Price analysis in a detrended way! HOW TO READ THIS INDICATOR Look for Overbought and Oversold levels. Of course, you will need to test the settings a lot to find the "correct" one for your approach.
FREE
SSACD - Singular Spectrum Average Convergence/Divergence This is an analogue of the MACD indicator based on the Caterpillar-SSA ( Singular Spectrum Analysis ) method. Limited version of the SSACD Forecast indicator. Limitations include the set of parameters and their range. Specificity of the method The Caterpillar-SSA is an effective method to handle non-stationary time series with unknown internal structure. The method allows to find the previously unknown periodicities of the series and mak
FREE
A professional tool for trading - the divergence indicator between the  Stochastic and the price, which allows you to receive a signal about a trend reversal in a timely manner or catch price pullback movements (depending on the settings). The indicator settings allow you to adjust the strength of the divergence due to the angle of the  Stochastic peaks and the percentage change in price, which makes it possible to fine-tune the signal strength. The indicator code is optimized and is tested ver
FREE
Zona de Consolidacao
Edilson Domingos
5 (1)
It makes it easier to see where there have been consolidation zones for previous prices and allows you to highlight the histogram where there is the biggest consolidation zone. Input parameters Intervalo de preço Is the price between the histograms Periodo Number of candle sticks to be analyzed Porcentagem Highlights the histogram where there is minimal consolidation in relation to the analyzed period
FREE
Multi-timeframe trend indicator, based on the ADX / ADXWilder indicator The indicator shows trend areas using ADX or ADXWilder indicator data from multiple timeframes. The impulse mode of the indicator allows you to catch the beginning of a trend, and several "Screens" with different timeframes allow you to filter out market noise. How the indicator works: if PDI is greater than NDI, then it`s bullish movement; if PDI is less than NDI, then it`s bearish movement; to determine any trend, it
FREE
FRB Support and Resistance
Fernando Baratieri
5 (2)
FRB Trader - Our mission is to provide the best support to customers through conted and tools so that they can achieve the expected results FRB Support and Resistance - Indicator places lines on the chart to show Support and Resistance regions. - You can choose the timeframe you want to calculate, as well as the colors of the lines. - Algorithm calculates the points where the strengths of the asset are considered and are extremely important for decision making.
FREE
VWAP Indicator
LUC JACOBUS A VERHEECKE
4.23 (22)
Volume Weighted Average Price (VWAP) The volume weighted average price (VWAP) is a  trading   benchmark  used by traders that gives the average price a security has traded at throughout the day, based on both volume and price. It is important because it provides traders with insight into both the trend and value of a security. This indicator VWAP V2 is free and is the manual version of the extended Easy VWAP indicator (30 Euro), where the date and time properties are automatically entered. With
FREE
Weis Waves
Flavio Javier Jarabeck
3.15 (26)
The original author is David Weis, an expert in the Wyckoff Method. The Weis Wave is a modern adaptation of the 1930's Wyckoff Method, another expert in Tape Reading techniques and Chart Analysis. Weis Waves takes market volume and stacks it into waves according to price conditions giving the trader valuable insights about the market conditions. If you want to learn more about this subject you can find tons of videos in YouTube. Just look for "The Wickoff Method", "Weis Wave" and "Volume Spread
FREE
White Weis Volume Ticks
Ricardo Almeida Branco
5 (3)
White Weis Volume This indicator shows the sum of the volume in each wave, bulish or bearish, as idealized by David Weis , but it brings an important addition , which is the marking of the bar with the highest volume of the wave (White Bar)! In coding the indicator, it was sought to optimize the code to require minimal processing during use and not to overload mt5. The indicator can be used for pre-trading analysis and study, where the trader analyzes possible points of support and resi
Follow The Line MT5
Oliver Gideon Amofa Appiah
4.42 (31)
This indicator obeys the popular maxim that: "THE TREND IS YOUR FRIEND" It paints a GREEN line for BUY and also paints a RED line for SELL. (you can change the colors). It gives alarms and alerts of all kinds. IT DOES NOT REPAINT and can be used for all currency pairs and timeframes. Yes, as easy and simple as that. Even a newbie can use it to make great and reliable trades. NB: For best results, get my other premium indicators for more powerful and reliable signals. Get them here: https://www.m
FREE
Este innovador indicador de medición de la fuerza de la moneda de INFINITY es un ayudante indispensable para los revendedores y comerciantes que negocian en el largo plazo. El sistema de Análisis de fortaleza / debilidad de las monedas ha sido conocido y utilizado en el mercado por los principales operadores del mundo. Cualquier comercio de arbitraje no está completo sin este análisis. Nuestro indicador determina fácilmente la fuerza de las monedas subyacentes entre sí. Muestra gráficos de líne
FREE
Supports And Resistances Lines
Francisco Gomes Da Silva
4.76 (41)
Indicador de zonas de soporte y resistencia MT5 este indicador sabe cómo identificar techos y suelos automáticamente. Este indicador de soporte y resistencia crea líneas de soporte y líneas de resistencia basadas en máximos y mínimos. cómo hacer líneas de soporte y resistencia. este es un indicador para hacer líneas automáticas de soporte y resistencia. cómo encontrar el nivel de soporte con indicador. este indicador encuentra máximos y mínimos automáticamente. El indicador crea automáticamente
FREE
A professional tool for trading - the divergence indicator between the  MACD and the price, which allows you to receive a signal about a trend reversal in a timely manner or catch price pullback movements (depending on the settings). The indicator settings allow you to adjust the strength of the divergence due to the angle of the  MACD peaks and the percentage change in price, which makes it possible to fine-tune the signal strength. The indicator code is optimized and is tested very quickly as
FREE
Donchian Clouds
Samuel Manoel De Souza
The Indicator indicator draws 2 clouds based on Donchian Channels indicator values. The upper cloud is formed by the upper lines values and the lower cloud by the lowers lines values. The indicator allows to change the Channels parameters and the clouds colors the period of the base line and the multiplier of each Donchian Channels instance. The indicator holds 5 buffer index as follow: [0] - Outer values of the upper cloud [1]  - Inner values of the upper cloud [2]  - Base/Center line values [3
FREE
Bollinger Bands B
Flavio Javier Jarabeck
5 (3)
John Bollinger created this indicator in 2010 as a way to read the original indicator (Bollinger Bands) in a more "technical" way, shown as an oscillator. The typical range of the Bollinger Bands %B is 0 - 0.5 - 1.0, where "0" represents the lower band, the "0.5" the middle band, and "1" the upper band. The line on the indicator represents the Closing prices. As simple as that. SETTINGS Bollinger Bands period of analysis Standard Deviation multiplier Shift Price type to be analyzed If you
FREE
Spike Catch Pro
Amani Fungo
4 (5)
Spike Catch Pro 22:03 release updates Advanced engine for searching trade entries in all Boom and Crash pairs (300,500 and 1000) Programmed strategies improvements Mx_Spikes (to combine Mxd,Mxc and Mxe), Tx_Spikes,   RegularSpikes,   Litho_System,   Dx_System,   Md_System,   MaCross,   Omx_Entry(OP),  Atx1_Spikes(OP),   Oxc_Retracement (AT),M_PullBack(AT) we have added an arrow on strategy identification, this will help also in the visual manual backtesting of the included strategies and see h
FREE
Free automatic Fibonacci is an indicator that automatically plots a Fibonacci retracement based on the number of bars you select on the BarsToScan setting in the indicator. The Fibonacci is automatically updated in real time as new highest and lowest values appears amongst the selected bars. You can select which level values to be displayed in the indicator settings. You can also select the color of the levels thus enabling the trader to be able to attach the indicator several times with differe
FREE
Bar Color Trend
Germano Chagas
4.5 (10)
Combining the best of Price Action , Directional Movement , and Divergence/Convergence analysis, Candle Color Trend is a easy and reliable way to identify trend direction. The indicator automatically paints the candles according to the assumption that an uptrend is defined by prices that form a series of higher highs and higher lows. In contrast, a downtrend is defined by prices that form a series of lower highs and lower lows. Additionally, ADX Wilder indicator is used to measure trend weakness
FREE
This is  RSI with alarm and push notification  -is a indicator based on the popular Relative Strength Index (RSI) indicator with Moving Average and you can use it in Forex, Crypto, Traditional, Indices, Commodities. You can change colors to see how it fits you. Back test it, and find what works best for you. This product is an oscillator with dynamic overbought and oversold levels, while in the standard RSI, these levels are static and do not change. This allows  RSI with alarm and push notific
FREE
Are you tired of drawing trendlines every time you're analyzing charts? Or perhaps you would like more consistency in your technical analysis. Then this is for you. This indicator will draw trend lines automatically when dropped on a chart. How it works Works similar to standard deviation channel found on mt4 and mt5. It has 2 parameters: 1. Starting Bar 2. Number of bars for calculation The   starting bar   is the bar which drawing of the trend lines will begin, while the   number of bars for c
FREE
VWAP and MVWAP
Flavio Javier Jarabeck
4.17 (6)
Volume Weighted Average Price (VWAP) is a trading benchmark commonly used by Big Players that gives the average price a Symbol has traded throughout the day. It is based on both Volume and price. Additionally we put in this indicator the MVWAP (Moving Volume Weighted Average Price). For those who do not know the usage and the importance od this indicator I recommend a great article about this subject at Investopedia ( https://www.investopedia.com/articles/trading/11/trading-with-vwap-mvwap.asp )
FREE
Mitimom
Danil Poletavkin
The indicator is based on Robert Miner's methodology described in his book "High probability trading strategies" and displays signals along with momentum of 2 timeframes. A Stochastic oscillator is used as a momentum indicator. The settings speak for themselves period_1 is the current timeframe, 'current' period_2 is indicated - the senior timeframe is 4 or 5 times larger than the current one. For example, if the current one is 5 minutes, then the older one will be 20 minutes The rest of the
FREE
Money Flow Index EA Friendly
Flavio Javier Jarabeck
4.25 (4)
The traditional Money Flow Index indicator, this time, EA friendly . There are 3 buffers exposed that can be used by EAs to automatically analyze the Overbought and Oversold conditions of the quote. Just use the traditional iCustom() function to get these signals. This Money Flow Index calculation is based on the traditional Metaquote's MFI indicator. SETTINGS MFI Period Volume type to analyze (Real Volume or Ticks) Starting Overbought region Starting Oversold region USING WITH EAs Buffer
FREE
Donchian Pro
Paulo Henrique Faquineli Garcia
5 (2)
The Donchian Channel Channels are among the most popular tools of technical analysis, as they visually convey to the analyst the limits within which most price movement tends to occur. Channel users know that valuable information can be obtained at any time, whether prices are in the central region of a band or close to one of the border lines. One of the best known techniques to explore these concepts is Bollinger Bands. However, John Bollinger was not the only one to research the applicatio
FREE
Cybertrade Keltner Channels
Emanuel Andriato
4.67 (3)
Cybertrade Keltner Channels - MT5 Created by Chester Keltner, this is a volatility indicator used by technical analysis. It is possible to follow the trend of financial asset prices and generate support and resistance patterns. In addition, envelopes are a way of tracking volatility in order to identify opportunities to buy and sell these assets. It works on periods longer than the period visible on the chart. All values ​​are available in the form of buffers to simplify possible automations.
FREE
El estrategia de trading Moving Average Convergence Divergence (MACD) es una herramienta popular de análisis técnico que se utiliza para identificar cambios en el impulso y la dirección de la tendencia. El MACD se calcula restando la media móvil exponencial (EMA) de 26 períodos de la EMA de 12 períodos. Luego se traza una EMA de 9 períodos, llamada "línea de señal", sobre el MACD para actuar como un disparador de señales de compra y venta. El MACD se considera en territorio alcista cuando la lín
FREE
Multi-timeframe trend indicator based on the ADX / ADXWilder indicator with Fibonacci levels The indicator shows trend areas using ADX or ADXWilder indicator data from multiple timeframes. The impulse mode of the indicator allows you to catch the beginning of a trend, and several "Screens" with different timeframes allow you to filter out market noise. Fibonacci levels are added to the price chart, which have flexible settings. How the indicator works: if PDI is greater than NDI, then   it`
FREE
An analogue of the Stochastic oscillator based on algorithms of singular spectrum analysis (SSA) SSA is an effective method to handle non-stationary time series with unknown internal structure. It is used for determining the main components (trend, seasonal and wave fluctuations), smoothing and noise reduction. The method allows finding previously unknown series periods and make forecasts on the basis of the detected periodic patterns. Indicator signals are identical to signals of the original i
FREE
This indicator sums up the difference between the sells aggression and the buys aggression that occurred in each Candle, graphically plotting the waves of accumulation of the aggression volumes.   Through these waves an exponential average is calculated that indicates the direction of the business flow. Note: This indicator DOES NOT WORK for Brokers and/or Markets WITHOUT the type of aggression (BUY or SELL).   Be sure to try our Professional version with configurable features and alerts:  Agr
FREE
Los compradores de este producto también adquieren
Atomic Analyst MT5
Issam Kassas
5 (14)
En primer lugar, vale la pena enfatizar que este Indicador de Trading no repinta, no redibuja y no se retrasa, lo que lo hace ideal tanto para el trading manual como para el automatizado. Manual del usuario: configuraciones, entradas y estrategia. El Analista Atómico es un Indicador de Acción del Precio PA que utiliza la fuerza y el impulso del precio para encontrar una mejor ventaja en el mercado. Equipado con filtros avanzados que ayudan a eliminar ruidos y señales falsas, y aumentan el poten
Primero que todo, vale la pena enfatizar que este Sistema de Trading es un Indicador No Repintado, No Redibujado y No Retrasado, lo que lo hace ideal tanto para el trading manual como para el automatizado. Curso en línea, manual y descarga de ajustes preestablecidos. El "Sistema de Trading Inteligente MT5" es una solución completa de trading diseñada para traders nuevos y experimentados. Combina más de 10 indicadores premium y presenta más de 7 estrategias de trading robustas, lo que lo convie
Quantum Trend Sniper
Bogdan Ion Puscasu
4.91 (43)
Introduciendo       Indicador Quantum Trend Sniper   , el innovador indicador MQL5 que está transformando la forma en que identificas y negocias los cambios de tendencia. Desarrollado por un equipo de comerciantes experimentados con experiencia comercial de más de 13 años,       Indicador de francotirador de tendencia cuántica       está diseñado para impulsar su viaje comercial a nuevas alturas con su forma innovadora de identificar cambios de tendencia con una precisión extremadamente alta.
FX Power MT5 NG
Daniel Stein
5 (5)
Obtenga su actualización diaria del mercado con detalles y capturas de pantalla a través de nuestro Morning Briefing aquí en mql5 y en Telegram ! FX Power MT5 NG es la nueva generación de nuestro popular medidor de fuerza de divisas, FX Power. ¿Y qué ofrece este medidor de fuerza de nueva generación? Todo lo que le encantaba del FX Power original PLUS Análisis de fuerza de ORO/XAU Resultados de cálculo aún más precisos Períodos de análisis configurables individualmente Límite de cálculo persona
Gold Stuff mt5
Vasiliy Strukov
4.89 (178)
Gold Stuff mt5: un indicador de tendencia diseñado específicamente para el oro, también se puede usar en cualquier instrumento financiero. El indicador no se vuelve a dibujar ni se retrasa. El marco de tiempo recomendado es H1. IMPORTANTE! Póngase en contacto conmigo inmediatamente después de la compra para obtener instrucciones y bonificación!   Puede obtener una copia gratuita de nuestro indicador Strong Support y Trend Scanner, por favor envíe un mensaje privado. ¡a mí! PARÁMETROS Draw
Reversal First Impulse levels (RFI)      INSTRUCTIONS        RUS       -       ENG              R ecommended to use with an indicator   -   TREND PRO -  Version MT4                 A key element in trading is zones or levels from which decisions to buy or sell a trading instrument are made. Despite attempts by major players to conceal their presence in the market, they inevitably leave traces. Our task was to learn how to identify these traces and interpret them correctly. Main functions:: Di
Trend Screener Pro MT5
STE S.S.COMPANY
4.88 (64)
Desbloquee el poder del comercio de tendencias con el indicador Trend Screener: ¡su solución definitiva para el comercio de tendencias impulsada por lógica difusa y un sistema multidivisa!Mejore su comercio de tendencias con Trend Screener, el revolucionario indicador de tendencias impulsado por lógica difusa. Es un poderoso indicador de seguimiento de tendencias que combina más de 13 herramientas y funciones premium y 3 estrategias comerciales, lo que lo convierte en una opción versátil para co
Ante todo, vale la pena enfatizar que esta Herramienta de Trading es un Indicador No Repintado, No Redibujado y No Retrasado, lo que la hace ideal para el trading profesional. Curso en línea, manual del usuario y demostración. El Indicador de Conceptos de Acción del Precio Inteligente es una herramienta muy potente tanto para traders nuevos como experimentados. Combina más de 20 indicadores útiles en uno solo, combinando ideas avanzadas de trading como el Análisis del Trader del Círculo Inte
FX Volume MT5
Daniel Stein
4.94 (17)
Obtenga su actualización diaria del mercado con detalles y capturas de pantalla a través de nuestro Morning Briefing aquí en mql5 y en Telegram ! FX Volume es el PRIMER y ÚNICO indicador de volumen que proporciona una visión REAL del sentimiento del mercado desde el punto de vista de un bróker. Proporciona una visión impresionante de cómo los participantes institucionales del mercado, como los brokers, están posicionados en el mercado Forex, mucho más rápido que los informes COT. Ver esta info
TPSproTREND PrO MT5
Roman Podpora
4.88 (8)
TPSpro TRENDPRO  - is a trend indicator that automatically analyzes the market and provides information about the trend and each of its changes, as well as giving signals for entering trades without redrawing! The indicator uses each candle, analyzing them separately. referring to different impulses - up or down impulse. Exact entry points into transactions for currencies, crypto, metals, stocks, indices!  -  Version MT4               DETAILED DESCRIPTION               R ecommended to use with
Este es un genial indicador para MT5 que ofrece señales precisas para entrar en una transacción sin redibujar. Se puede aplicar a cualquier activo financiero: fórex, criptomonedas, metales, acciones, índices. Nos dará valoraciones bastante precisas y nos dirá cuándo es mejor abrir y cerra una transacción. Eche un vistazo  al vídeo  (6:22), ¡contiene un ejemplo de procesamiento de una sola señal que ha amortizado el indicador! La mayoría de los tráders mejoran sus resultados comerciales durante l
FxaccurateLS
Shiv Raj Kumawat
WHY IS OUR FXACCCURATE LS MT5 THE PROFITABLE ? PROTECT YOUR CAPITAL WITH RISK MANAGEMENT Gives entry, stop and target levels from time to time. It finds Trading opportunities by analyzing what the price is doing during established trends. POWERFUL INDICATOR FOR A RELIABLE STRATEGIES We have made these indicators with a lot of years of hard work. It is made at a very advanced level. Established trends provide dozens of trading opportunities, but most trend indicators completely ignore them!
AW Trend Predictor MT5
AW Trading Software Limited
4.78 (58)
La combinación de niveles de tendencia y ruptura en un sistema. Un algoritmo de indicador avanzado filtra el ruido del mercado, determina la tendencia, los puntos de entrada y los posibles niveles de salida. Las señales indicadoras se registran en un módulo estadístico, que le permite seleccionar las herramientas más adecuadas, mostrando la efectividad del historial de señales. El indicador calcula las marcas Take Profit y Stop Loss. Manual e instrucciones ->   AQUÍ   / Versión MT4 ->   AQUÍ Có
ICT, SMC, SMART MONEY CONCEPTS, SMART MONEY, Smart Money Concept, Support and Resistance, Trend Analysis, Price Action, Market Structure, Order Blocks, BOS/CHoCH,   Breaker Blocks ,  Momentum Shift,   Supply&Demand Zone/Order Blocks , Strong Imbalance,   HH/LL/HL/LH,    Fair Value Gap, FVG,  Premium  &   Discount   Zones, Fibonacci Retracement, OTE, Buy Side Liquidity, Sell Side Liquidity, BSL/SSL Taken, Equal Highs & Lows, MTF Dashboard, Multiple Time Frame, BigBar, HTF OB, HTF Market Structure
Bill Williams Advanced
Siarhei Vashchylka
5 (5)
Bill Williams Advanced is designed for automatic chart analysis using Bill Williams' "Profitunity" system. The indicator analyzes four timeframes at once. Manual (Be sure to read before purchasing) Advantages 1. Automatically analyzes the chart using the "Profitunity" system of Bill Williams. The found signals are placed in a table in the corner of the screen. 2. Equipped with a trend filter based on the Alligator indicator. Most of the system signals are recommended to be used only accordi
Conviértase en un Breaker Trader y obtenga beneficios de los cambios en la estructura del mercado a medida que se invierte el precio. El indicador de ruptura de bloque de órdenes identifica cuándo una tendencia o movimiento de precio se acerca al agotamiento y está listo para revertirse. Le alerta sobre cambios en la estructura del mercado que generalmente ocurren cuando una reversión o un retroceso importante están a punto de suceder. El indicador utiliza un cálculo patentado que identific
The Volume by Price Indicator for MetaTrader 5 features Volume Profile and Market Profile TPO (Time Price Opportunity). Volume and TPO histogram bar and line charts. Volume Footprint charts. TPO letter and block marker collapsed and split structure charts. Session filtering and grouping. Static, dynamic and flexible range segmentation and compositing methods with relative and absolute visualizations. Graphical layering, positioning and styling options to suit the user's analytic and aesthetic n
Easy By Sell is a market indicator for opening and closing positions. It becomes easy to track market entries with alerts. It indicates trend reversal points when a price reaches extreme values ​​and the most favorable time to enter the market. it is as effective as a Fibonacci to find a level but it uses different tools such as an algorithm based on ATR indicators and Stochastic Oscillator. You can modify these two parameters as you wish to adapt the settings to the desired period. My othe
Legacy of Gann for MT5
Pavel Zamoshnikov
5 (6)
The indicator very accurately determines the levels of the possible end of the trend and profit fixing. The method of determining levels is based on the ideas of W.D.Gann, using an algorithm developed by his follower Kirill Borovsky. Extremely high reliability of reaching levels (according to K. Borovsky  - 80-90%) Indispensable for any trading strategy – every trader needs to determine the exit point from the market! Precisely determines targets on any timeframes and any instruments (forex, met
"Piranha" - an autonomous trading system that determines overbought and oversold levels on the chart. Red and blue zones represent overbought and oversold levels respectively. Entry points are marked with arrows: a downward arrow in the red zone for "sell" and an upward arrow in the blue zone for "buy". The Take profit level is indicated by the green moving average. Key features: Adjusting the Take profit level as the green moving average changes position. Averaging ability when a new market e
Quantum Heiken Ashi PRO MT5
Bogdan Ion Puscasu
4.5 (8)
Presentamos el   Quantum Heiken Ashi PRO Diseñadas para brindar información clara sobre las tendencias del mercado, las velas Heiken Ashi son reconocidas por su capacidad para filtrar el ruido y eliminar las señales falsas. Diga adiós a las confusas fluctuaciones de precios y dé la bienvenida a una representación gráfica más fluida y confiable. Lo que hace que Quantum Heiken Ashi PRO sea realmente único es su fórmula innovadora, que transforma los datos de velas tradicionales en barras de colore
Advanced Supply Demand MT5
Bernhard Schweigert
4.53 (15)
¡Actualmente con 33% de descuento! ¡La mejor solución para cualquier tráder principiante o experto! Este indicador es una herramienta comercial única, de alta calidad y asequible, porque incorpora una serie de características patentadas y una nueva fórmula. Con esta actualización, podrá mostrar zonas de doble marco temporal. No solo podrá mostrar un marco temporal más alto, sino también mostrar ambos, el marco temporal del gráfico MÁS el marco temporal más alto: MOSTRANDO ZONAS ANIDADAS. A todos
IX Power MT5
Daniel Stein
5 (3)
IX Power   lleva por fin la insuperable precisión de FX Power a los símbolos que no son de Forex. Determina con exactitud la intensidad de las tendencias a corto, medio y largo plazo de tus índices, acciones, materias primas, ETF e incluso criptodivisas favoritas. Puede   analizar todo lo   que su terminal le ofrece. Pruébalo y experimenta cómo   tu timing mejora significativamente   a la hora de operar. Características principales de IX Power Resultados de cálculo 100% precisos y sin rep
El indicador de reversión de ADR le muestra de un vistazo dónde se cotiza actualmente el precio en relación con su rango diario promedio normal. Recibirá alertas instantáneas a través de una ventana emergente, correo electrónico o push cuando el precio exceda su rango promedio y los niveles por encima de su elección para que pueda saltar rápidamente a retrocesos y reversiones. El indicador dibuja líneas horizontales en el gráfico en los extremos del rango promedio diario y también extensiones p
Gartley Hunter Multi
Siarhei Vashchylka
5 (7)
Gartley Hunter Multi - An indicator for searching for harmonic patterns simultaneously on dozens of trading instruments and on all possible timeframes. Manual (Be sure to read before purchasing) | Version for MT4 Advantages 1. Patterns: Gartley, Butterfly, Shark, Crab. Bat, Alternate Bat, Deep Crab, Cypher 2. Simultaneous search for patterns on dozens of trading instruments and on all possible timeframes 3. Search for patterns of all possible sizes. From the smallest to the largest 4. A
TPA True Price Action indicator reveals the true price action of the market makers through 100% non-repainting signals strictly at the close of a candle! TPA shows entries and re-entries, every time the bulls are definitely stronger than the bears and vice versa. Not to confuse with red/green candles. The shift of power gets confirmed at the earliest stage and is ONE exit strategy of several. There are available now two free parts of the TPA User Guide for our customers. The first "The Basics"
** All Symbols x All Timeframes scan just by pressing scanner button ** ***Contact me after purchase to send you instructions and add you in "123 scanner group" for sharing or seeing experiences with other users. After 17 years of experience in the markets and programming, Winner indicator is ready. I would like to share with you! Introduction The 123 Pattern Scanner indicator with a special enhanced algorithm is a very repetitive common pattern finder with a high success rate . Interestingly,
¡La mejor solución para cualquier operador novato o experto! Este indicador es una herramienta única, de alta calidad y asequible porque hemos incorporado una serie de características propias y una nueva fórmula. ¡Con sólo UN gráfico puede leer la Fuerza de la Divisa para 28 pares de Divisas! Imagínese cómo mejorará su operativa porque podrá señalar el punto exacto de activación de una nueva tendencia o de una oportunidad de scalping. Manual del usuario: haga   clic aquí Ese es el primero
**   All Symbols   x   All Timeframes   scan just by pressing scanner button ** *** Contact me after the purchase to send you instructions and add you in "Trend Reversal group" for sharing or seeing experiences with other users. Introduction: Trendlines are the most famous technical analysis in trading . Trendlines continually form on the charts of markets across all the different timeframes providing huge opportunities for traders to jump in and profit on the action. In the other hand,  The tre
Este tablero muestra los últimos   patrones armónicos   disponibles para los símbolos seleccionados, por lo que ahorrará tiempo y será más eficiente /   versión MT4 . Indicador gratuito:   Basic Harmonic Pattern Columnas del indicador Symbol:   aparecerán los símbolos seleccionados Trend :   alcista o bajista Pattern :   tipo de patrón (gartley, mariposa, murciélago, cangrejo, tiburón, cifrado o ABCD) Entry :   precio de entrada SL:   precio de stop loss TP1:   1er precio de toma de benefici
Otros productos de este autor
Esta biblioteca le permitirá gestionar operaciones utilizando cualquiera de sus EA y es muy fácil de integrar en cualquier EA, lo que puede hacer usted mismo con el código de secuencia de comandos que se menciona en la descripción y también ejemplos de demostración en video que muestran el proceso completo. - Órdenes de límite de colocación, límite de SL y límite de obtención de ganancias - Realizar órdenes de Mercado, SL-Market, TP-Market - Modificar orden límite - Cancelar orden
Herramienta de negociación de Binance para MT5 1. Este producto incluye gráfico en vivo desde websocket, gráfico histórico, Actualizaciones automáticas al reiniciar el terminal mt5 para que funcione sin problemas sin intervención manual, lo que le permite operar con Binance sin problemas. Negociación, gráficos en vivo y datos históricos disponibles para spot y futuros Cómo utilizar : 1. Debe agregar su clave API y su secreto en el campo Entrada de esta utilidad. Cuando cree su API,
This indicator finds Double Top and Double bottom Example : What is Double Top When price establishes a new high and then falls, then reverse to the same candle area of High then its considered a valid double top and vice versa for double bottom. 1. It plots and high and low on visible chart if ChartChange is set to true else it searches on new bar opening 2. If there is double top and double bottom found in visible chart window then it plots a line 3. It has options to customize text color, te
FREE
Esta biblioteca le permitirá gestionar operaciones utilizando cualquiera de sus EA y es muy fácil de integrar en cualquier EA, lo que puede hacer usted mismo con el código de secuencia de comandos que se menciona en la descripción y también ejemplos de demostración en video que muestran el proceso completo. Este producto permite operaciones comerciales a través de API y no incluye gráficos. Los usuarios pueden utilizar gráficos de corredores que proporcionan gráficos de Crypto y enviar órdenes a
Crypto Charting
Rajesh Kumar Nait
5 (3)
Gráficos de criptomonedas para MT5. Características : 1. Gráfico OHLC en vivo a través de Websocket (wss) 2. Actualizar el historial de barras desde API 3. Historial de actualización automática en los gráficos cuando se reinicia MT5 para garantizar que no falten datos en las barras y que siempre se mantenga actualizado como el gráfico nativo 4. Actualización del historial programada desde la API: en caso de que se produzca una desconexión de Internet durante un milisegundo, el val
Crypto Ticks and Depth
Rajesh Kumar Nait
5 (1)
Profundidad de oferta y demanda y reserva de datos de ticks en vivo de criptomonedas para EA Intercambio disponible: 1. Binance Spot (admite la profundidad del libro de pedidos en la ventana del gráfico activo) y futuros (admite múltiples profundidades del libro de pedidos) 2. Kucoin Spot y Futures, admite la profundidad del libro de pedidos en la ventana del gráfico activo 3. Los futuros Bybit y los futuros inversos marcan la oferta y la solicitud de datos en último lugar Próximo
La vela anterior de múltiples divisas o el escáner de barras anteriores lo ayudan a escanear gráficos de múltiples símbolos con cualquier período de tiempo personalizado que seleccione en la configuración del indicador. Basado en el producto: https://www.mql5.com/en/market/product/110229 Se puede utilizar para escanear varios símbolos para el máximo y mínimo del día anterior, el máximo y mínimo de la semana anterior, el máximo y mínimo del mes anterior o cualquier período de tiempo person
Este indicador traza hasta 6 niveles que se pueden habilitar / deshabilitar para hacer que el gráfico sea más limpio según los requisitos del comerciante Estos 6 niveles están en 2 conjuntos: alto y bajo Para cada conjunto, se puede seleccionar un período de tiempo diferente Se basa en la estrategia de reversión del Máximo Mínimo Anterior, ya que se considera que el precio generalmente muestra rechazo en un período de tiempo más pequeño, como 5 minutos, cuando el precio alcanza el Máximo
Las estructuras de mercado son las que, cuando se rompen en un período de tiempo más alto, pueden ayudar a despejar una tendencia para un comerciante. 1. Este indicador dibujará a ZigZag solo en las últimas 2 estructuras (el máximo y el mínimo anteriores de ZigZag) y solo se formará una nueva barra de ZigZag cuando se rompa la estructura. 2. Da notificación de Terminal y Push al romper la estructura 3. Aumente y disminuya la profundidad de extensión de ZigZag con las teclas [ y ] para a
Este indicador le permite mostrar etiquetas de niveles de Fibonacci con un tamaño de fuente grande . Admite hasta 25 niveles de Fibonacci. - Tan pronto como dibujas Fibonacci, muestra los niveles que agregaste como parámetro de entrada con un tamaño de fuente grande con el color y la fuente que elijas. Opciones personalizables: 1. Fuente de texto Fibo 2. Tamaño del texto Fibonacci 3. Color del texto Fibonacci 3. Agrega una descripción a cada nivel. 4. Otras opciones como
El indicador gráfico Perfect Seconds le permite convertir velas de minutos en segundos 1. Elija cualquier cantidad de segundos para cerrar una barra al 100% con la hora exacta. 2. Estos son datos basados en tarifas. Funciona incluso si las marcas no están disponibles. 3. No se requiere DLL externa, funciona sin problemas en VPS 4. Código rápido y optimizado 5. Admite pares de criptomonedas como BInance, Kucoin y todos los demás intercambios donde los gráficos de futuros se pueden
Símbolo múltiple Haga doble clic en cualquier lugar del gráfico para establecer una alerta de precio y recibir notificaciones de Terminal Alert o Push Notification 1. Agregue la utilidad EA en el gráfico 2. Explore el gráfico con las teclas de flecha <- izquierda o -> derecha 3. Haga doble clic en cualquier lugar del gráfico y se agregará una línea, arrastre esta línea para establecer el precio deseado y listo, ¡la alerta está configurada! Cuando el precio llegue a la línea, se lo notif
Este indicador traza hasta 6 niveles que se pueden habilitar / deshabilitar para hacer que el gráfico sea más limpio según los requisitos del comerciante Estos 6 niveles están en 2 conjuntos: alto y bajo Para cada conjunto, se puede seleccionar un período de tiempo diferente Se basa en la estrategia de reversión del Máximo Mínimo Anterior, ya que se considera que el precio generalmente muestra rechazo en un período de tiempo más pequeño, como 5 minutos, cuando el precio alcanza el Máximo
Cobra Pivot Points es un indicador para trazar los puntos de pivote mejor optimizados que puede probar usted mismo descargando la DEMO. 1. Seleccione los dos mejores modos de pivote: Cobra Pivots o Camrilla Pivots 2. Puede utilizar cualquier período de tiempo no limitado a D1. 3. Puedes jugar con el valor de cierre alto bajo del día anterior con el parámetro Shift. 1 = Barra anterior, 2 = Barra antes de la barra anterior, etc. Estos parámetros le ayudarán en la investigación y el desarr
El escáner de múltiples símbolos de puntos de pivote escanea todos los símbolos disponibles en Marketwatch para detectar puntos de pivote Floor, Woodie, Camarilla, Demark o Fibonacci. Puede seleccionar cualquier período de tiempo para calcular los puntos de pivote y recibir alertas cuando el precio toque estos niveles de soporte y resistencia. Para puntos de pivote visuales Puede que le interese este producto: https://www.mql5.com/en/market/product/110231 Tiene opciones para elegir var
Agregue este indicador al gráfico y establezca la configuración ExtDepth de ZigZag Da una alerta instantánea cuando el precio toca la línea de tendencia del canal superior, inferior o medio Características : -Habilitar/Deshabilitar alertas en línea superior, inferior o media - Agregar pausa después de una alerta en segundos - Pausar o reanudar el canal de tendencia con un botón en el gráfico - Agregue alertas tempranas agregando puntos en el campo de entrada, por ejemplo, el precio ETH es
Crypto to MT5
Rajesh Kumar Nait
Crypto.com a MT5 Live Candlestick Stream a Metatrader 5 desde Crypto.com websocket Es un OHCLV (Open High Low Close Real Volume) Datos de tarifas en vivo  comerciantes, si en un gráfico de minutos, los datos de OHLC no son correctos, entonces puede dar un análisis incorrecto en el estudio del gráfico técnico. Este producto asegura que proporciona datos precisos en tiempo real que pueden ayudar en el análisis manual puede consultar mi otro producto criptográfico en mi perfil https://www.
Explorador de patrones para patrones triangulares como triángulo simétrico, triángulo asimétrico o triángulo de ángulo recto, patrón de cuña como cuña ascendente o cuña descendente, patrón de expansión y canal de tendencia Este indicador explora el patrón histórico, así como los patrones actuales. Es el mejor indicador para aquellos que intentan ahorrar tiempo dibujando manualmente una línea de tendencia o un triángulo y desean utilizarlo para el análisis automatizado de trazar los mejores pa
Panel de actualización del historial de futuros de Kraken Crypto Exchange Características : 1. Creará un símbolo basado en la configuración y actualizará completamente el historial que está disponible en la API de Kraken para el símbolo. Este panel actualiza el historial de los símbolos Kraken Futures con datos Open High Low Close, también imprime un mensaje cuando se completa la actualización del historial. Tenga en cuenta que esto no es datos EN VIVO.   3. Debe agregar la URL de la AP
5 EMA Scalping Strategy Multi Symbol Scanner This EA utility will scan all symbols which are selected in marketwatch and alert when such condition is formed in chart when Candle low is above EMA 5 for Sell alert and Candle high is lower from EMA5 so you can be ready before selling or buying for scalping purpose on 5min chart For more details watch attached video Logic : When a candle closes above 5 EMA in 5 mins chart, Wait for its low to break and Sell when low is broken by wick, Your SL sh
Multi Symbol ZigZag Breakout Scanner escanea todos los símbolos seleccionados en MarketWatch. Ayudará a encontrar fácilmente el doble techo, el doble suelo o cualquier nivel de extensión de Fibonacci cuando el precio esté a punto de alcanzar esos niveles. Puede seleccionar Período de tiempo y múltiples Profundidades de extensión (hasta 3) de Zigzag. Los ZigZag recomendados son 21,34 y 55, que cubren todos los tipos de Zigzag y filtro de ruido Puede configurar para recibir una alerta de
Escáner de ruptura Fibo Musang FMBCR CB1 MT5 Fibo Musang CB1 o Candle Break 1 es una estrategia que funciona muy bien en Gold XAUUSD y otros símbolos forex. Este escáner lo ayudará a escanear monedas multisímbolo muy rápido y recibir alertas sobre la ruptura de FMCBR CB1 Consulte el video para obtener más detalles, ya que es completamente personalizable según las preferencias del comerciante: 1. Puede seleccionar el marco de tiempo y el historial de barras 2. Puede modificar su con
Símbolo múltiple Haga doble clic en cualquier lugar del gráfico para establecer una alerta de precio y recibir notificaciones de Terminal Alert o Push Notification 1. Agregue la utilidad EA en el gráfico 2. Explore el gráfico con las teclas de flecha <- izquierda o -> derecha 3. Haga doble clic en cualquier lugar del gráfico y se agregará una línea, arrastre esta línea para establecer el precio deseado y listo, ¡la alerta está configurada! Cuando el precio llegue a la línea, se lo notif
Control Candle is the candlestick which holds multiple inside bars and are in control until its high low range is broken by close of any candlestick. When control candle is broken, price may act on these control candle as support and resistance. This indicator create rectangles on chart which will help you find control candles fast. Control candle indicator box is customizable by color, style, width and other options in indicator settings.
Cobra Levels
Rajesh Kumar Nait
Niveles de cobra Estos son 6 conjuntos de niveles con dos modos de frecuencia que funcionan en el mercado universal, incluidos forex, cripto, materias primas, nifty y banknifty. Se publican después de las mejores investigaciones sobre instrumentos financieros. Los niveles superiores se denominan U1 a U5 y los niveles inferiores se denominan D1 a D5. El mercado puede moverse en los canales internos hasta U3 o D3 en condiciones normales o en los canales externos U4 a U5 o D4 a D5 en condici
Este indicador rastrea eficientemente cualquier otra vela temporal que desee rastrear en el mismo gráfico. 1. Seleccione cualquier período de tiempo superior para cargar barras en el mismo gráfico. 2. Personaliza los colores y el estilo de los candelabros. 3. Elige el número de barras para dibujar velas. 4. Realice un seguimiento de las velas completas con períodos de tiempo más altos junto con la mecha y el cuerpo. 5. Fácil y conveniente para aquellos que no quieren cambiar de gr
Cobra Pivot Points es un indicador para trazar los puntos de pivote mejor optimizados que puede probar usted mismo descargando la DEMO. 1. Seleccione los dos mejores modos de pivote: Cobra Pivots o Camrilla Pivots 2. Puede utilizar cualquier período de tiempo no limitado a D1. 3. Puedes jugar con el valor de cierre alto bajo del día anterior con el parámetro Shift. 1 = Barra anterior, 2 = Barra antes de la barra anterior, etc. Estos parámetros le ayudarán en la investigación y el desarr
La vela anterior de múltiples divisas o el escáner de barras anteriores lo ayudan a escanear gráficos de múltiples símbolos con cualquier período de tiempo personalizado que seleccione en la configuración del indicador. Basado en el producto: https://www.mql5.com/en/market/product/78657 Se puede utilizar para escanear varios símbolos para el máximo y mínimo del día anterior, el máximo y mínimo de la semana anterior, el máximo y mínimo del mes anterior o cualquier período de tiempo persona
El escáner de múltiples símbolos de puntos de pivote escanea todos los símbolos disponibles en Marketwatch para detectar puntos de pivote Floor, Woodie, Camarilla, Demark o Fibonacci. Puede seleccionar cualquier período de tiempo para calcular los puntos de pivote y recibir alertas cuando el precio toque estos niveles de soporte y resistencia. Para puntos de pivote visuales Puede que le interese este producto: https://www.mql5.com/en/market/product/110072 Tiene opciones para elegir var
Filtro:
Mao Le
21
Mao Le 2024.05.29 07:59 
 

It is really strong indicator. It's help me a lot in trading. Thank you for your hard working.

Passakon Ekaburudkul
274
Passakon Ekaburudkul 2024.01.08 11:44 
 

I really like it when use in H1 or over.

Peter Pedro
68
Peter Pedro 2023.04.08 14:50 
 

super

Respuesta al comentario
Versión 1.1 2024.01.08
added new logic in input to customize spinning top