• Información general
  • Comentarios
  • Discusión
  • Novedades

Zigzag indicator

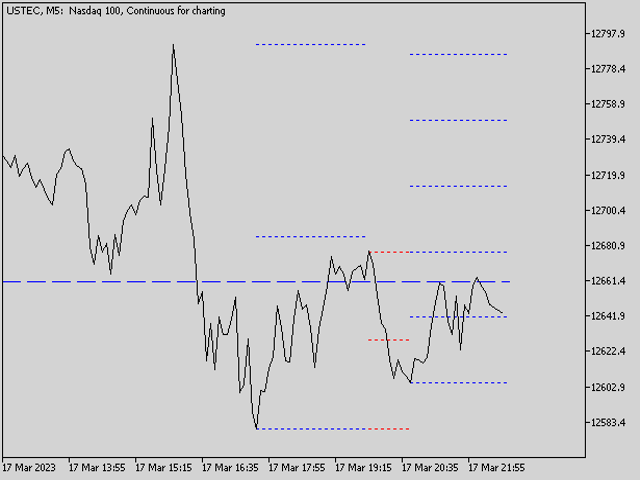
El indicador funciona con dos períodos de tiempo, tiene una visualización de ondas directamente en el gráfico de trabajo y muestra niveles de ondas horizontales.

El indicador ZigZag conecta máximos y mínimos significativos en el gráfico de precios con líneas inclinadas visibles que facilitan la percepción del movimiento de las olas y divide las olas en rangos por niveles. Los extremos se calculan por precios High \ Low o Close.

Los niveles de ola se proyectan en la siguiente ola, lo que le permite obtener niveles de soporte/resistencia. Los niveles se calculan usando el algoritmo de Fibonacci o usan una relación lineal. Los niveles del periodo de tiempo en el que se ha convertido, suelen tener una mayor prioridad. Cada nivel tiene una información sobre herramientas que contiene la información necesaria sobre el nivel.

Una característica de los indicadores ZigZag es que un cambio en el precio de un activo puede provocar un cambio en el valor anterior, lo que debe tenerse en cuenta al tomar decisiones comerciales solo sobre la base de dichos niveles. Sin embargo, dichos niveles permiten emitir un juicio sobre la posible dirección del movimiento de las cotizaciones y los valores de los precios, donde es posible cambiar de dirección o ralentizar el movimiento.

El algoritmo del indicador está adaptado para funcionar en el momento actual y no está destinado al análisis de datos históricos.


Parámetros de entrada

  • High period for plotting - período senior para niveles de construcción
  • Waves plotting mode - modo de construcción de niveles (Close o HighLow)
  • Levels plotting mode - modo de construcción de nivel (Fibo o Line)
  • Backstep - número de barras a calcular
  • Style of Current period lines - estilo de nivel de período actual
  • Style of High period lines - estilo de alto nivel
  • Color of Up-Direction wave - color de los niveles con dirección ascendente
  • Color of Down-Direction wave- color de los niveles con dirección descendente

Productos recomendados
Follow The Line MT5
Oliver Gideon Amofa Appiah
4.5 (28)
This indicator obeys the popular maxim that: "THE TREND IS YOUR FRIEND" It paints a GREEN line for BUY and also paints a RED line for SELL. (you can change the colors). It gives alarms and alerts of all kinds. IT DOES NOT REPAINT and can be used for all currency pairs and timeframes. Yes, as easy and simple as that. Even a newbie can use it to make great and reliable trades. NB: For best results, get my other premium indicators for more powerful and reliable signals. Get them here: https://www.m
FREE
Free automatic Fibonacci is an indicator that automatically plots a Fibonacci retracement based on the number of bars you select on the BarsToScan setting in the indicator. The Fibonacci is automatically updated in real time as new highest and lowest values appears amongst the selected bars. You can select which level values to be displayed in the indicator settings. You can also select the color of the levels thus enabling the trader to be able to attach the indicator several times with differe
FREE
Value Chart Candlesticks
Flavio Javier Jarabeck
4.7 (10)
The idea of a Value Chart indicator was presented in the very good book I read back in 2020 , " Dynamic Trading Indicators: Winning with Value Charts and Price Action Profile ", from the authors Mark Helweg and David Stendahl. The idea is simple and the result is pure genius: Present candlestick Price analysis in a detrended way! HOW TO READ THIS INDICATOR Look for Overbought and Oversold levels. Of course, you will need to test the settings a lot to find the "correct" one for your approach.
FREE
Donchian Pro
Paulo Henrique Faquineli Garcia
5 (2)
The Donchian Channel Channels are among the most popular tools of technical analysis, as they visually convey to the analyst the limits within which most price movement tends to occur. Channel users know that valuable information can be obtained at any time, whether prices are in the central region of a band or close to one of the border lines. One of the best known techniques to explore these concepts is Bollinger Bands. However, John Bollinger was not the only one to research the applicatio
FREE
Mitimom
Danil Poletavkin
The indicator is based on Robert Miner's methodology described in his book "High probability trading strategies" and displays signals along with momentum of 2 timeframes. A Stochastic oscillator is used as a momentum indicator. The settings speak for themselves period_1 is the current timeframe, 'current' period_2 is indicated - the senior timeframe is 4 or 5 times larger than the current one. For example, if the current one is 5 minutes, then the older one will be 20 minutes The rest of the
FREE
Supports And Resistances Lines
Francisco Gomes Da Silva
4.74 (34)
Indicador de zonas de soporte y resistencia MT5 este indicador sabe cómo identificar techos y suelos automáticamente. Este indicador de soporte y resistencia crea líneas de soporte y líneas de resistencia basadas en máximos y mínimos. cómo hacer líneas de soporte y resistencia. este es un indicador para hacer líneas automáticas de soporte y resistencia. cómo encontrar el nivel de soporte con indicador. este indicador encuentra máximos y mínimos automáticamente. El indicador crea automáticamente
FREE
Coral Indi
Dinh Duong Luong
Coral trend is   a trend-following indicator that is widely popular among FOREX traders . It is usually used as a confluence with other indicators. It uses combinations of moving averages with complex smoothing formulas! It has two configurable parameters: Coefficient   - smoothing ratio (*) Applied price Calculation: Coral = (-0.064) * B6 + 0.672 * B5 - 2.352 * B4 + 2.744 * B3
FREE
ThreeM Quantum Tunneling
Nguyen Duc Quy
3.89 (9)
There is a science, named Quantitative Finance, that allows to study the financial derivative pricing models using the methods of theoretical and mathematical physics. Lately I came across a paper that describes a new indicator for technical analysis that combines ideas from quantum physics and brings them to finance. I got interested in it and decided I would teach how to implement indicators based on a scientific papers in MQL5.  The original Moving Mini-Max paper [2] is written by Z.K. Sila
FREE
The   Retracement indicator   shows the current and historical high, low and mid values. Optionally, it can also display major retracement levels. All these levels together form the significant levels of support and resistance. Therefore, it is essential to know them for every kind of trader. Levels High Low Midpoint 76,4 % 61,8 % 38,2 % 23,6 % Main features The indicator shows the actual levels of High, Low, Mid and selected retracements. Four optional retracement levels. Alert notificatio
FREE
Super Trend eu
Emin Ulucanli
4.75 (4)
SUPERTREND; Es un indicador de seguimiento de tendencias basado en el SuperTrend ATR creado por Olivier Seban. Se puede utilizar para detectar cambios en la dirección de la tendencia y localizar paradas. Cuando el precio cae por debajo de la curva del indicador, se vuelve rojo e indica una tendencia bajista. Por el contrario, cuando el precio se mueve por encima de la curva, el indicador se vuelve verde, lo que indica una tendencia alcista. Al igual que otros indicadores, funciona bien en SuperT
FREE
El estrategia de trading Moving Average Convergence Divergence (MACD) es una herramienta popular de análisis técnico que se utiliza para identificar cambios en el impulso y la dirección de la tendencia. El MACD se calcula restando la media móvil exponencial (EMA) de 26 períodos de la EMA de 12 períodos. Luego se traza una EMA de 9 períodos, llamada "línea de señal", sobre el MACD para actuar como un disparador de señales de compra y venta. El MACD se considera en territorio alcista cuando la lín
FREE
This indicator is a zero-lag indicator and displays  strength of trend change . True Trend  Oscillator Pro works best in combination with True Trend Moving Average Pro that displays exact trend as is. Oscillator value is exact price change in given direction of the trend. True Trend Moving Average Pro: https://www.mql5.com/en/market/product/103586 If you set PERIOD input parameter to 1 this indicator becomes a sharpshooter for binary options. Developers can use True Trend Oscillator in E
FREE
Trend MACD Candles
Claus Dietrich
5 (1)
COLORED TREND MA / MACD CANDLES draw MA Candles above/below Moving Average draw MACD Candles above and below 0 and Signal-Line Your  Advantage: a simple view of the trend direction a simple view over the higher trend direction a calmer chart for the eye clear rules can be defined Settings: Value Quick-Set : pre-Settings MACD 3 / 9 / 6 MACD customize MA Candles Fast EMA : 12 Slow EMA : 26 MACD SMA : 9 1. MA Period : default 14 and 20, which are my favorite for all timeframes, I believe in the 1
FREE
Indicator introduction: The indicator draws wave lines and histograms, It has small price lag, and the signal will not drift. The indicator can send emails, alerts and notifications to you when previous k line has an up arrow and it is under the histogram sections or it has a down arrow. you can choose whether or not to send the two kind of alerts, the alerts repetition times can also be changed. If the indicator appears red and green histograms, this is a buy zone. It can be used to analyze mar
FREE
Indicador Heiken Ashi MT5 Mejore su análisis técnico con el indicador Heiken Ashi MT5. Esta poderosa herramienta transforma los datos de precios estándar en velas más suaves y orientadas a la tendencia, facilitando la identificación de tendencias del mercado y posibles puntos de inversión. Características principales: Identificación clara de tendencias: Distinga visualmente entre tendencias alcistas y bajistas con diferentes colores de velas. Reducción del ruido: Filtre las fluctuaciones de pre
FREE
Si tu estrategia requiere operar en un período específico de actividad del mercado, ya sea tranquilo o turbulento, este indicador te ayudará a encontrar esos intervalos de tiempo dentro de la semana para cada par de divisas mediante estadísticas. El principio de funcionamiento del indicador es bastante simple. La semana de trading, desde las 00:00 del lunes hasta las 23:59 del viernes, se divide en intervalos de tiempo, cuya duración corresponde al marco temporal actual. Para cada intervalo d
FREE
Weis Waves
Flavio Javier Jarabeck
2.76 (17)
The original author is David Weis, an expert in the Wyckoff Method. The Weis Wave is a modern adaptation of the 1930's Wyckoff Method, another expert in Tape Reading techniques and Chart Analysis. Weis Waves takes market volume and stacks it into waves according to price conditions giving the trader valuable insights about the market conditions. If you want to learn more about this subject you can find tons of videos in YouTube. Just look for "The Wickoff Method", "Weis Wave" and "Volume Spread
FREE
What is this indicator? This indicator is the MACD (Moving Average Convergence/Divergence) supporting Virtual Trading mode of  Knots Compositor . When the mode is turned on, the indicator will be recalculated based on the displayed candlesticks. When the mode is turned off, the indicator will be recalculated based on the original chart candlesticks. Types of the applied price - Close - Open - High - Low - Median Price (HL/2) - Typical Price (HLC/3) - Weighted Price (HLCC/4) KC-Indicators
FREE
Show Pips for MT5
Roman Podpora
4.63 (19)
Este indicador de información será útil para quienes quieran estar siempre al tanto de la situación actual de la cuenta. -   Indicadores más útiles El indicador muestra datos como ganancias en puntos, porcentaje y moneda, así como el diferencial del par actual y el tiempo hasta que la barra se cierra en el período de tiempo actual. Hay varias opciones para colocar la línea de información en el gráfico: A la derecha del precio (corre detrás del precio); Como comentario (en la esquina superior
FREE
This is  RSI with alarm and push notification  -is a indicator based on the popular Relative Strength Index (RSI) indicator with Moving Average and you can use it in Forex, Crypto, Traditional, Indices, Commodities. You can change colors to see how it fits you. Back test it, and find what works best for you. This product is an oscillator with dynamic overbought and oversold levels, while in the standard RSI, these levels are static and do not change. This allows  RSI with alarm and push notific
FREE
Donchian Channel DC is the indicator of Donchian Channels, that plots maximum and minimum values of a specific period, besides mean value line. It´s possible to configure simple period for analysis and the indicator will plot all three values. You can trade with this indicator as trend or reversal, according to each strategy. Do not let to test others indicators as soon as others expert advisors.
WaveTrend Plus
Nguyen Thanh Cong
5 (3)
Introduction WaveTrend Plus is an amazing oscillator that can detect optimal entry points in the market with high precision using complex computations of price and momentum. This version packs many improvements compared to the original WaveTrend such as cleaner visuals, oversold/overbought signals and divergence detection Signal Buy when oversold signal appear (green dot below) or when a bullish divergence is detected (green dashed line) Sell when overbought signal appear (red dot ab
FREE
Bienvenido a nuestro   patrón de onda de precios   MT5 --(Patrón ABCD)-- El patrón ABCD es un patrón comercial poderoso y ampliamente utilizado en el mundo del análisis técnico. Es un patrón de precio armónico que los comerciantes utilizan para identificar oportunidades potenciales de compra y venta en el mercado. Con el patrón ABCD, los operadores pueden anticipar posibles movimientos de precios y tomar decisiones informadas sobre cuándo ingresar y salir de las operaciones. Versión EA:   P
FREE
Multi-timeframe trend indicator, based on the ADX / ADXWilder indicator The indicator shows trend areas using ADX or ADXWilder indicator data from multiple timeframes. The impulse mode of the indicator allows you to catch the beginning of a trend, and several "Screens" with different timeframes allow you to filter out market noise. How the indicator works: if PDI is greater than NDI, then it`s bullish movement; if PDI is less than NDI, then it`s bearish movement; to determine any trend, it
FREE
Curver Arrows
Francis Dube
3.75 (4)
Es un indicador muy bien conocido. Ha sido portado directamente desde la versión para MetaTrader 4 que está disponible libremente en Internet. No se redibuja en absoluto. El indicador implementa la estrategia de la ruptura. Las flechas indican la dirección del mercado. Utilice este indicador en los períodos de M15 y superiores.
FREE
El indicador muestra niveles   redondos   en el gráfico. También se denominan niveles   psicológicos , bancarios o de jugadores importantes. En estos niveles, hay una verdadera pelea entre alcistas y bajistas, la acumulación de muchos pedidos, lo que conduce a una mayor volatilidad. El indicador se ajusta   automáticamente   a cualquier instrumento y período de tiempo. Cuando el   nivel 80   se rompe y luego se prueba,   compramos . Cuando el   nivel 20   se rompe y luego se prueba,   vendemos
FREE
LT Super Trend
Sie Samuel Roland Youl
4.86 (7)
El indicador Super Trend es una herramienta popular de análisis técnico utilizada por traders para identificar la dirección de una tendencia y los posibles puntos de entrada y salida en el mercado. Es un indicador que sigue la tendencia y proporciona señales basadas en la acción del precio y la volatilidad. El indicador Super Trend consta de dos líneas: una indica la tendencia alcista (generalmente de color verde) y la otra indica la tendencia bajista (generalmente de color rojo). Las líneas
FREE
Bar Color Trend
Germano Chagas
4.5 (6)
Combining the best of Price Action , Directional Movement , and Divergence/Convergence analysis, Candle Color Trend is a easy and reliable way to identify trend direction. The indicator automatically paints the candles according to the assumption that an uptrend is defined by prices that form a series of higher highs and higher lows. In contrast, a downtrend is defined by prices that form a series of lower highs and lower lows. Additionally, ADX Wilder indicator is used to measure trend weakness
FREE
KeltnerChannelIndicatorMT5
Todd Terence Bates
3 (2)
The Keltner Channel is a volatility-based technical indicator composed of three separate lines. The middle line is an exponential moving average (EMA) of the price. Additional lines are placed above and below the EMA. The upper band is typically set two times the Average True Range (ATR) above the EMA, and the lower band is typically set two times the ATR below the EMA. The bands expand and contract as volatility (measured by ATR) expands and contracts. Since most price action will be encompasse
FREE
FractalEfficiencyIndicator   A ratio between 0 and 1 with the higher values representing a more efficient or trending market,  It is used in the calculation of Perry J. Kaufman Adaptive Moving Average (KAMA), dividing the price change over a period by the absolute sum of the price movements that occurred to achieve that change. The Fractal Efficiency or also known as Efficiency Ratio was first published by Perry J. Kaufman in his book   ‘Smarter Trading‘. This is mostly considered a filter for v
FREE
Los compradores de este producto también adquieren
TPSpro RFI Levels MT5
Roman Podpora
4.73 (11)
INSTRUCCIONES       RUSO   -   ING        Se   recomienda utilizar con un indicador.       -       TPSpro   TENDENCIA PRO -   Versión MT5 Un elemento clave en el trading son las zonas o niveles desde los que se toman las decisiones de compra o venta de un instrumento de trading. A pesar de los intentos de los principales actores de ocultar su presencia en el mercado, inevitablemente dejan rastros. Nuestra tarea era aprender a identificar estos rastros e interpretarlos correctamente. Funciones p
TPSproTREND PrO MT5
Roman Podpora
4.89 (9)
TPSpro TREND PRO  - is a trend indicator that automatically analyzes the market and provides information about the trend and each of its changes, as well as giving signals for entering trades without redrawing! The indicator uses each candle, analyzing them separately. referring to different impulses - up or down impulse. Exact entry points into transactions for currencies, crypto, metals, stocks, indices!  Version MT4               DETAILED DESCRIPTION               R ecommended to use with an
Primero que todo, vale la pena enfatizar que este Sistema de Trading es un Indicador No Repintado, No Redibujado y No Retrasado, lo que lo hace ideal tanto para el trading manual como para el automatizado. Curso en línea, manual y descarga de ajustes preestablecidos. El "Sistema de Trading Inteligente MT5" es una solución completa de trading diseñada para traders nuevos y experimentados. Combina más de 10 indicadores premium y presenta más de 7 estrategias de trading robustas, lo que lo convie
Atbot
Zaha Feiz
4.91 (35)
AtBot: Cómo funciona y cómo usarlo ### Cómo funciona El indicador "AtBot" para la plataforma MT5 genera señales de compra y venta utilizando una combinación de herramientas de análisis técnico. Integra la Media Móvil Simple (SMA), la Media Móvil Exponencial (EMA) y el índice de Rango Verdadero Promedio (ATR) para identificar oportunidades de trading. Además, puede utilizar velas Heikin Ashi para mejorar la precisión de las señales. Deja una reseña después de la compra y recibe un regalo especia
Atomic Analyst MT5
Issam Kassas
4.42 (19)
En primer lugar, vale la pena enfatizar que este Indicador de Trading no repinta, no redibuja y no se retrasa, lo que lo hace ideal tanto para el trading manual como para el automatizado. Manual del usuario: configuraciones, entradas y estrategia. El Analista Atómico es un Indicador de Acción del Precio PA que utiliza la fuerza y el impulso del precio para encontrar una mejor ventaja en el mercado. Equipado con filtros avanzados que ayudan a eliminar ruidos y señales falsas, y aumentan el poten
Gold Stuff mt5
Vasiliy Strukov
4.92 (165)
Gold Stuff mt5: un indicador de tendencia diseñado específicamente para el oro, también se puede usar en cualquier instrumento financiero. El indicador no se vuelve a dibujar ni se retrasa. El marco de tiempo recomendado es H1. IMPORTANTE! Póngase en contacto conmigo inmediatamente después de la compra para obtener instrucciones y bonificación!   Puede obtener una copia gratuita de nuestro indicador Strong Support y Trend Scanner, por favor envíe un mensaje privado. ¡a mí! PARÁMETROS Draw
FX Power MT5 NG
Daniel Stein
5 (5)
Obtenga su actualización diaria del mercado con detalles y capturas de pantalla a través de nuestro Morning Briefing aquí en mql5 y en Telegram ! FX Power MT5 NG es la nueva generación de nuestro popular medidor de fuerza de divisas, FX Power. ¿Y qué ofrece este medidor de fuerza de nueva generación? Todo lo que le encantaba del FX Power original PLUS Análisis de fuerza de ORO/XAU Resultados de cálculo aún más precisos Períodos de análisis configurables individualmente Límite de cálculo persona
Quantum Trend Sniper
Bogdan Ion Puscasu
4.8 (49)
Introduciendo       Indicador Quantum Trend Sniper   , el innovador indicador MQL5 que está transformando la forma en que identificas y negocias los cambios de tendencia. Desarrollado por un equipo de comerciantes experimentados con experiencia comercial de más de 13 años,       Indicador de francotirador de tendencia cuántica       está diseñado para impulsar su viaje comercial a nuevas alturas con su forma innovadora de identificar cambios de tendencia con una precisión extremadamente alta.
Trend Screener Pro MT5
STE S.S.COMPANY
4.87 (63)
Desbloquee el poder del comercio de tendencias con el indicador Trend Screener: ¡su solución definitiva para el comercio de tendencias impulsada por lógica difusa y un sistema multidivisa!Mejore su comercio de tendencias con Trend Screener, el revolucionario indicador de tendencias impulsado por lógica difusa. Es un poderoso indicador de seguimiento de tendencias que combina más de 13 herramientas y funciones premium y 3 estrategias comerciales, lo que lo convierte en una opción versátil para co
Ante todo, vale la pena enfatizar que esta Herramienta de Trading es un Indicador No Repintado, No Redibujado y No Retrasado, lo que la hace ideal para el trading profesional. Curso en línea, manual del usuario y demostración. El Indicador de Conceptos de Acción del Precio Inteligente es una herramienta muy potente tanto para traders nuevos como experimentados. Combina más de 20 indicadores útiles en uno solo, combinando ideas avanzadas de trading como el Análisis del Trader del Círculo Inte
AT Forex Indicator MT5
Marzena Maria Szmit
5 (4)
The AT Forex Indicator MT5 is a sophisticated trading tool designed to provide traders with a comprehensive analysis of multiple currency pairs. This powerful indicator simplifies the complex nature of the forex market, making it accessible for both novice and experienced traders. AT Forex Indicator uses advanced algorithms to detect trends, patterns and is an essential tool for traders aiming to enhance their forex trading performance. With its robust features, ease of use, and reliable signal
TrendMaestro5
Stefano Frisetti
note: this indicator is for METATRADER4, if you want the version for METATRADER5 this is the link:  https://www.mql5.com/it/market/product/108106 TRENDMAESTRO ver 2.4 TRENDMAESTRO recognizes a new TREND in the bud, he never makes mistakes. The certainty of identifying a new TREND is priceless. DESCRIPTION TRENDMAESTRO identifies a new TREND in the bud, this indicator examines the volatility, volumes and momentum to identify the moment in which there is an explosion of one or more of these data a
Este tablero muestra los últimos   patrones armónicos   disponibles para los símbolos seleccionados, por lo que ahorrará tiempo y será más eficiente /   versión MT4 . Indicador gratuito:   Basic Harmonic Pattern Columnas del indicador Symbol:   aparecerán los símbolos seleccionados Trend :   alcista o bajista Pattern :   tipo de patrón (gartley, mariposa, murciélago, cangrejo, tiburón, cifrado o ABCD) Entry :   precio de entrada SL:   precio de stop loss TP1:   1er precio de toma de benefici
Este es un genial indicador para MT5 que ofrece señales precisas para entrar en una transacción sin redibujar. Se puede aplicar a cualquier activo financiero: fórex, criptomonedas, metales, acciones, índices. Nos dará valoraciones bastante precisas y nos dirá cuándo es mejor abrir y cerra una transacción. Eche un vistazo  al vídeo  (6:22), ¡contiene un ejemplo de procesamiento de una sola señal que ha amortizado el indicador! La mayoría de los tráders mejoran sus resultados comerciales durante l
FxaccurateLS
Shiv Raj Kumawat
WHY IS OUR FXACCCURATE LS MT5 THE PROFITABLE ? PROTECT YOUR CAPITAL WITH RISK MANAGEMENT Gives entry, stop and target levels from time to time. It finds Trading opportunities by analyzing what the price is doing during established trends. POWERFUL INDICATOR FOR A RELIABLE STRATEGIES We have made these indicators with a lot of years of hard work. It is made at a very advanced level. Established trends provide dozens of trading opportunities, but most trend indicators completely ignore them!
Advanced Supply Demand MT5
Bernhard Schweigert
4.5 (14)
¡Actualmente con 33% de descuento! ¡La mejor solución para cualquier tráder principiante o experto! Este indicador es una herramienta comercial única, de alta calidad y asequible, porque incorpora una serie de características patentadas y una nueva fórmula. Con esta actualización, podrá mostrar zonas de doble marco temporal. No solo podrá mostrar un marco temporal más alto, sino también mostrar ambos, el marco temporal del gráfico MÁS el marco temporal más alto: MOSTRANDO ZONAS ANIDADAS. A todos
TPA True Price Action indicator reveals the true price action of the market makers through 100% non-repainting signals strictly at the close of a candle! TPA shows entries and re-entries, every time the bulls are definitely stronger than the bears and vice versa. Not to confuse with red/green candles. The shift of power gets confirmed at the earliest stage and is ONE exit strategy of several. There are available now two free parts of the TPA User Guide for our customers. The first "The Basics"
ICT, SMC, Smart Money Concept, Soporte y Resistencia, Análisis de Tendencias, Acción del Precio, Estructura del Mercado, Bloques de Órdenes, Bloques Rompedores, Cambio de Momentum, Fuerte Desbalance, HH/LL/HL/LH, Brecha de Valor Justo, FVG, Zonas de Prima y Descuento, Retroceso de Fibonacci, OTE, Liquidez en el Lado Comprador, Liquidez en el Lado Vendedor, Vacíos de Liquidez, Sesiones de Mercado, NDOG, NWOG, Bala de Plata, Plantilla ICT. En el mercado financiero, el análisis de mercado precis
Blahtech Supply Demand MT5
Blahtech Limited
4.54 (13)
Was: $299  Now: $99   Supply Demand uses previous price action to identify potential imbalances between buyers and sellers. The key is to identify the better odds zones, not just the untouched ones. Blahtech Supply Demand indicator delivers functionality previously unavailable on any trading platform. This 4-in-1 indicator not only highlights the higher probability zones using a multi-criteria strength engine, but also combines it with multi-timeframe trend analysis, previously confirmed swings
Auto Order Block with break of structure based on ICT and Smart Money Concepts (SMC) Futures Break of Structure ( BoS )             Order block ( OB )            Higher time frame Order block / Point of Interest ( POI )    shown on current chart           Fair value Gap ( FVG ) / Imbalance   -  MTF      ( Multi Time Frame )    HH/LL/HL/LH  -  MTF      ( Multi Time Frame )  Choch  MTF      ( Multi Time Frame )  Volume Imbalance     ,  MTF          vIMB Gap’s Power of 3 Equal High
ICT, SMC, SMART MONEY CONCEPTS, SMART MONEY, Smart Money Concept, Support and Resistance, Trend Analysis, Price Action, Market Structure, Order Blocks, BOS/CHoCH,   Breaker Blocks ,  Momentum Shift,   Supply&Demand Zone/Order Blocks , Strong Imbalance,   HH/LL/HL/LH,    Fair Value Gap, FVG,  Premium  &   Discount   Zones, Fibonacci Retracement, OTE, Buy Side Liquidity, Sell Side Liquidity, BSL/SSL Taken, Equal Highs & Lows, MTF Dashboard, Multiple Time Frame, BigBar, HTF OB, HTF Market Structure
IX Power MT5
Daniel Stein
4.17 (6)
IX Power   lleva por fin la insuperable precisión de FX Power a los símbolos que no son de Forex. Determina con exactitud la intensidad de las tendencias a corto, medio y largo plazo de tus índices, acciones, materias primas, ETF e incluso criptodivisas favoritas. Puede   analizar todo lo   que su terminal le ofrece. Pruébalo y experimenta cómo   tu timing mejora significativamente   a la hora de operar. Características principales de IX Power Resultados de cálculo 100% precisos y sin rep
** All Symbols x All Timeframes scan just by pressing scanner button ** *** Contact me  to send you instruction and add you in "123 scanner group" for sharing or seeing experiences with other users. After 17 years of experience in the markets and programming, Winner indicator is ready. I would like to share with you! Introduction The 123 Pattern Scanner indicator with a special enhanced algorithm is a very repetitive common pattern finder with a high success rate . Interestingly, this Winner in
Black Dragon indicator mt5
Ramil Minniakhmetov
4.81 (54)
El indicador de detección de tendencias complementará cualquier estrategia y también se puede utilizar como una herramienta independiente. Ventajas Fácil de usar, no sobrecarga el gráfico con información innecesaria; Puede usarse como filtro para cualquier estrategia; Tiene niveles integrados de soporte y resistencia dinámicos, que se pueden usar tanto para obtener ganancias como para establecer límites de pérdidas; El indicador no cambia de color después de que se cierra la vela;  Funciona
XQ Indicator MetaTrader 5
Marzena Maria Szmit
3 (2)
Step into the realm of Forex trading with confidence and precision using XQ, a cutting-edge Forex indicator designed to elevate your trading game to unprecedented heights. Whether you're a seasoned trader or just stepping into the world of currency exchange, XQ Forex Indicator empowers you with the insights and signals needed to make informed trading decisions. The signal conditions are a combination of three indicators, and XQ Forex Indicator only display  medium and long-term trends . The ind
FX Volume MT5
Daniel Stein
4.93 (14)
Obtenga su actualización diaria del mercado con detalles y capturas de pantalla a través de nuestro Morning Briefing aquí en mql5 y en Telegram ! FX Volume es el PRIMER y ÚNICO indicador de volumen que proporciona una visión REAL del sentimiento del mercado desde el punto de vista de un bróker. Proporciona una visión impresionante de cómo los participantes institucionales del mercado, como los brokers, están posicionados en el mercado Forex, mucho más rápido que los informes COT. Ver esta info
Was: $249  Now: $99   Market Profile defines a number of day types that can help the trader to determine market behaviour. A key feature is the Value Area, representing the range of price action where 70% of trading took place. Understanding the Value Area can give traders valuable insight into market direction and establish the higher odds trade. It is an excellent addition to any system you may be using. Inspired by Jim Dalton’s book “Mind Over Markets”, this indicator is designed to suit the
Gartley Hunter Multi
Siarhei Vashchylka
5 (8)
Gartley Hunter Multi - An indicator for searching for harmonic patterns simultaneously on dozens of trading instruments and on all possible timeframes. Manual (Be sure to read before purchasing) | Version for MT4 Advantages 1. Patterns: Gartley, Butterfly, Shark, Crab. Bat, Alternate Bat, Deep Crab, Cypher 2. Simultaneous search for patterns on dozens of trading instruments and on all possible timeframes 3. Search for patterns of all possible sizes. From the smallest to the largest 4. A
Este panel descubre y muestra las zonas de   Oferta   y   Demanda   en el gráfico, tanto en modo scalping como a largo plazo, dependiendo de su estrategia de trading para los símbolos seleccionados. Además, el modo de escáner del tablero le ayuda a comprobar todos los símbolos deseados de un vistazo y no perder ninguna posición adecuada /   Versión MT4 Indicador gratuito:   Basic Supply Demand Características Le permite ver las oportunidades de negociación en   múltiples pares de divisa
Stratos Pali mt5
Michela Russo
5 (1)
Stratos Pali Indicator is a revolutionary tool designed to enhance your trading strategy by accurately identifying market trends. This sophisticated indicator uses a unique algorithm to generate a complete histogram, which records when the trend is Long or Short. When a trend reversal occurs, an arrow appears, indicating the new direction of the trend. Important Information Revealed Leave a review and contact me via mql5 message to receive My Top 5 set files for Stratos Pali at no cost ! Do
Otros productos de este autor
El indicador funciona con dos períodos de tiempo, tiene una visualización de eventos directamente en el gráfico de trabajo y puede mostrar niveles horizontales que sirven como niveles de soporte/resistencia. Los diferentes valores de los volúmenes formados se muestran como una marca de color en la barra correspondiente, a partir de la cual se construyen los niveles, dirigidos hacia el lado derecho del gráfico. En el gráfico de trabajo, también se muestran los niveles recibidos del período de tie
Deal Calculator
Aleksandr Puchkin
La calculadora de operaciones le permite calcular los parámetros de una operación antes de abrirla y obtener los valores del margen, el volumen de la operación y el riesgo, lo que le permite evaluar con bastante precisión la operación tanto en términos de posibles pérdidas como de ganancias. También muestra el método de cálculo para el instrumento actual, la moneda de beneficio, la tasa de conversión, la moneda base, el tamaño de la equidad, el volumen de la posición, el riesgo en porcentaje, lo
Filtro:
No hay comentarios
Respuesta al comentario
Versión 1.2 2023.05.02
Changed the way to switch modes.
Versión 1.1 2023.03.20
Fixed description of settings item